Concept explainers
Concept explainers on key differentiators of APEX AIOps Incident Management
BASIC | 4 MIN
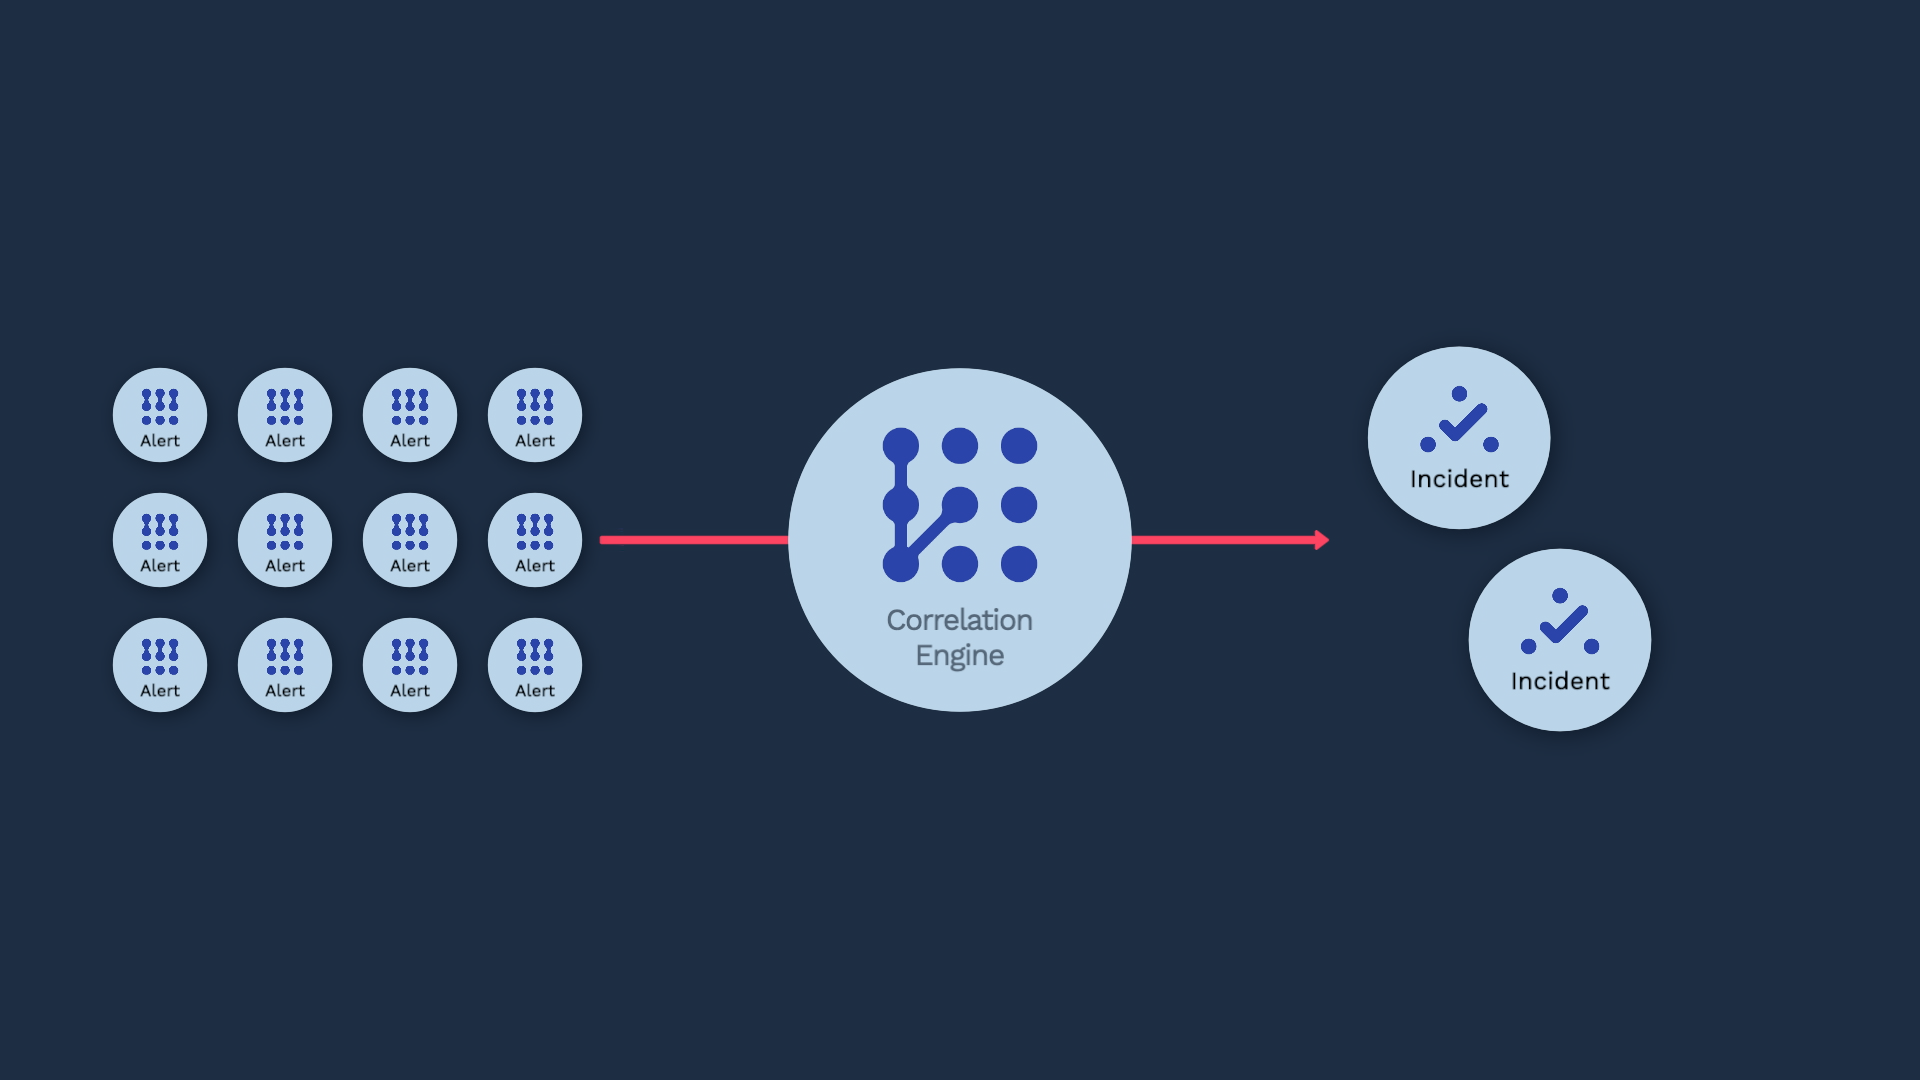
Incident Management’s correlation engine clusters alerts into incidents based on their relatedness. The way this works is fundamentally different from a rules-based categorization. In this video, you’ll learn exactly how.
Concept explainer: Algorithms vs rules in APEX AIOps Incident Management ►
This video explains the difference between Algorithms vs Rules in APEX AIOps Incident Management, and how Incident Management's correlation engine uses artificial intelligence and natural language processing to identify similar alerts.
*Please note Moogsoft is now part of Dell's IT Operations solution called APEX AIOps, and changed its name to APEX AIOps Incident Management. The UI in this video may differ slightly but the content covered is still relevant.
Incident Management’s correlation engine clusters alerts into incidents based on their relatedness. The way this works is fundamentally different from a rule-based categorization. In this video, you’ll learn exactly how.
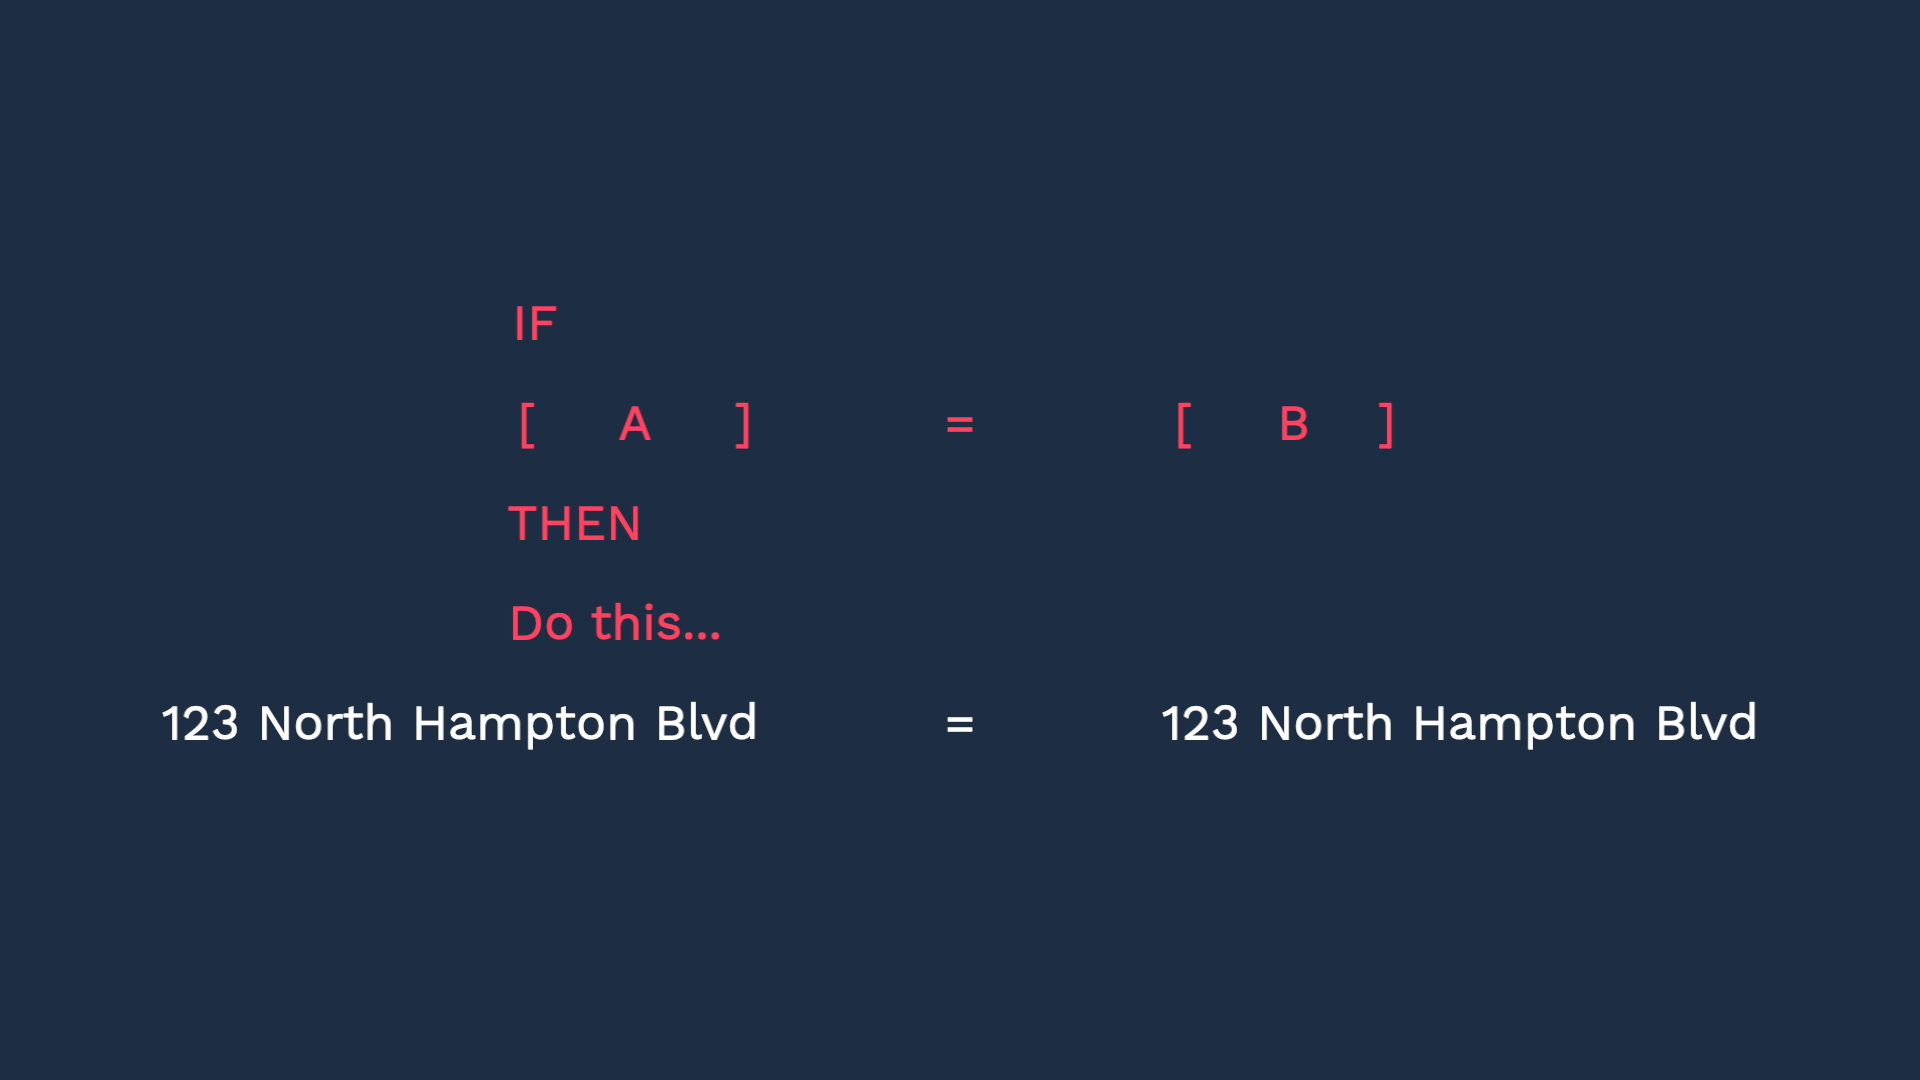
Let’s use a really simple example. Suppose our company has retail locations all over the country, and we want to group issues by location of the shops. We’ll start with an easy one - what if two alerts had identical address information. It’s easy to write a rule that includes one conditional statement to detect this.
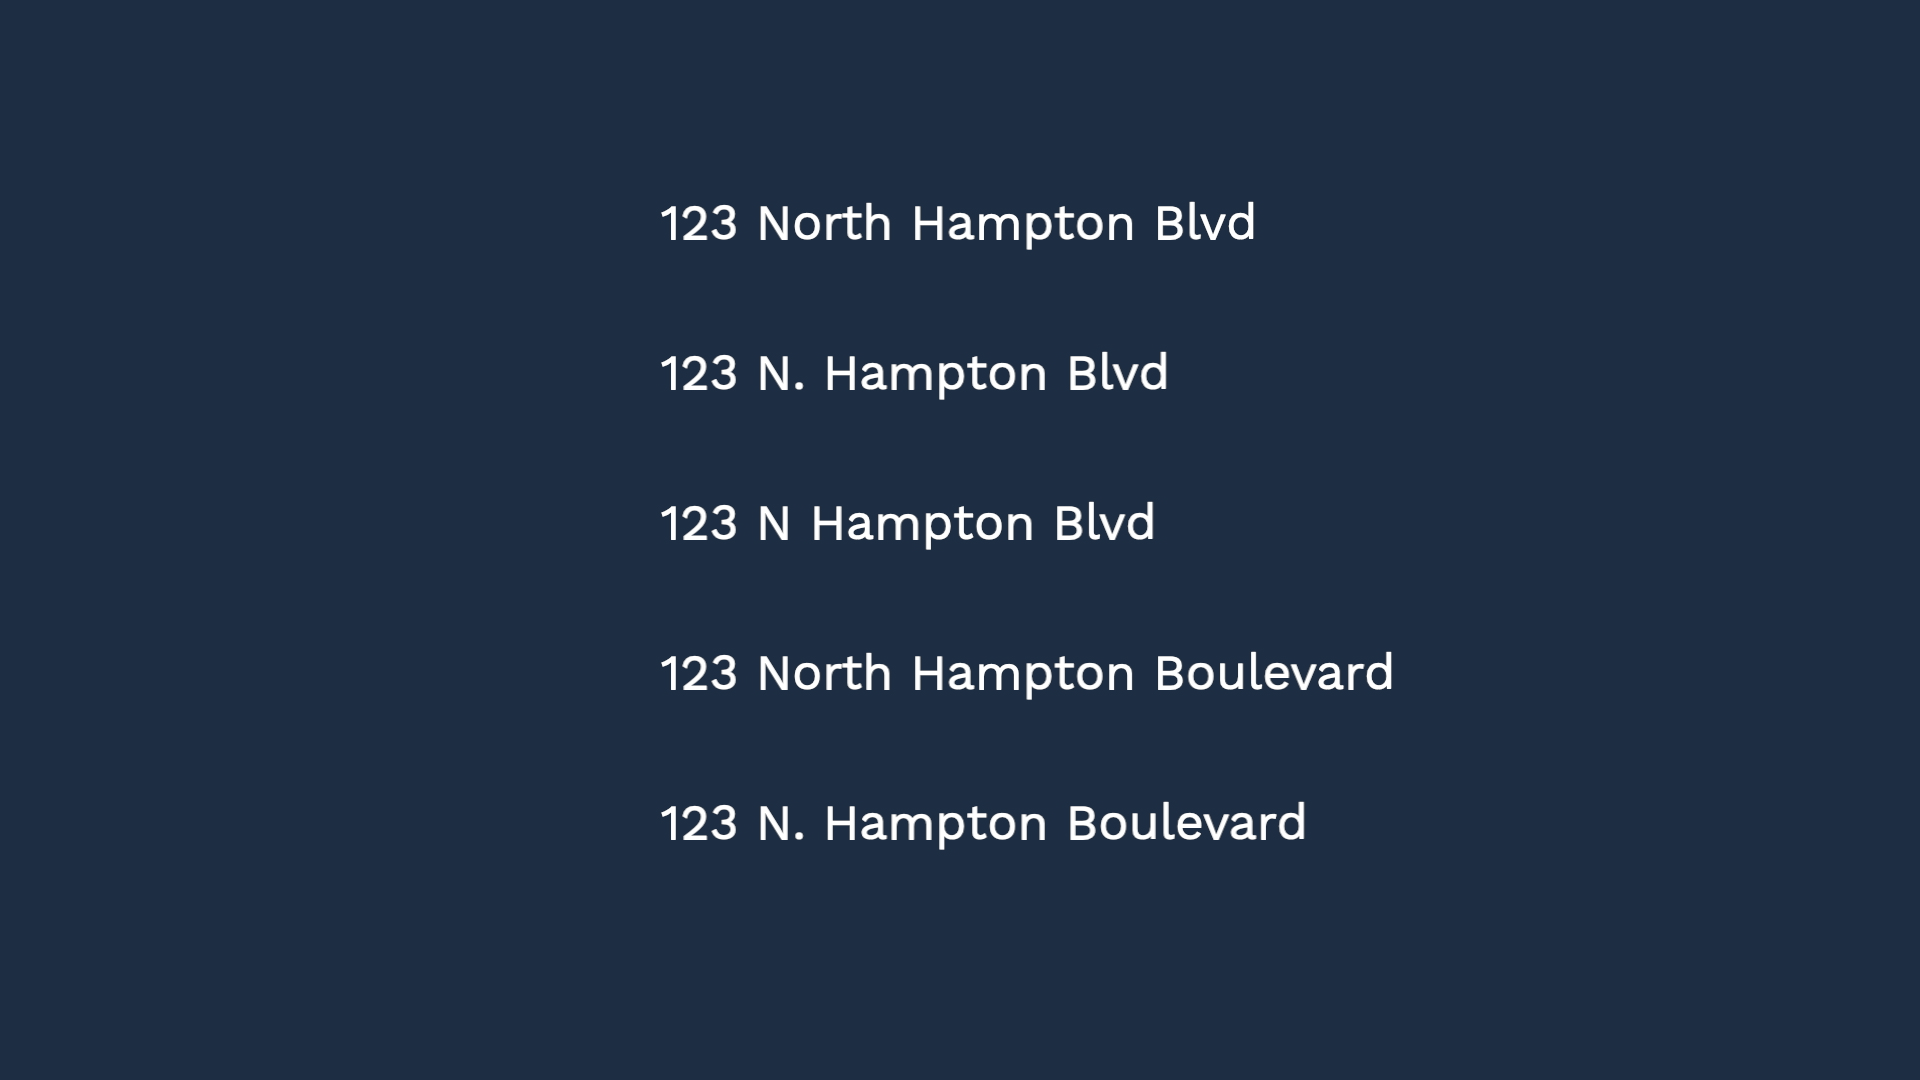
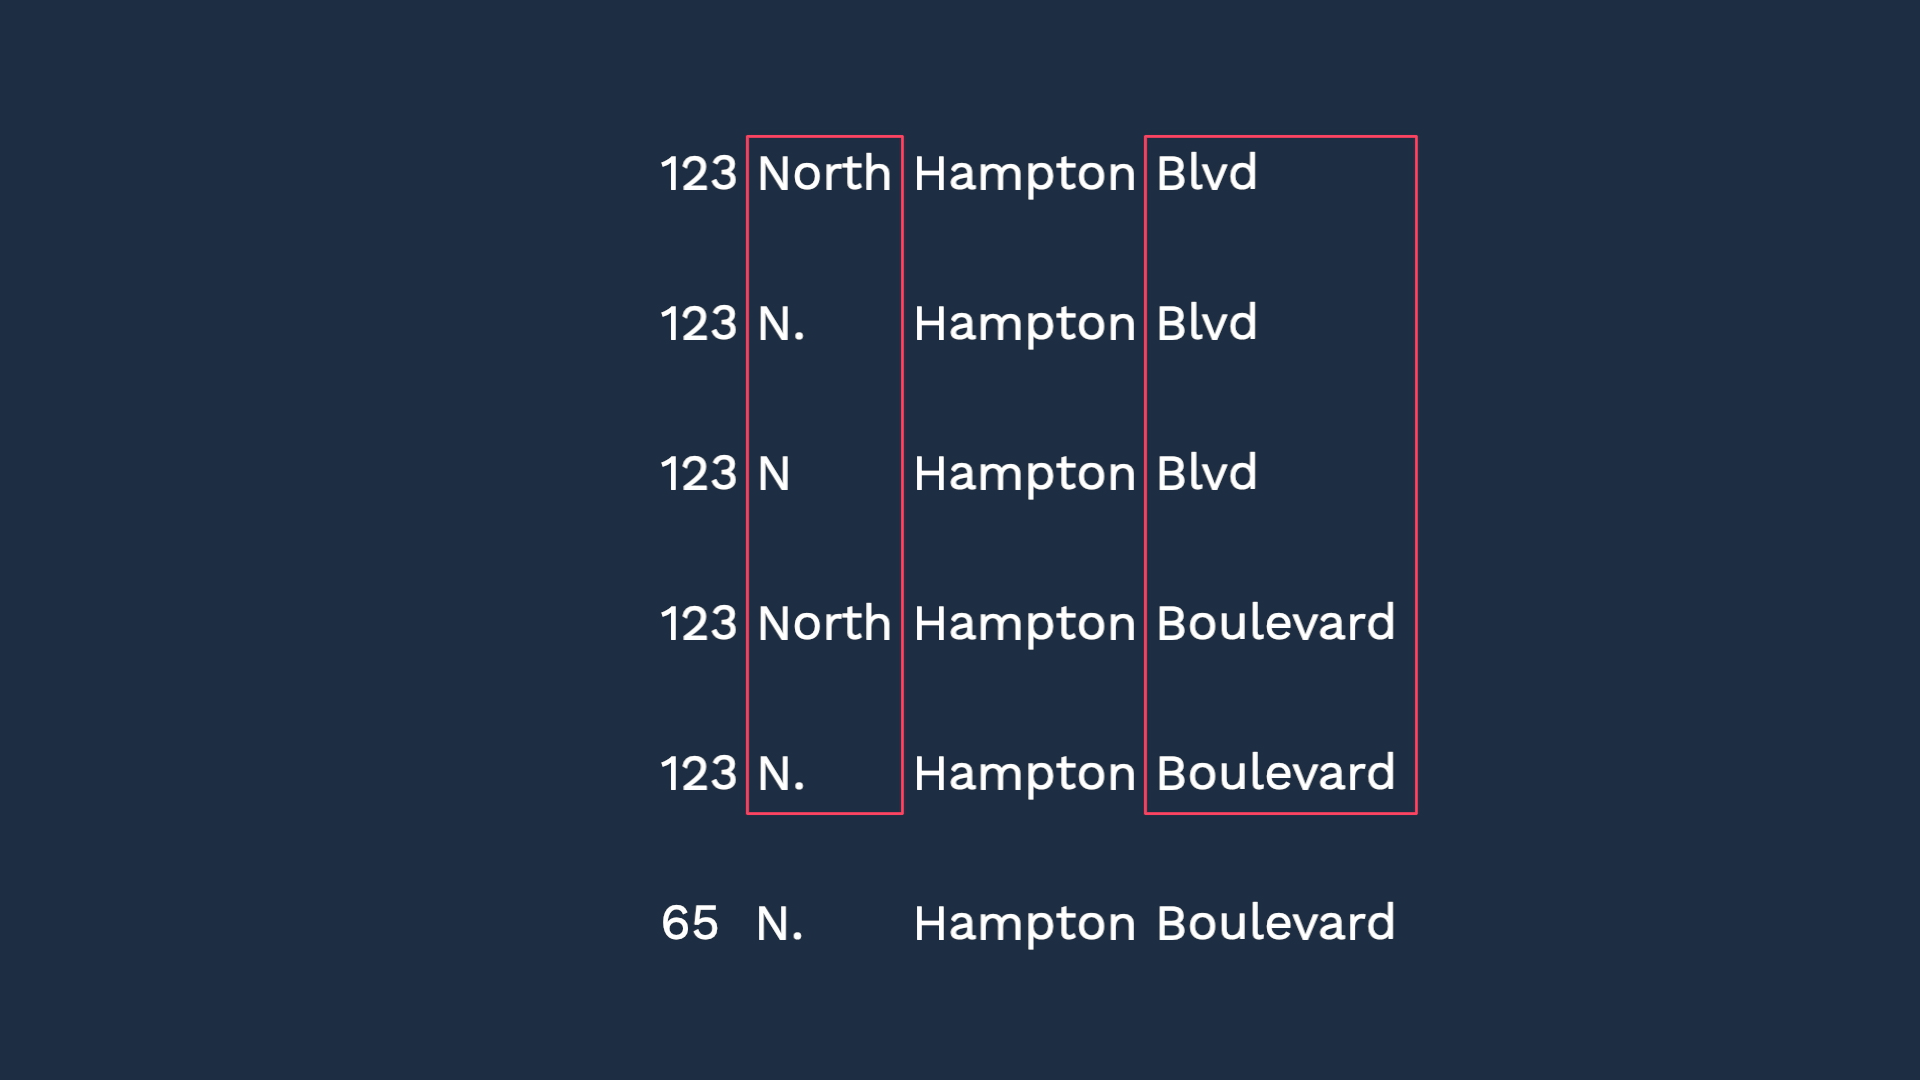
But our environment is not that uniform. For example, you may have multiple source monitoring systems, and each one may use a slightly different naming convention. Further, even within one system, some administrators may not be so careful about consistency. So what If the events came from these 5 different addresses? To the human eye, it’s easy to determine they all point to the same place, but...
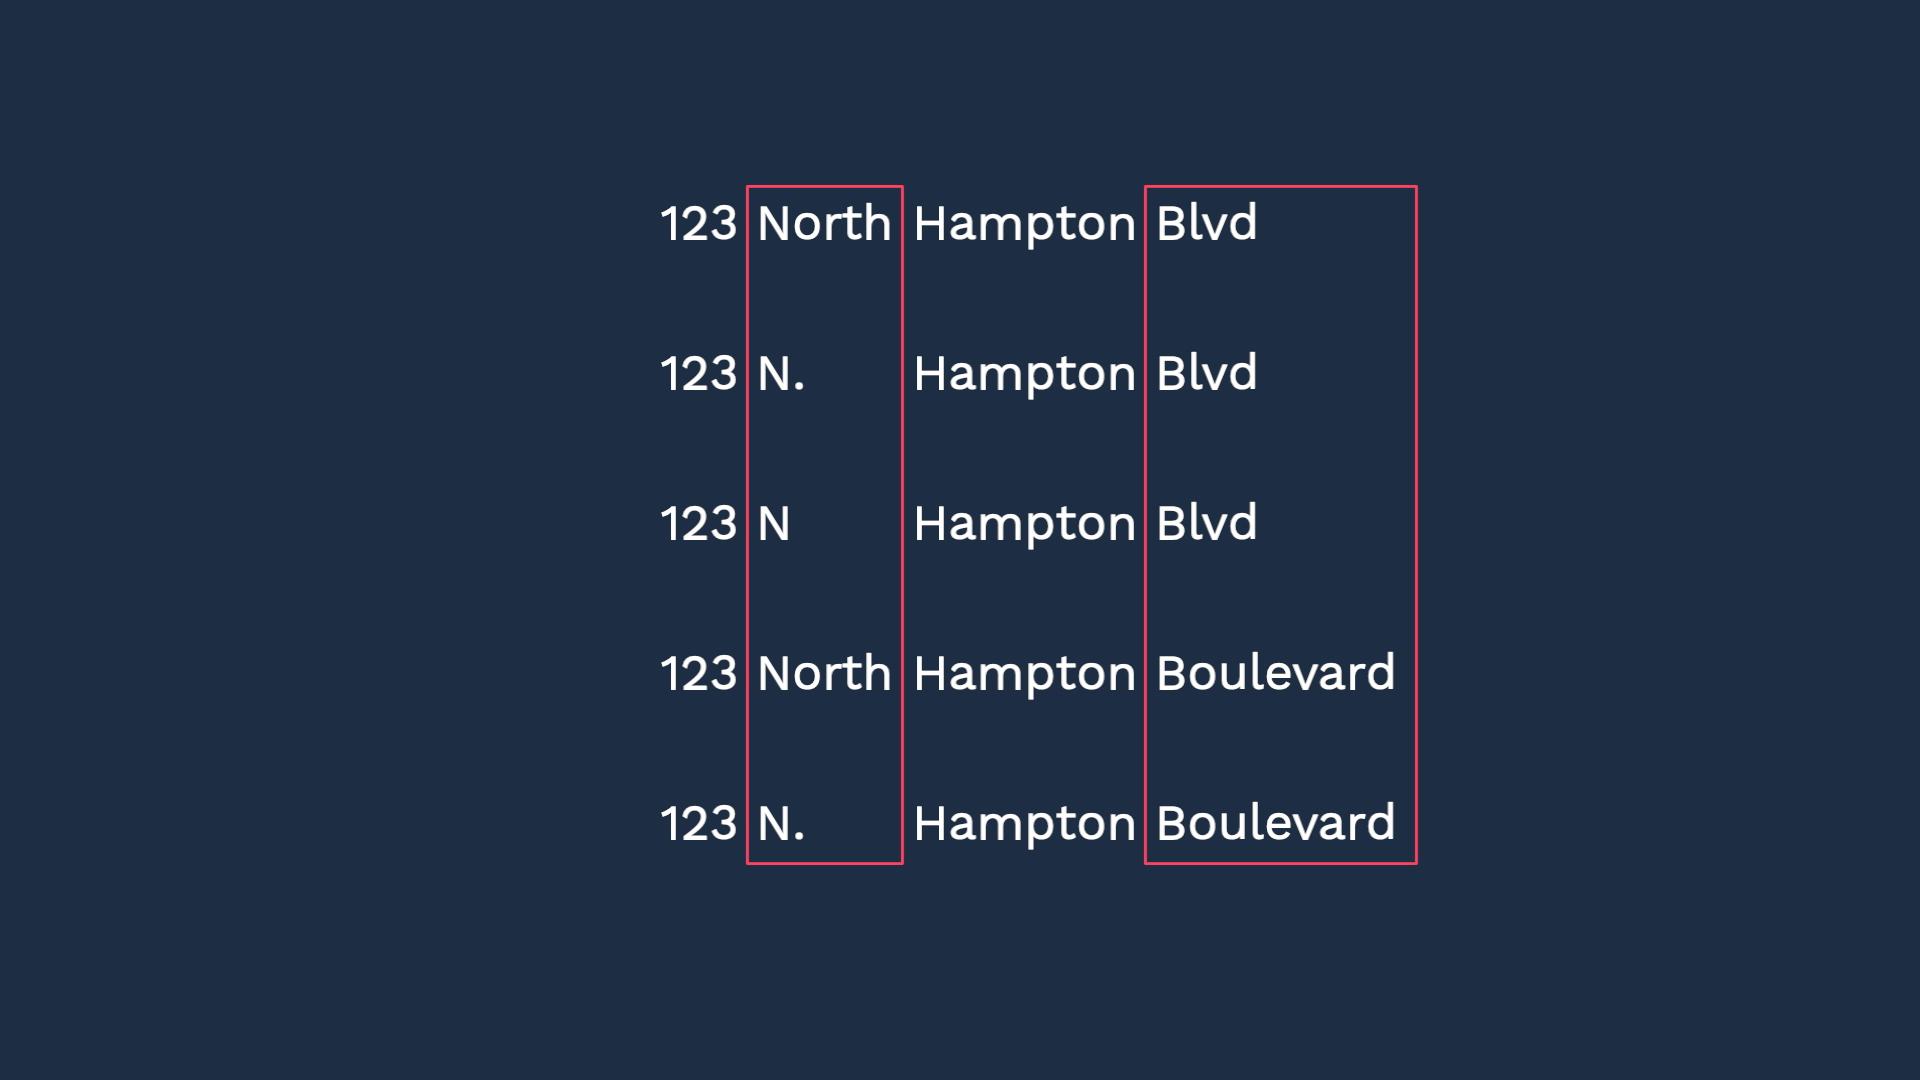
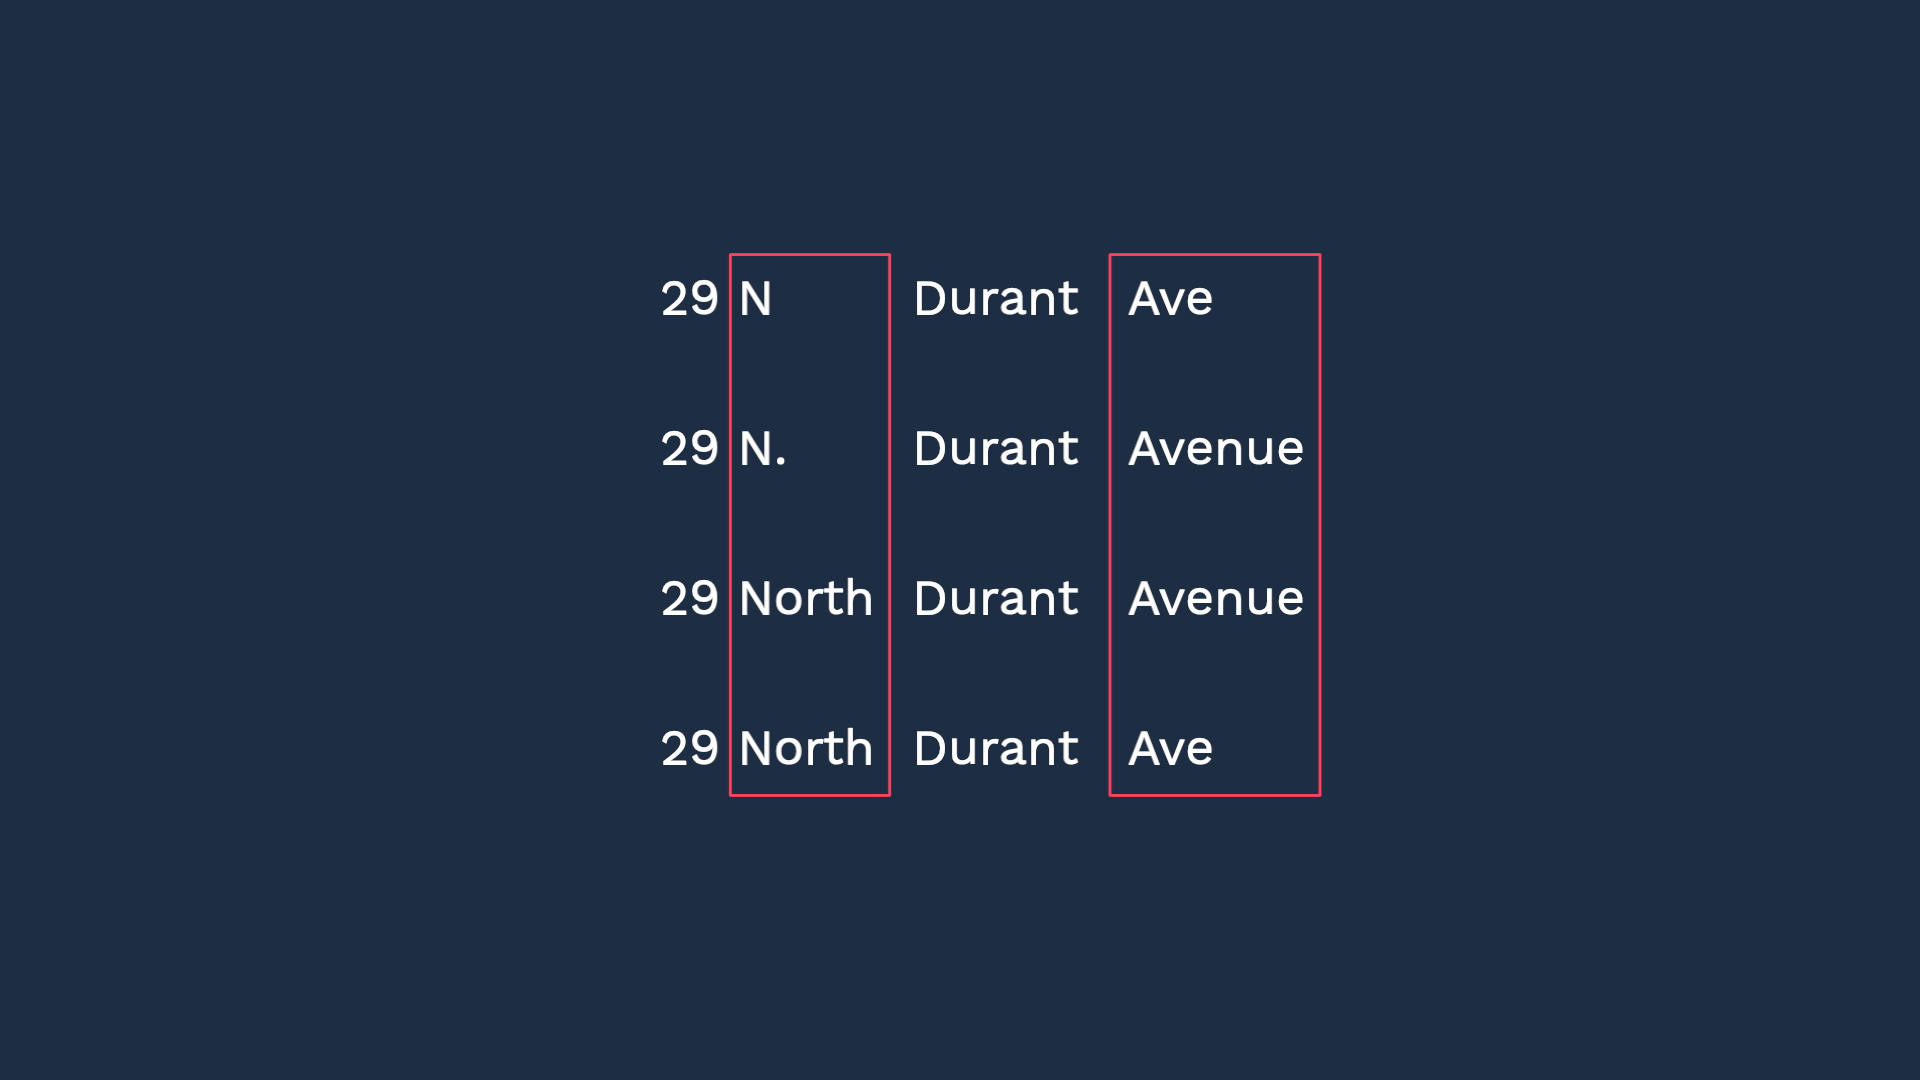
To recognize all these variations, we need to set up a rule to recognize N, N., and North as the same thing. Then do the same with “blvd”, and “boulevard."
But then, here’s another store address that’s very similar.
While we are at it, we should take care of the shops on the East and West Hampton blvd, too.
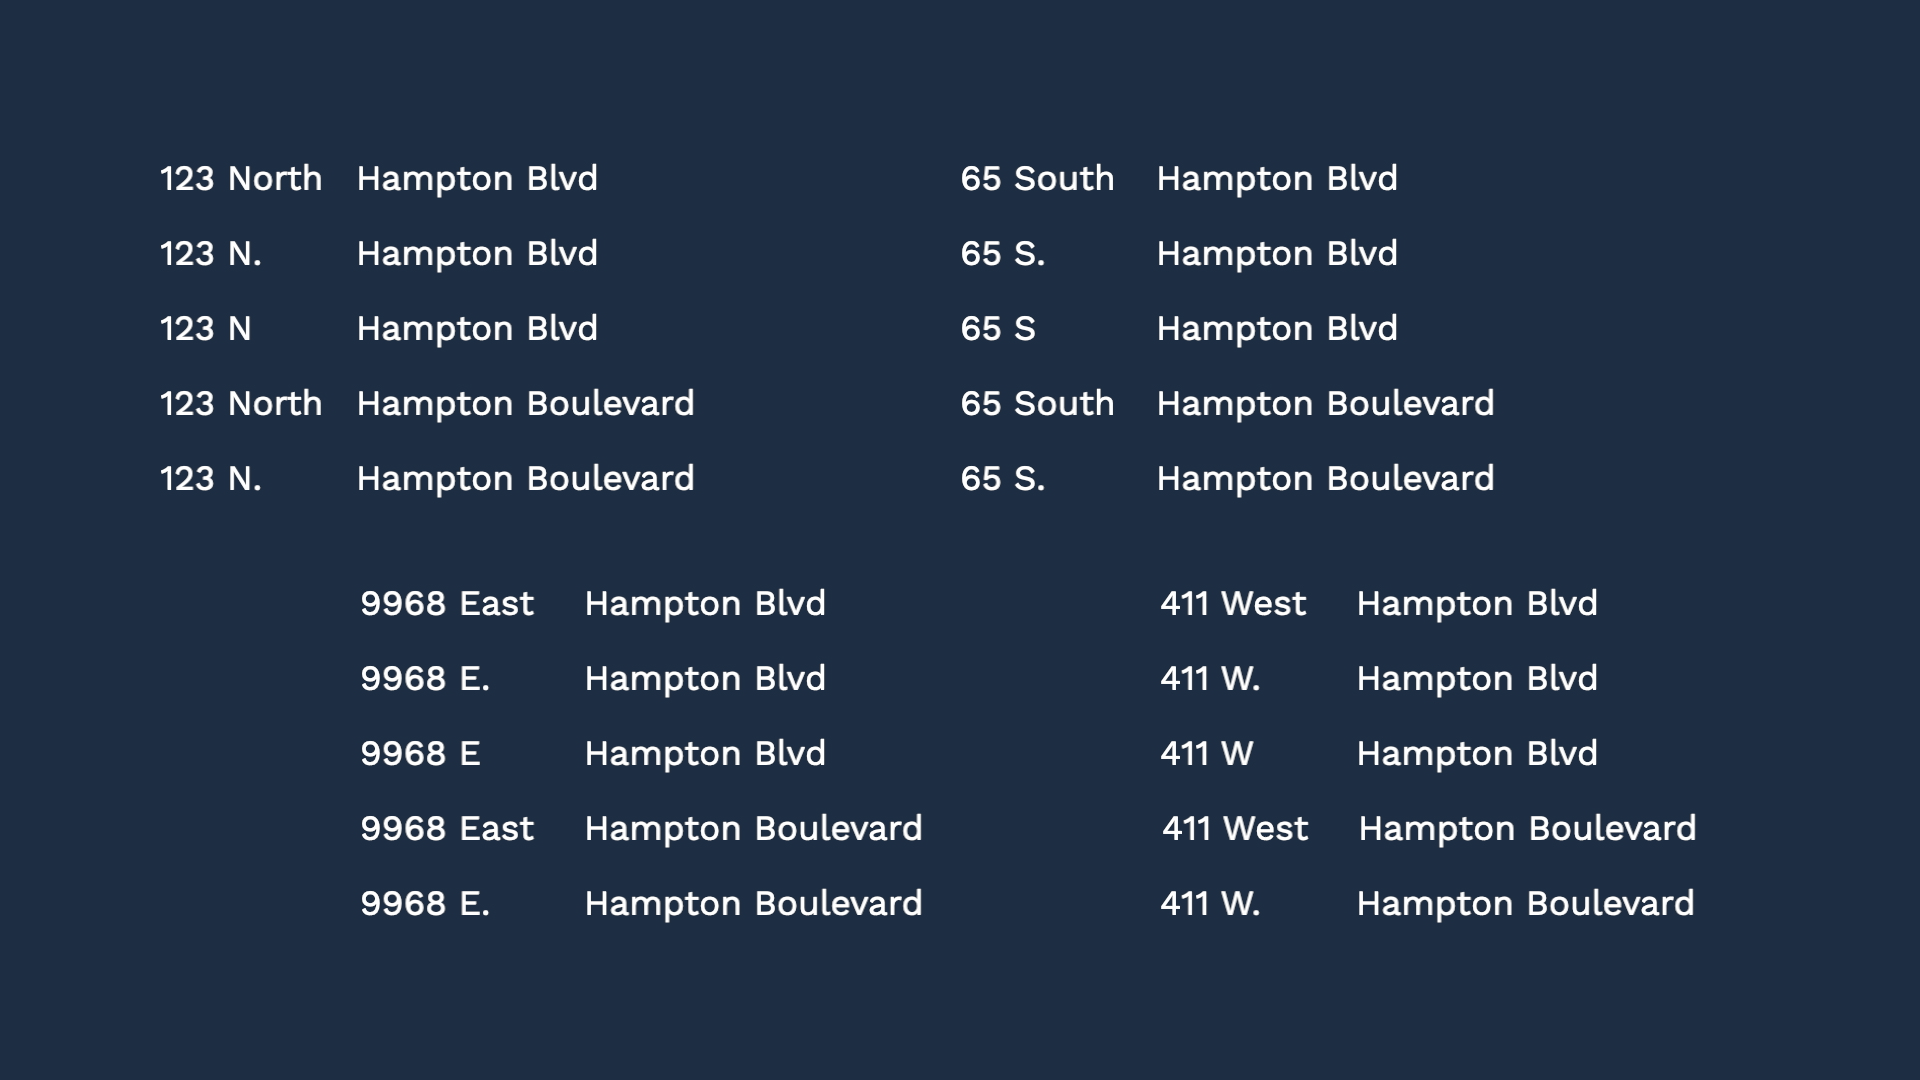
We’ve got to write rules to make sure all of these variations are recognized as the same address while making sure we don’t mix up these 4 stores.
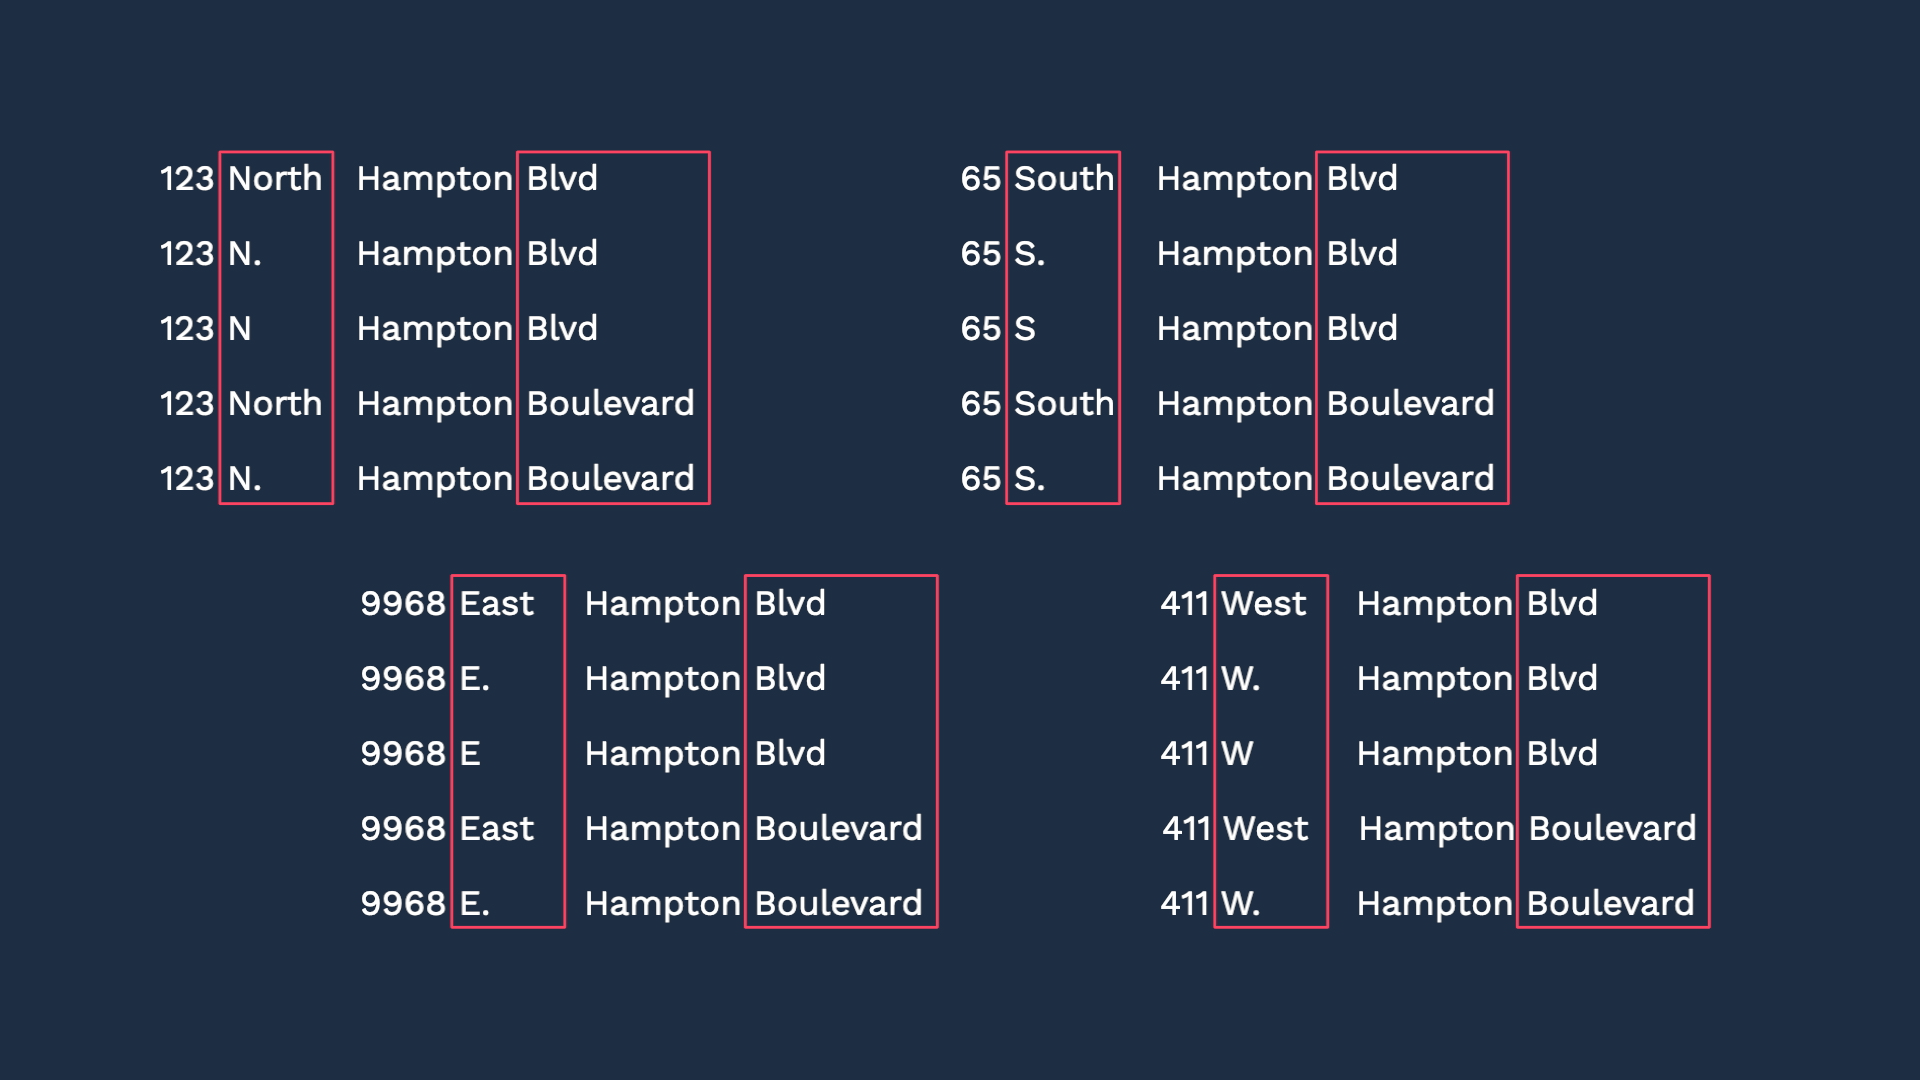
What’s so obvious to the human eye and brain often takes a lot of IF - THENs.
Incident Management’s correlation engine can identify the similarity of these items while differentiating where needed.

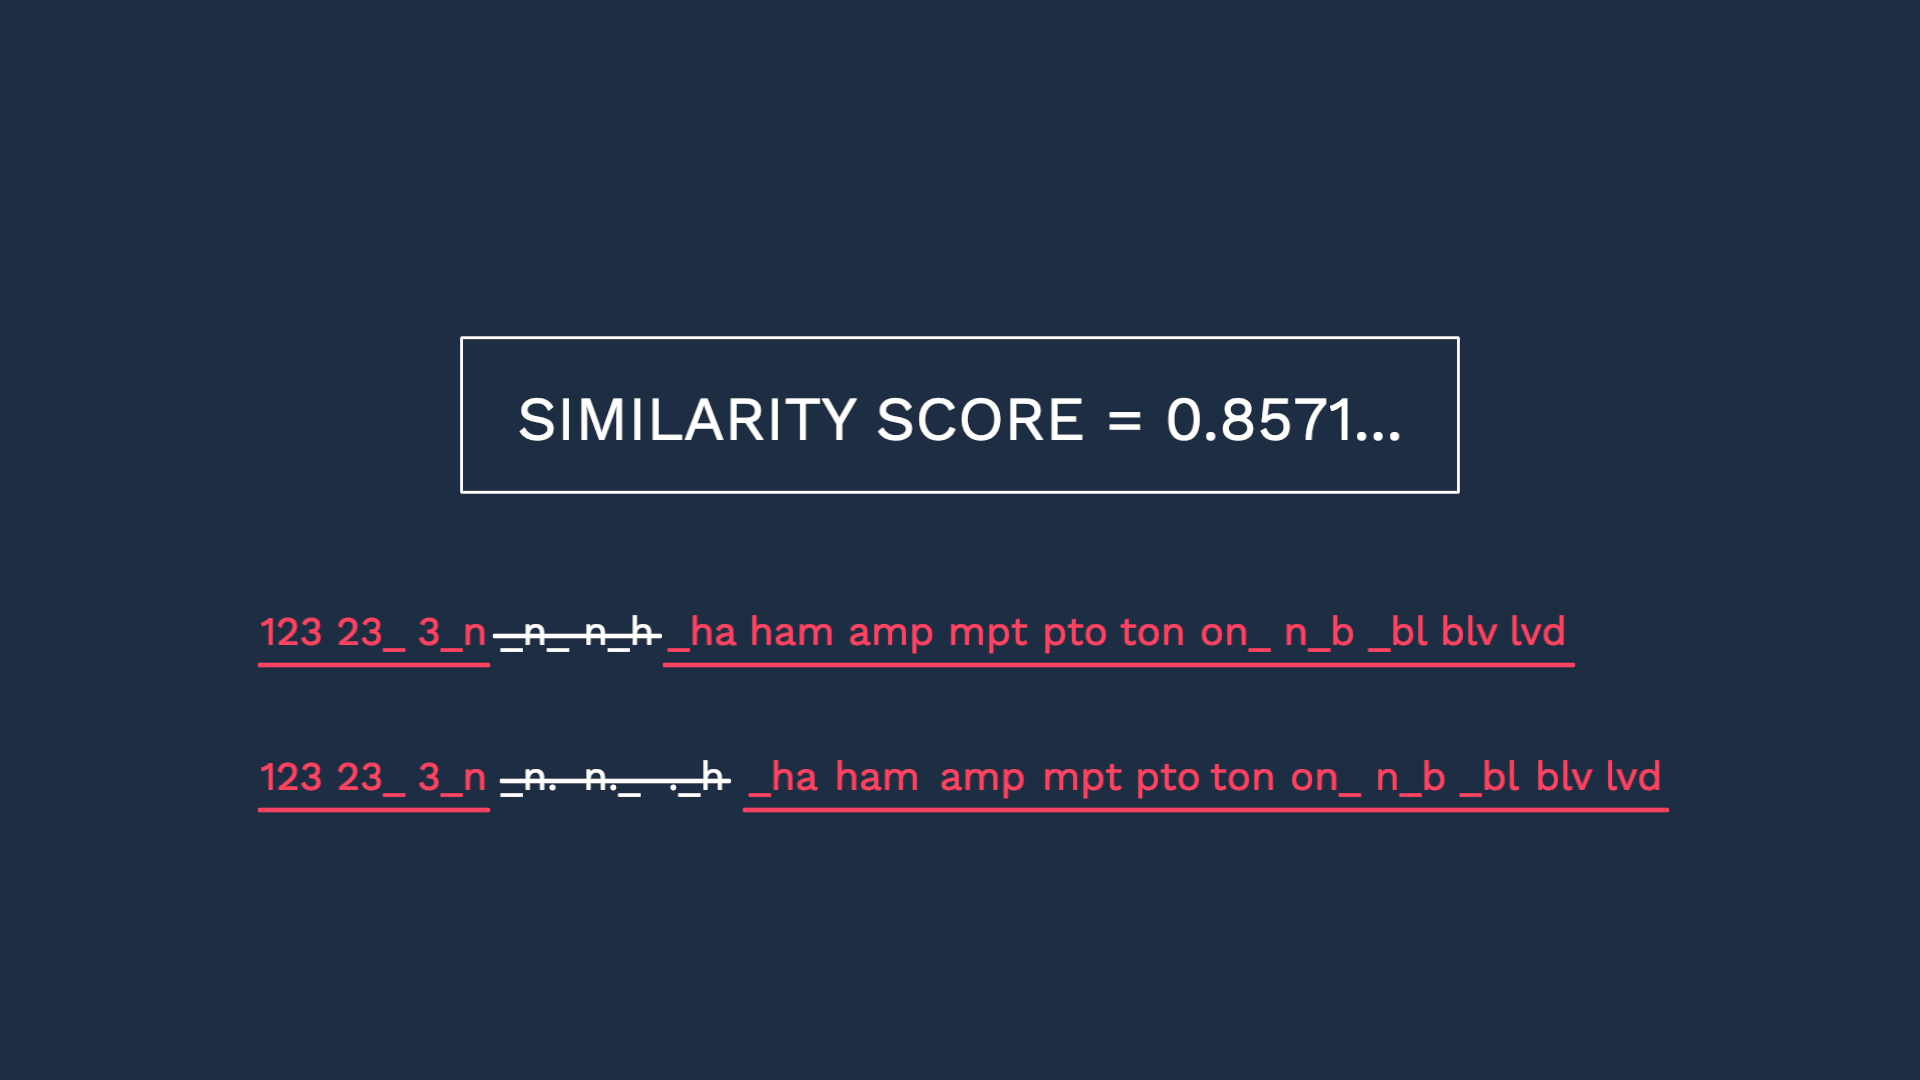
This example uses the technique called shingle size to calculate similarity,
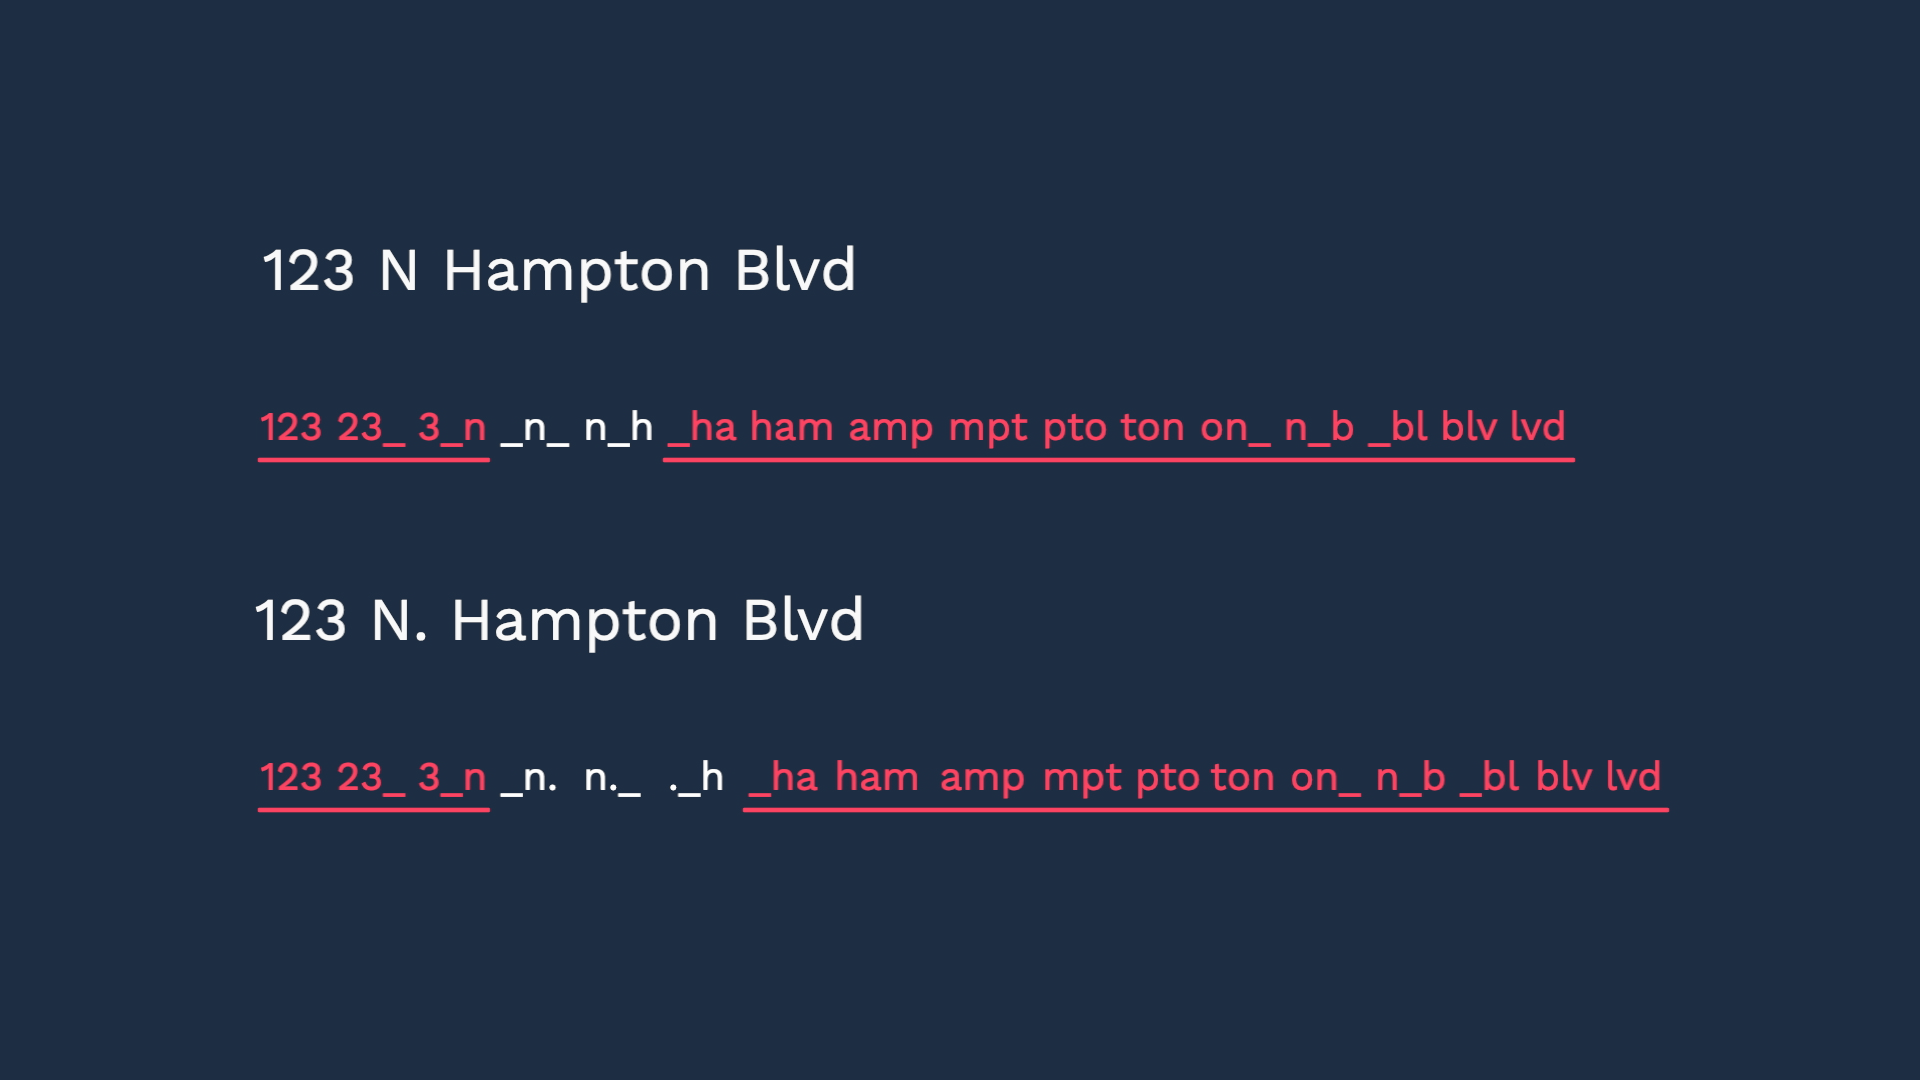
These two variations are 86% similar.
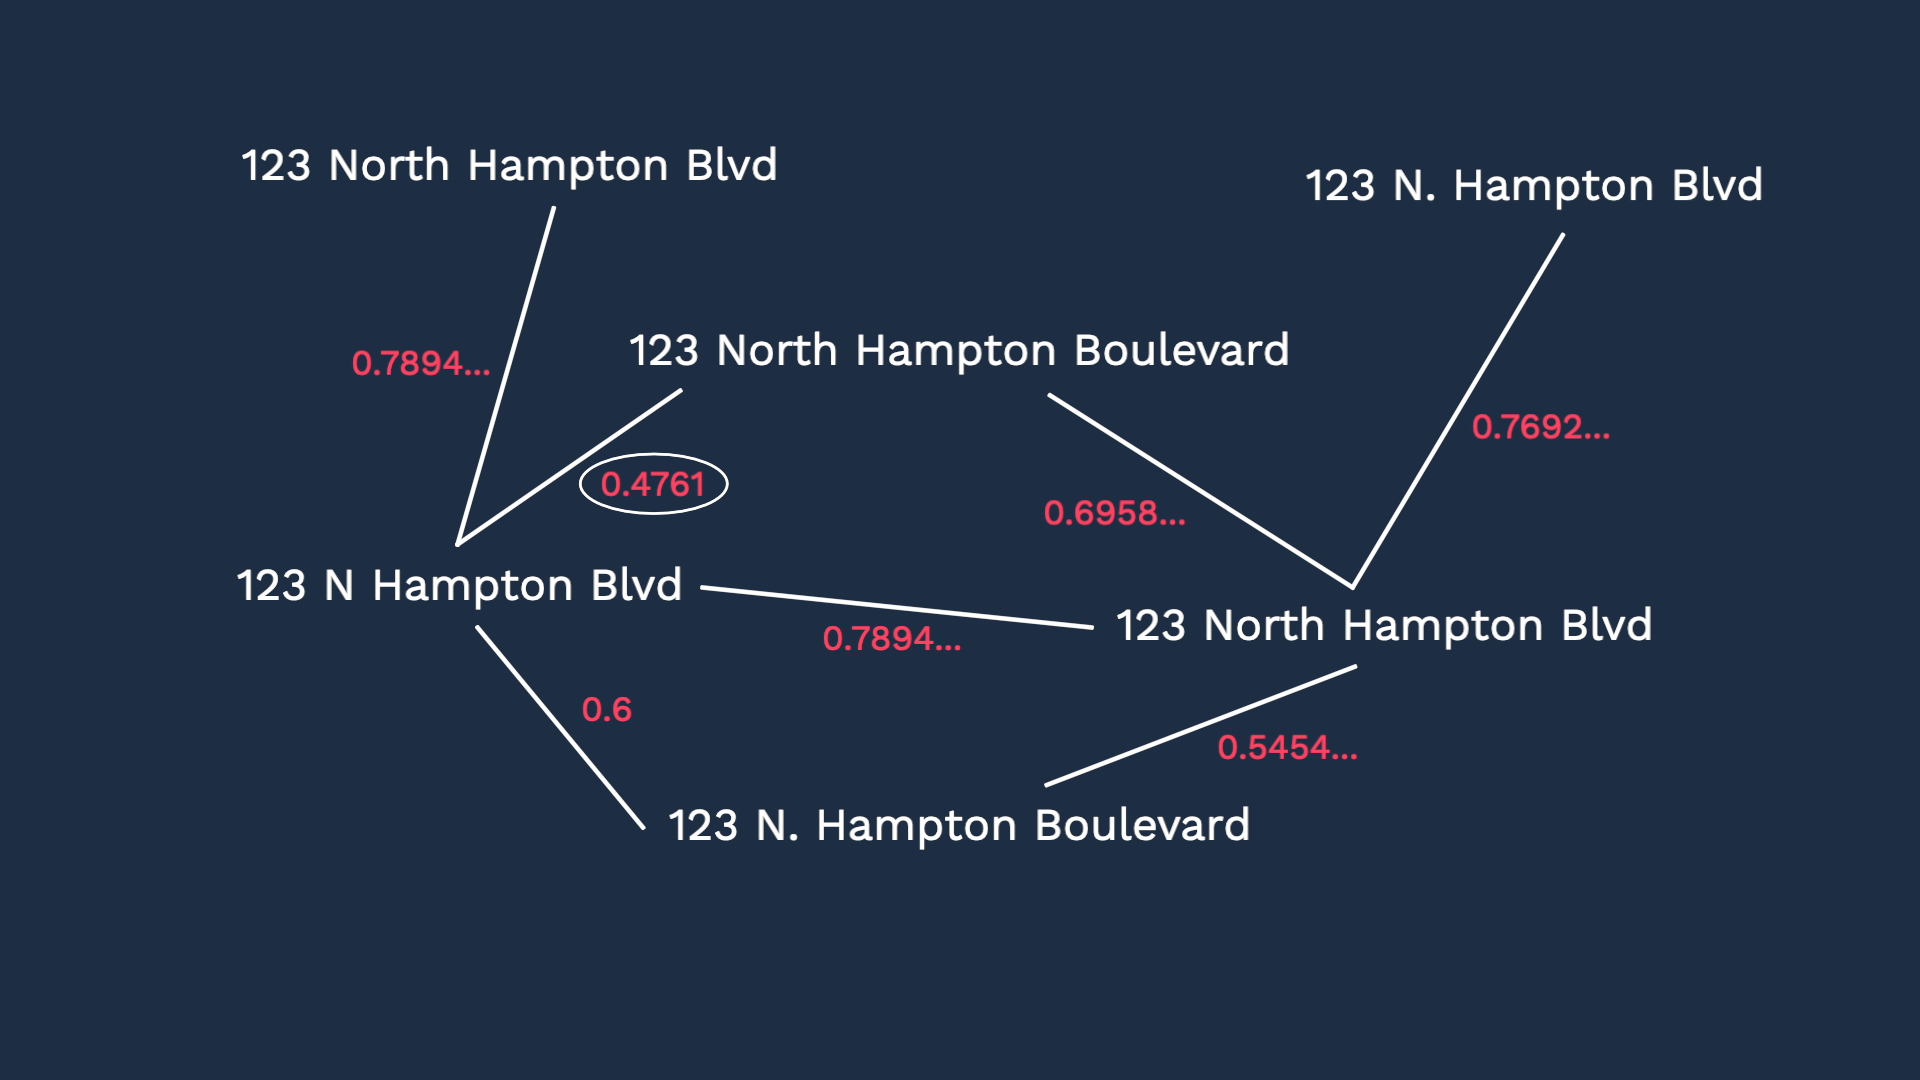
In the same manner, the similarity at the shingle level can be calculated between all variations. In this example, looks like the lowest score is around 48%
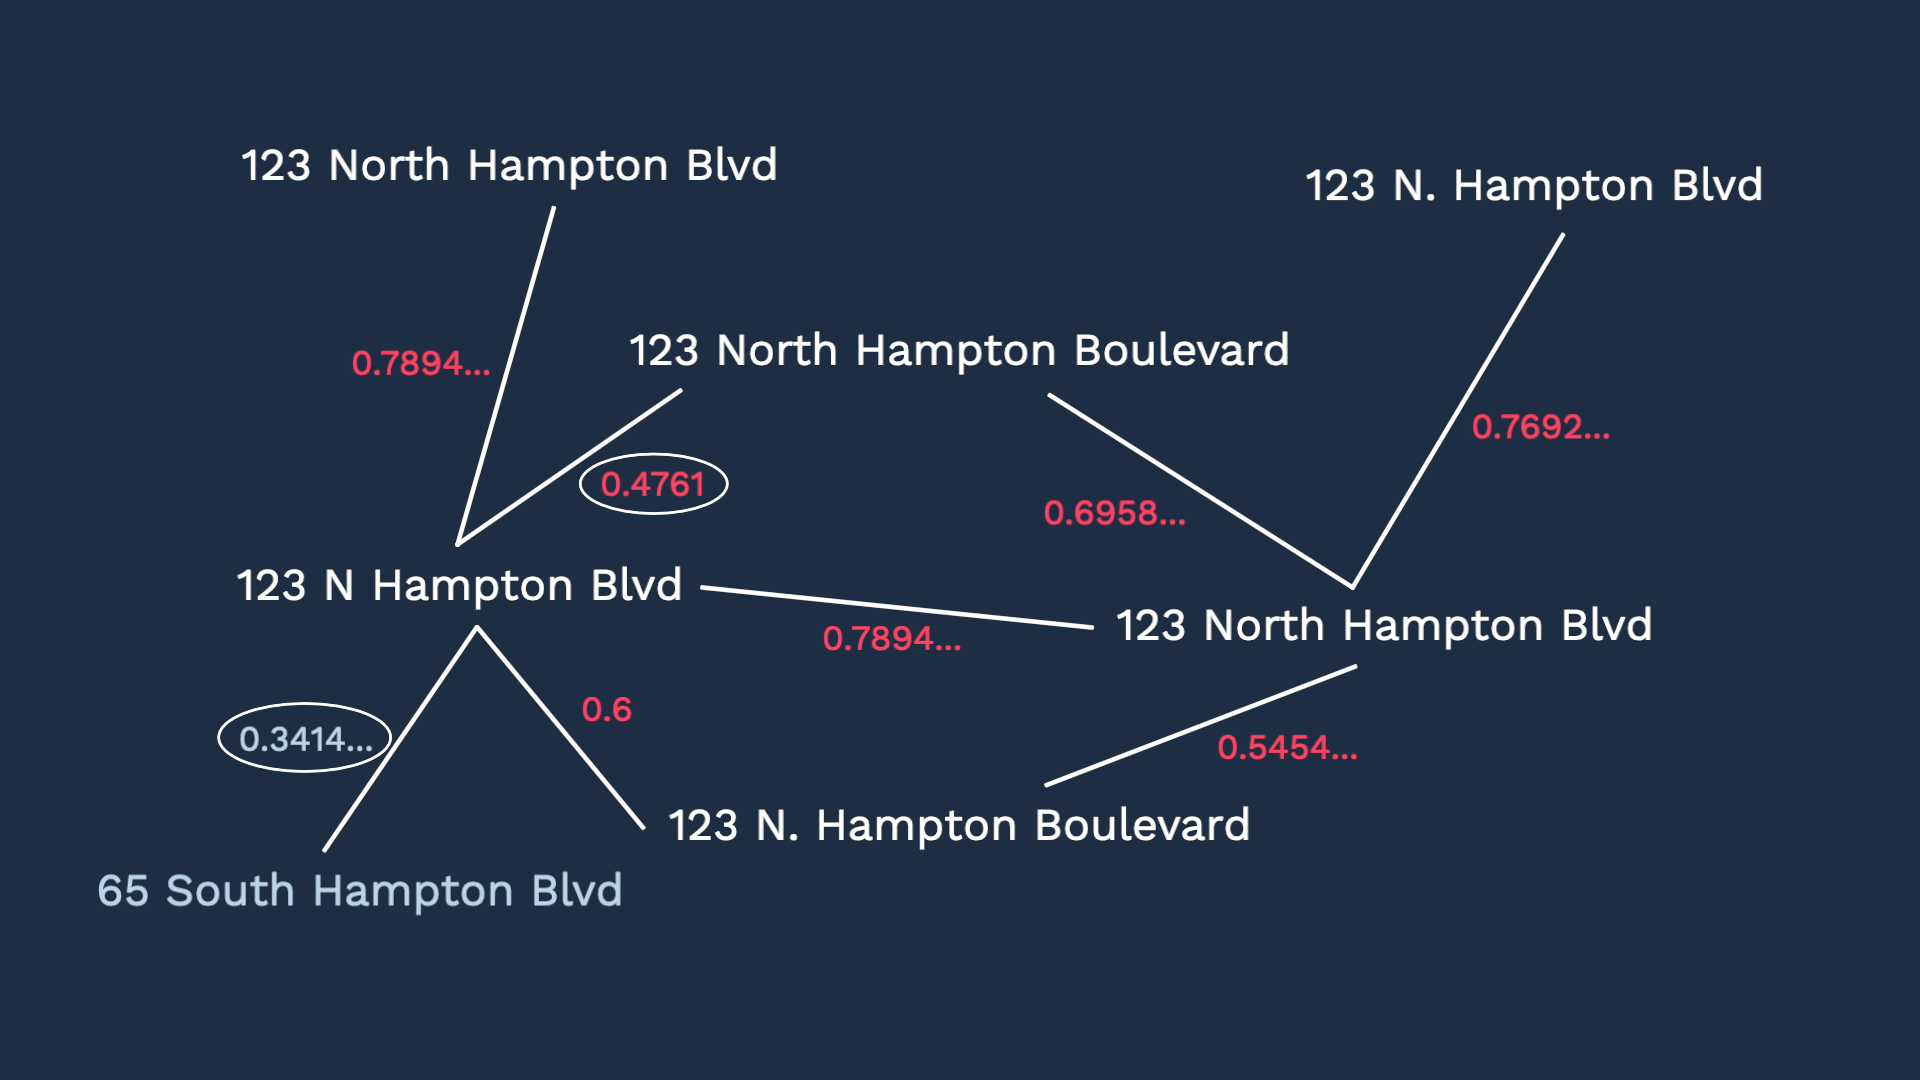
Now, if you calculate the similarity score in the same manner between this shop and this shop, we got 34% similarity.
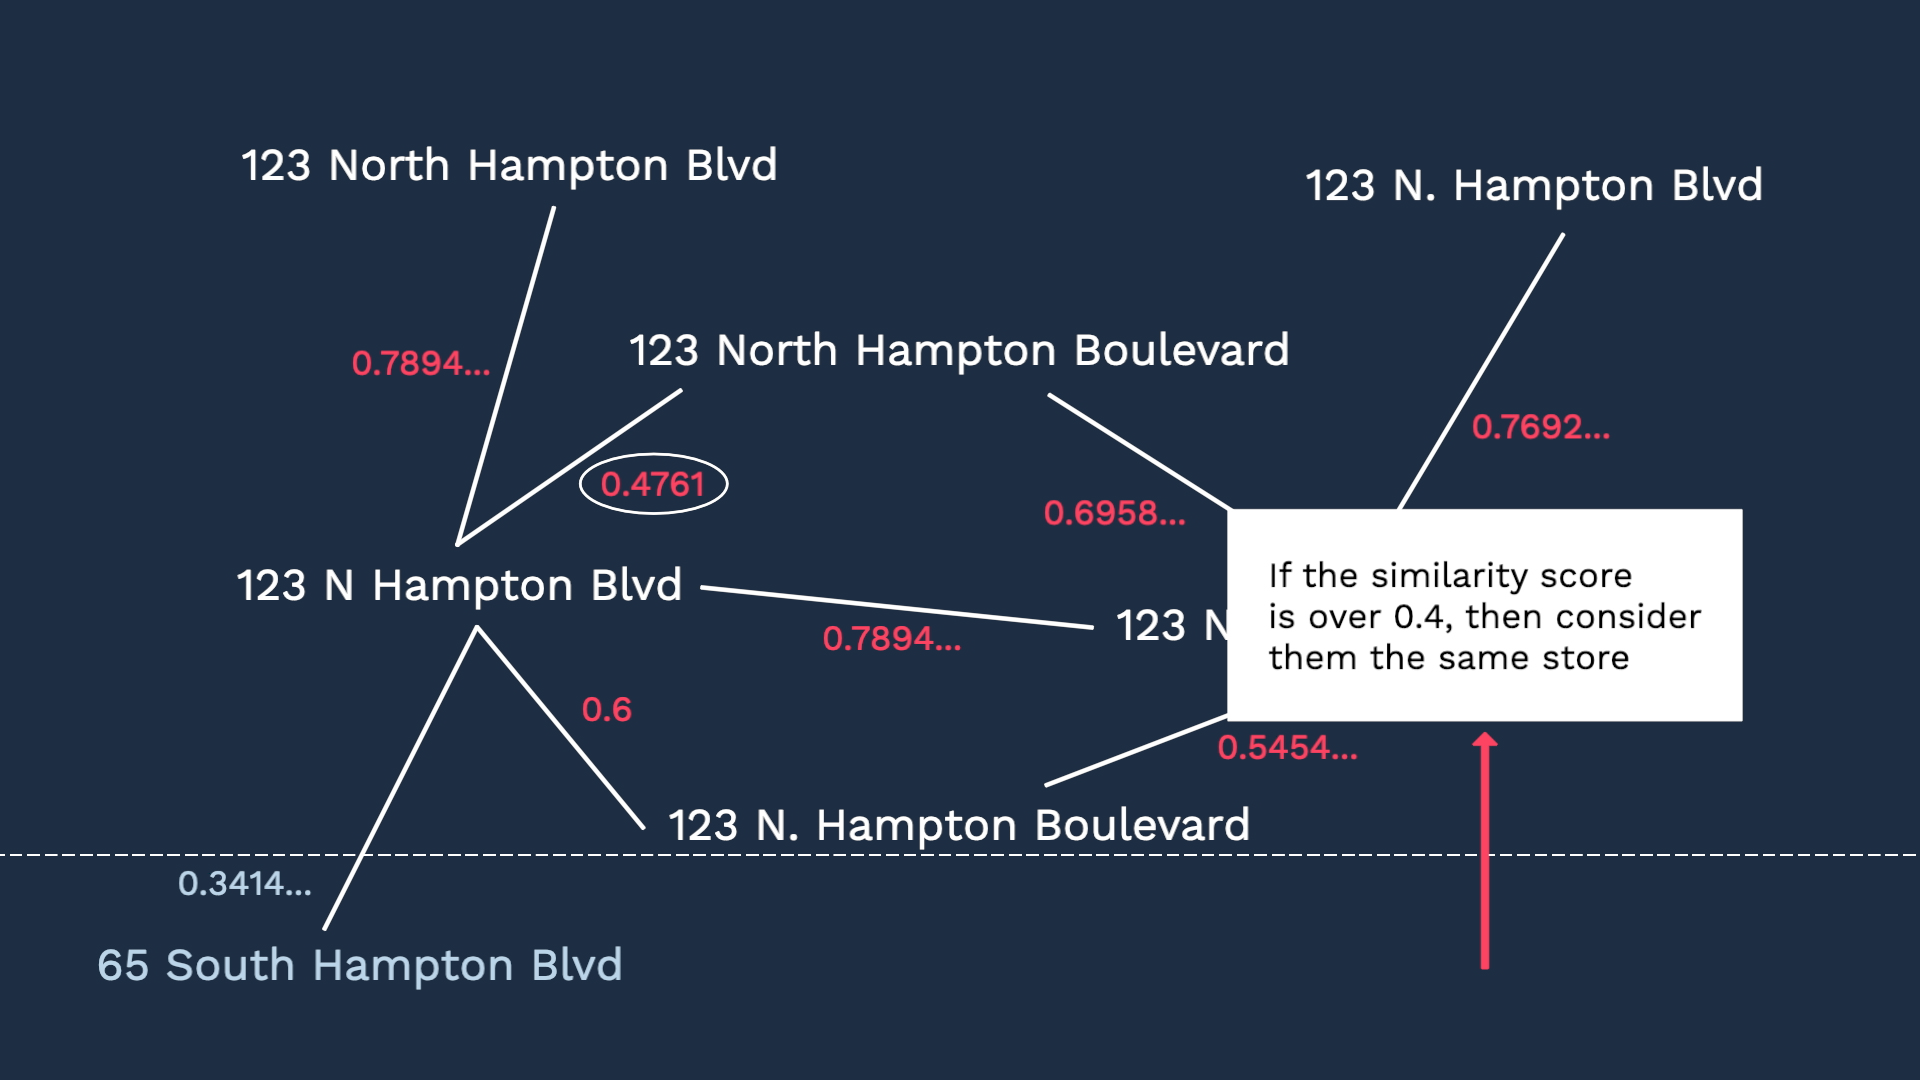
So now, instead of writing so many rules to bundle the alerts, we need to set up one cookbook recipe to achieve the same result.
Moreover, our correlation engine’s high adaptability keeps the maintenance effort low, too. Let’s say we opened up new stores. If we are writing rules, then we need to add another set of rules to make sure the events in these shops are bundled together.
Or some shops may close. Then you have rules that are no longer useful.
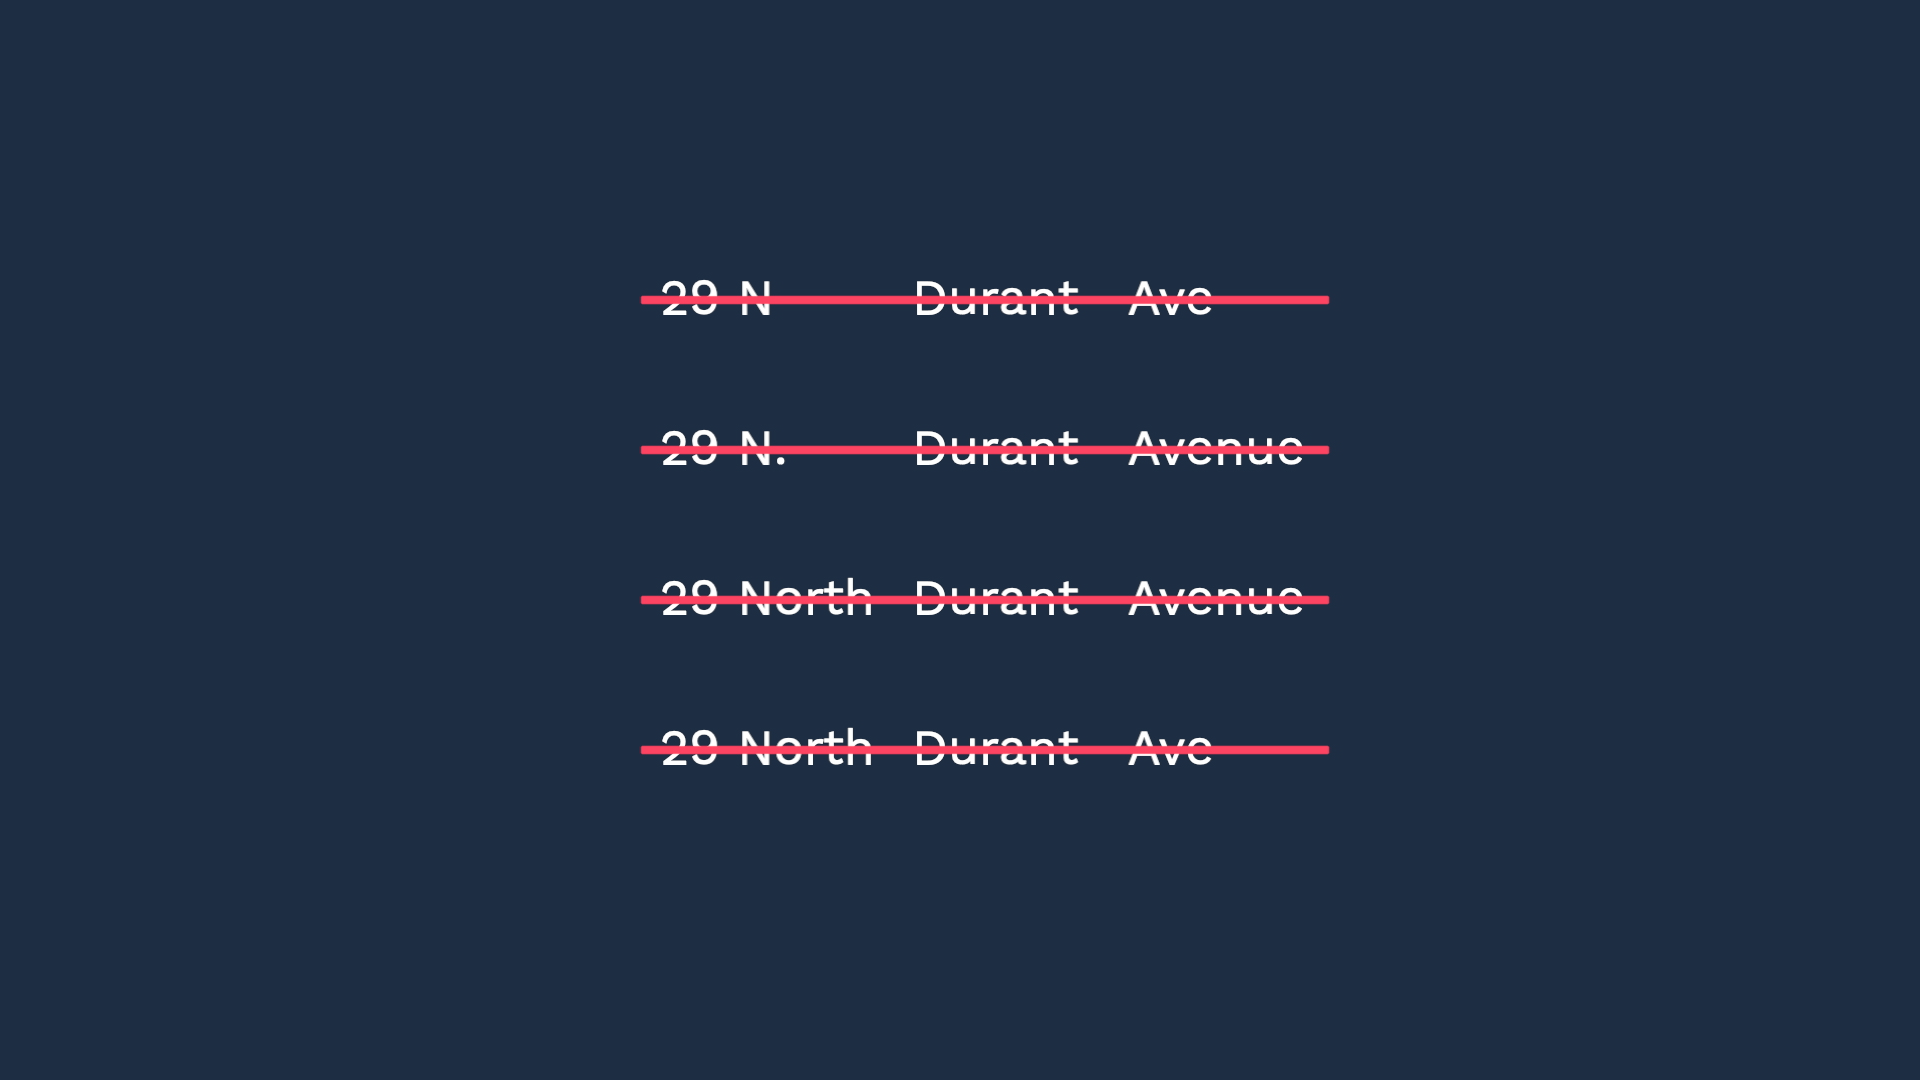
With the correlation engine, the same definition can handle the new cases with no extra work.
So, now you know how Incident Management’s correlation engines are different from the rules. Hope you are excited about not having to maintain thousands of rules.
Thanks for watching!
BASIC | 5 MIN
One of the benefits of implementing APEX AIOps Incident Management is that you can reduce noise and focus on what matters. In this video, we'll take a look at the Incident Management noise reduction mechanism using sample data from the real world.
Use case walkthrough: Deduplicate events to reduce noise ►
A busy service with multiple monitors can generate a flood of metrics, anomalies, and events. One issue might trigger a large number of repeat and duplicate events. APEX AIOps Incident Management analyzes every new piece of data — What is this? When did it happen? What is its severity? How often has it happened before? — and aggregates events for the same issue into alerts. Whenever it adds a new event, Incident Management updates the alert fields — event count, last event time, severity — so the alert always contains the latest information about the underlying issue. This process removes the duplicate, repeat, and obsolete noise from the data stream.
*Please note Moogsoft is now part of Dell's IT Operations solution called APEX AIOps, and changed its name to APEX AIOps Incident Management. The UI in this video may differ slightly but the content covered is still relevant.
One of the benefits of implementing Incident Management is that you can reduce noise, and focus on what matters. In this video, we’ll take a look at the noise reduction mechanism, using sample data from the real world.
We’ve extracted this sample data from an actual monitoring environment. The data is anonymized, but the events are real.
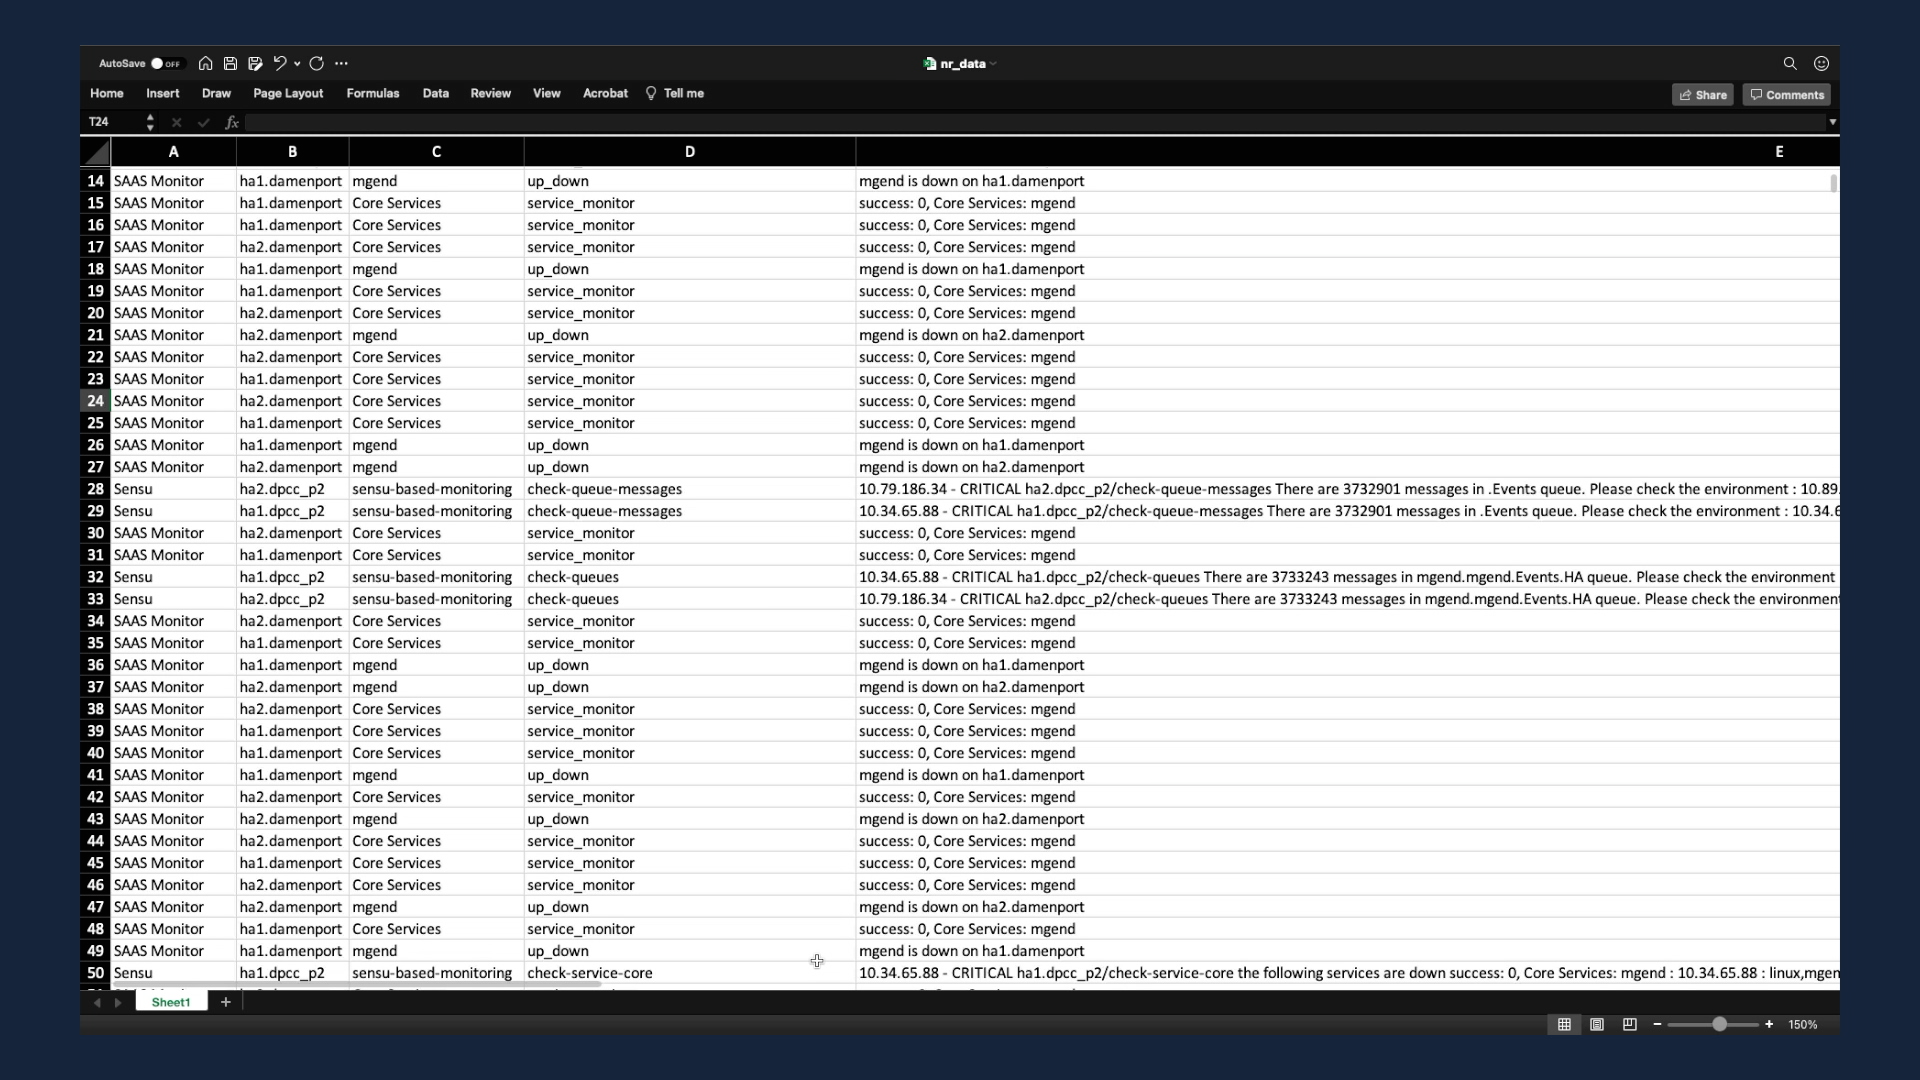
The event data is coming from three different sources: Cloudwatch, a home grown monitoring tool, and Sensu. These three tools have been monitoring a SaaS applications environment.
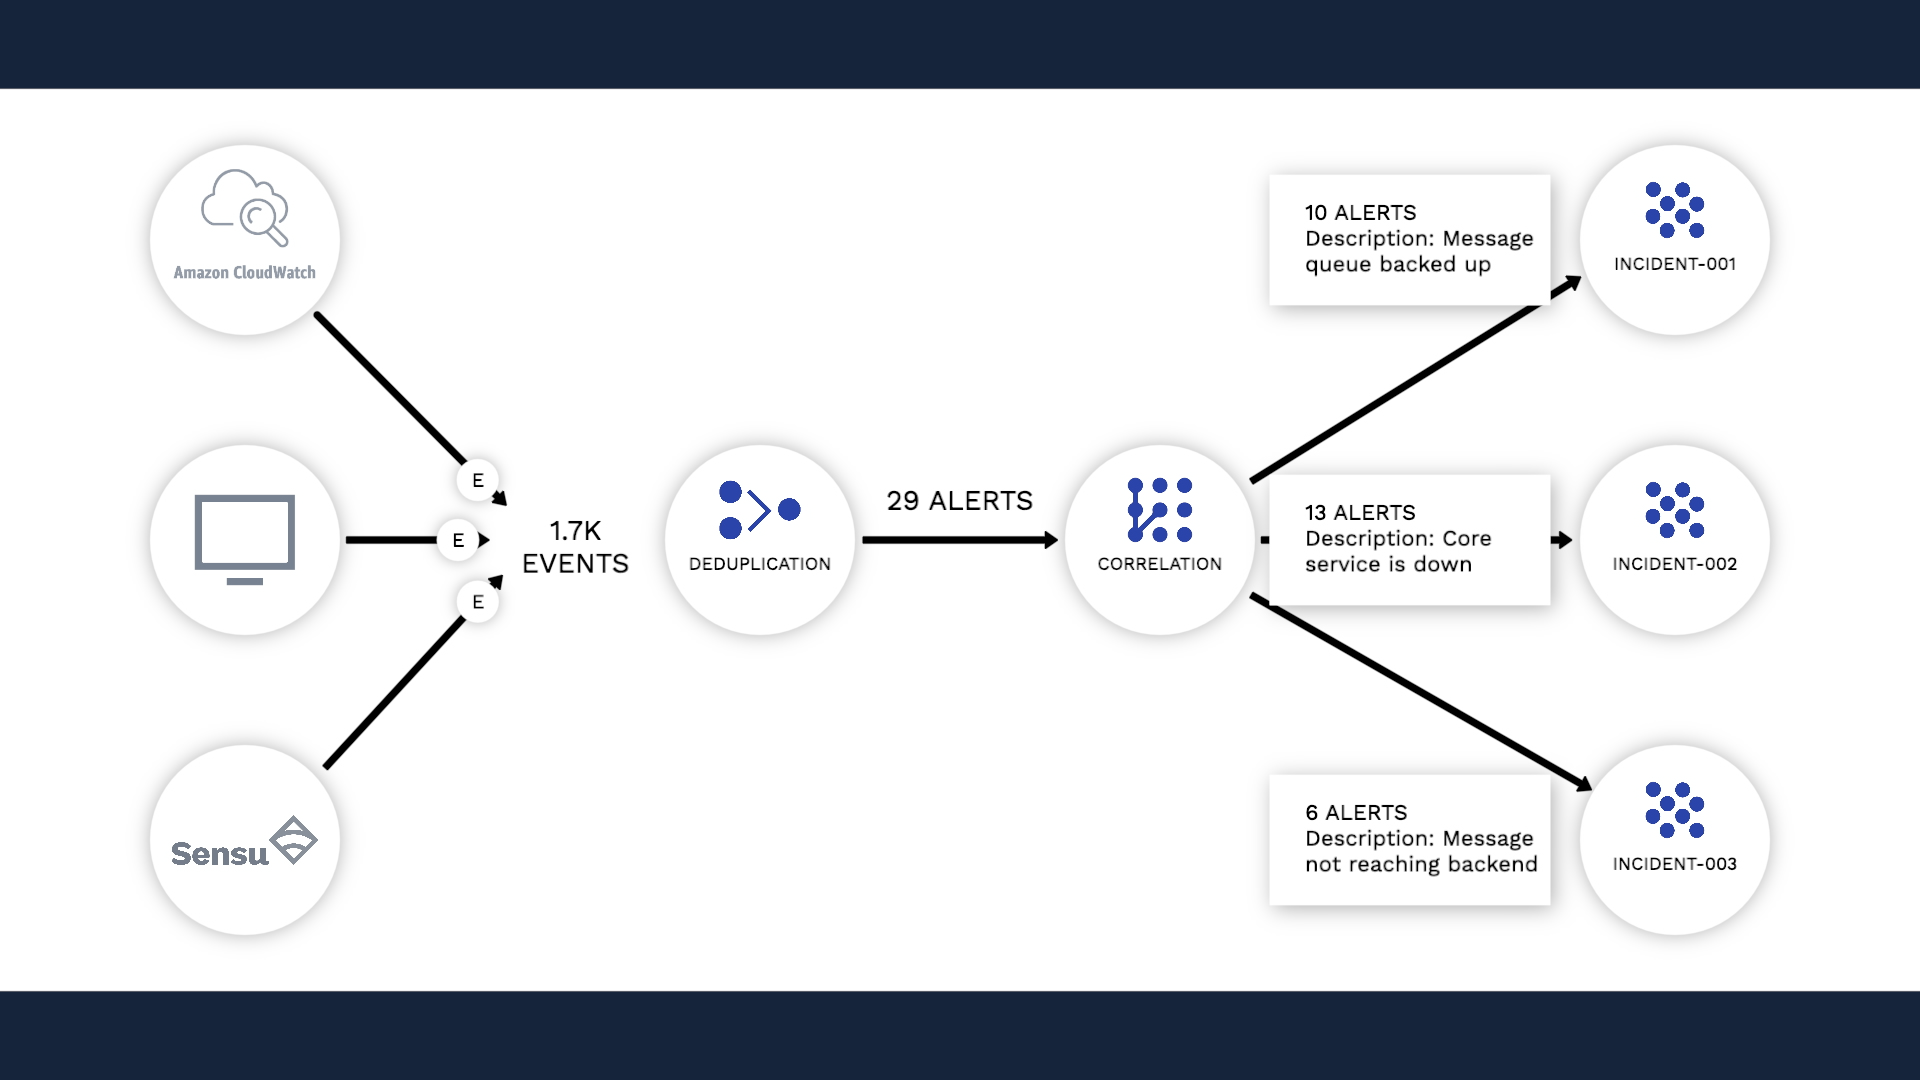
Here we’ve got about 1700 events. Let’s feed this to Incident Management and see what happens.
Incident Management deduplicates events and forms alerts. For example, this event indicates disk i/o is very high for this.dpcc_p2 server. Then, here comes another event to tell you the condition has worsened.
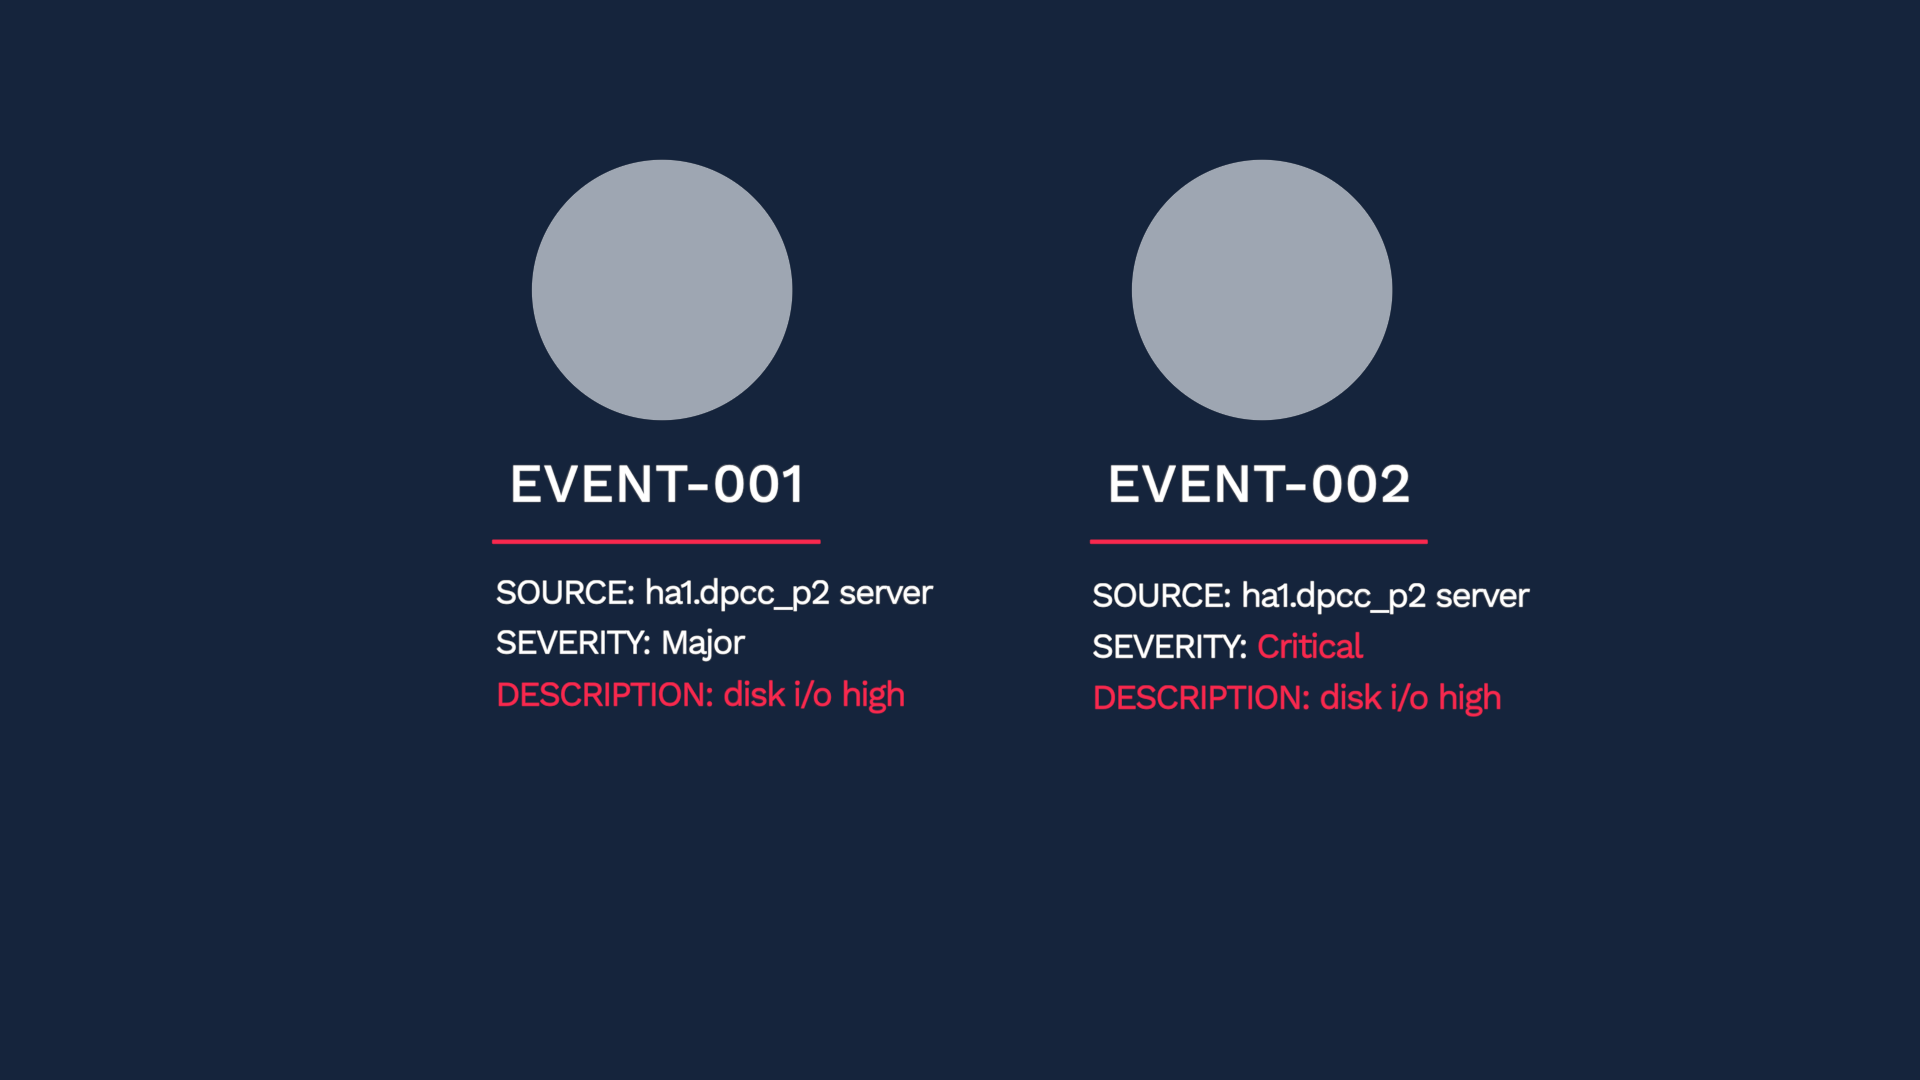
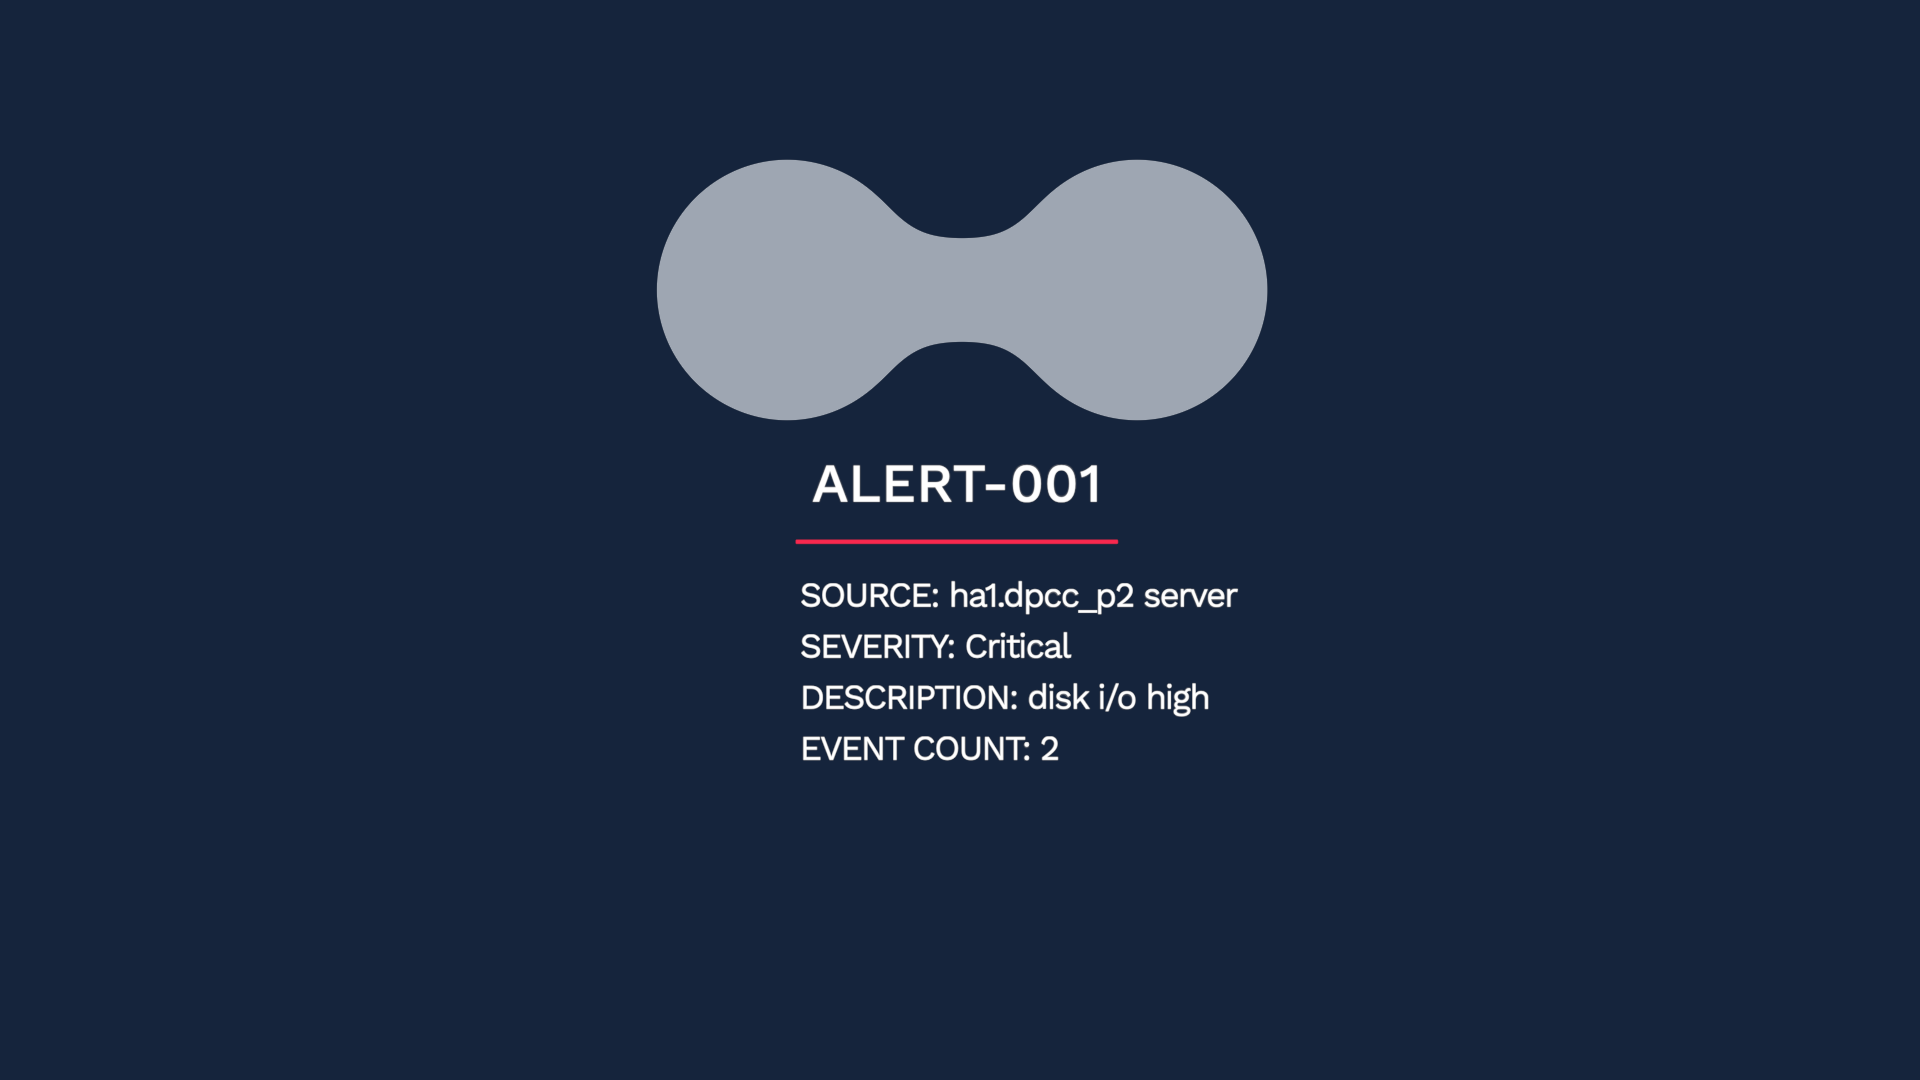
These should not be considered separate problems, so Incident Management de-duplicates them into one alert.
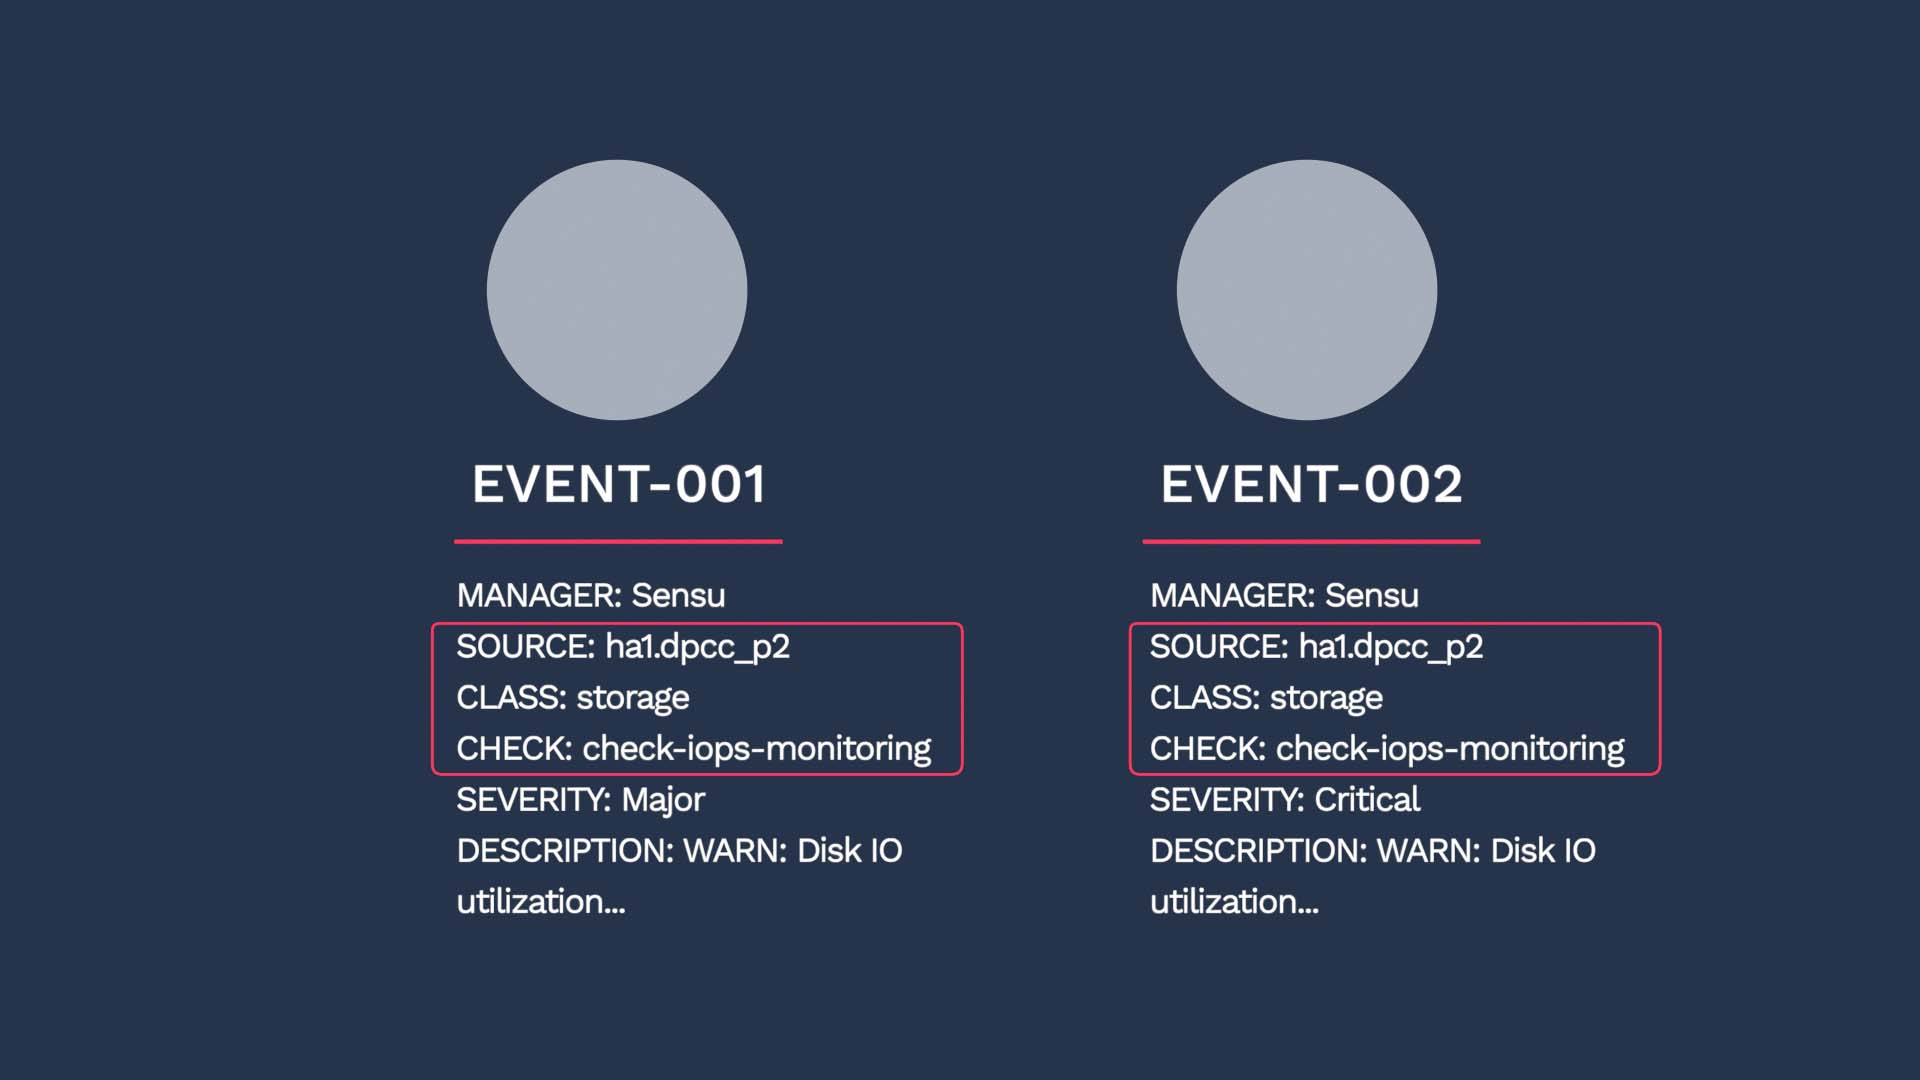
Let’s take a closer look. How exactly do we determine an event to be a duplicate?
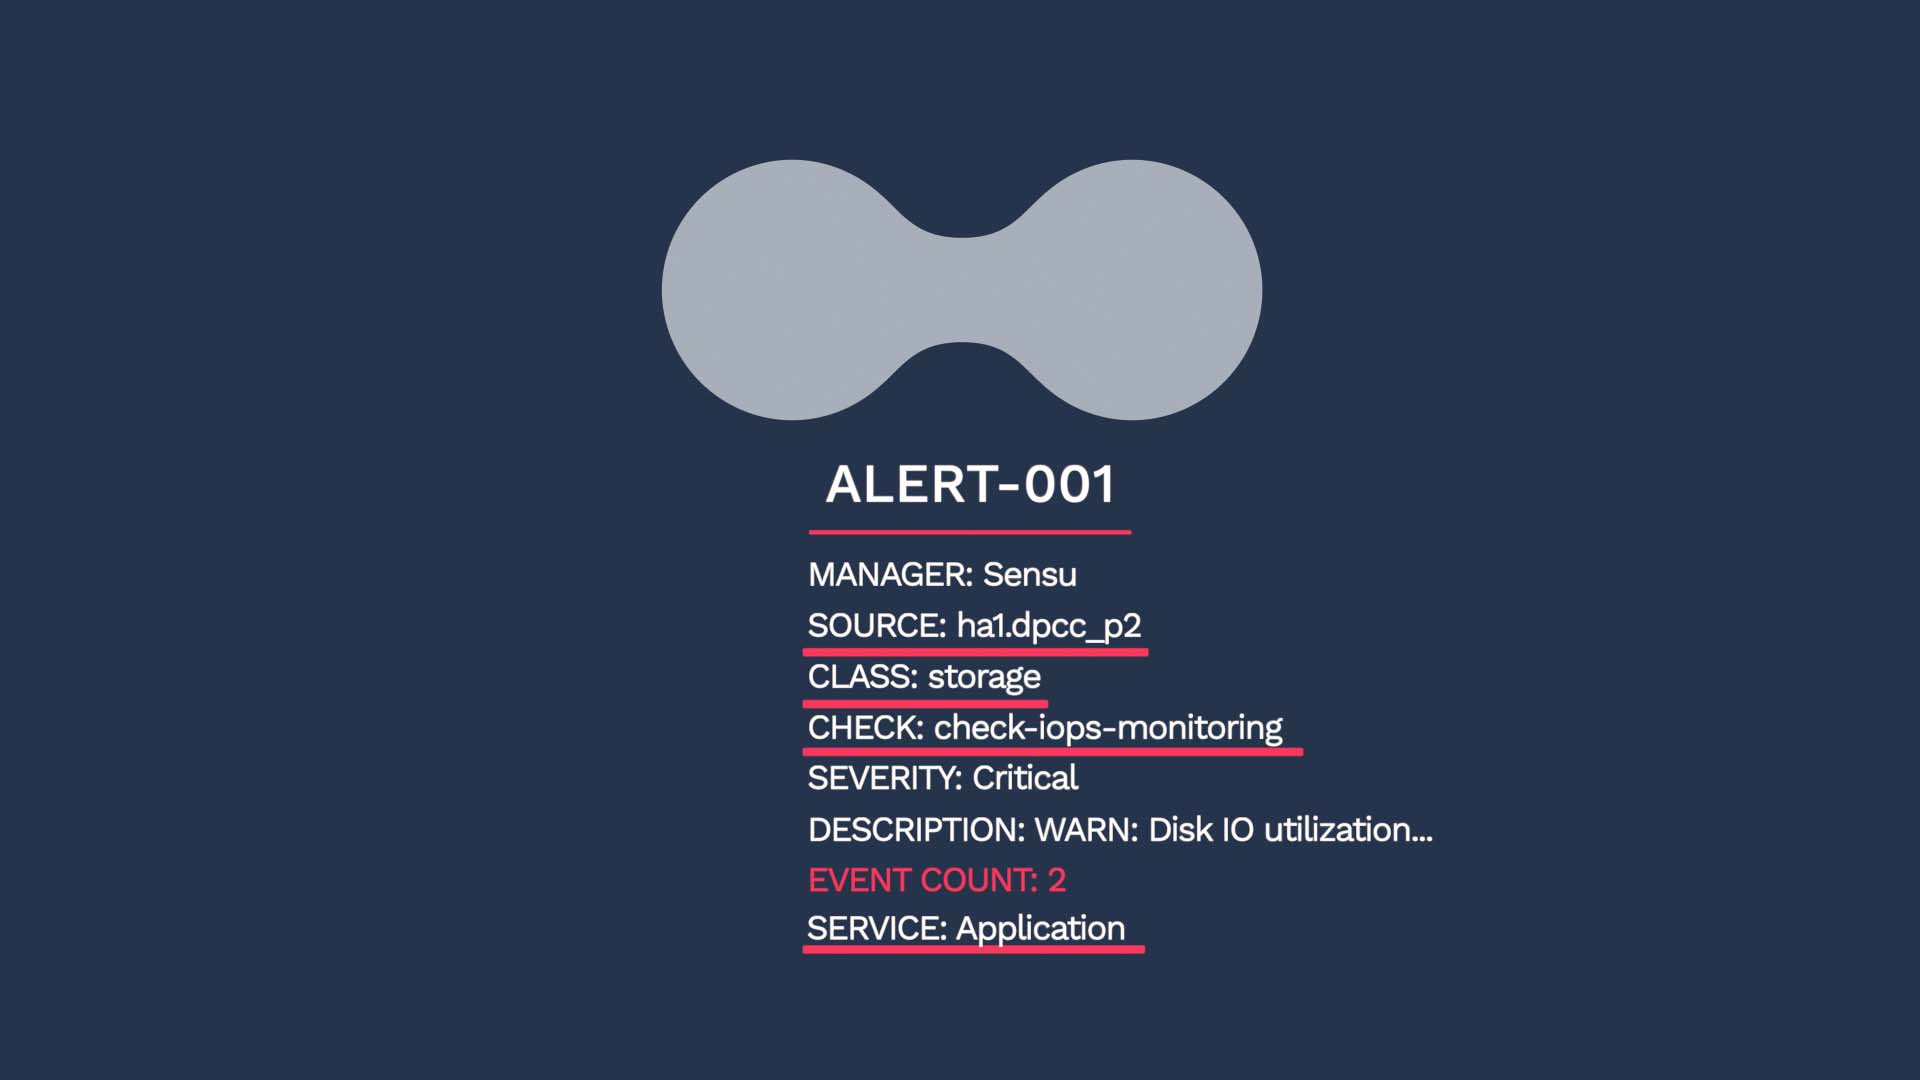
In short, Incident Management compares the dedupe_key values of the two events, and if they are a 100% match, the two events are deduplicated into one alert. The dedupe_key value is a combination of the Source, Class, and Check fields in an event. If the incoming event is using the service field, that value is used also.
In this example, instead of two events, you now have one alert in the critical state. Because of the deduplication, you will not be allocating separate resources to each event, and you will have more context for troubleshooting.
Now consider this case: After the critical event, another event arrives with the same dedupe key value. But this time, the severity value of the event is Clear. Maybe an automated runbook kicked in and addressed the issue.
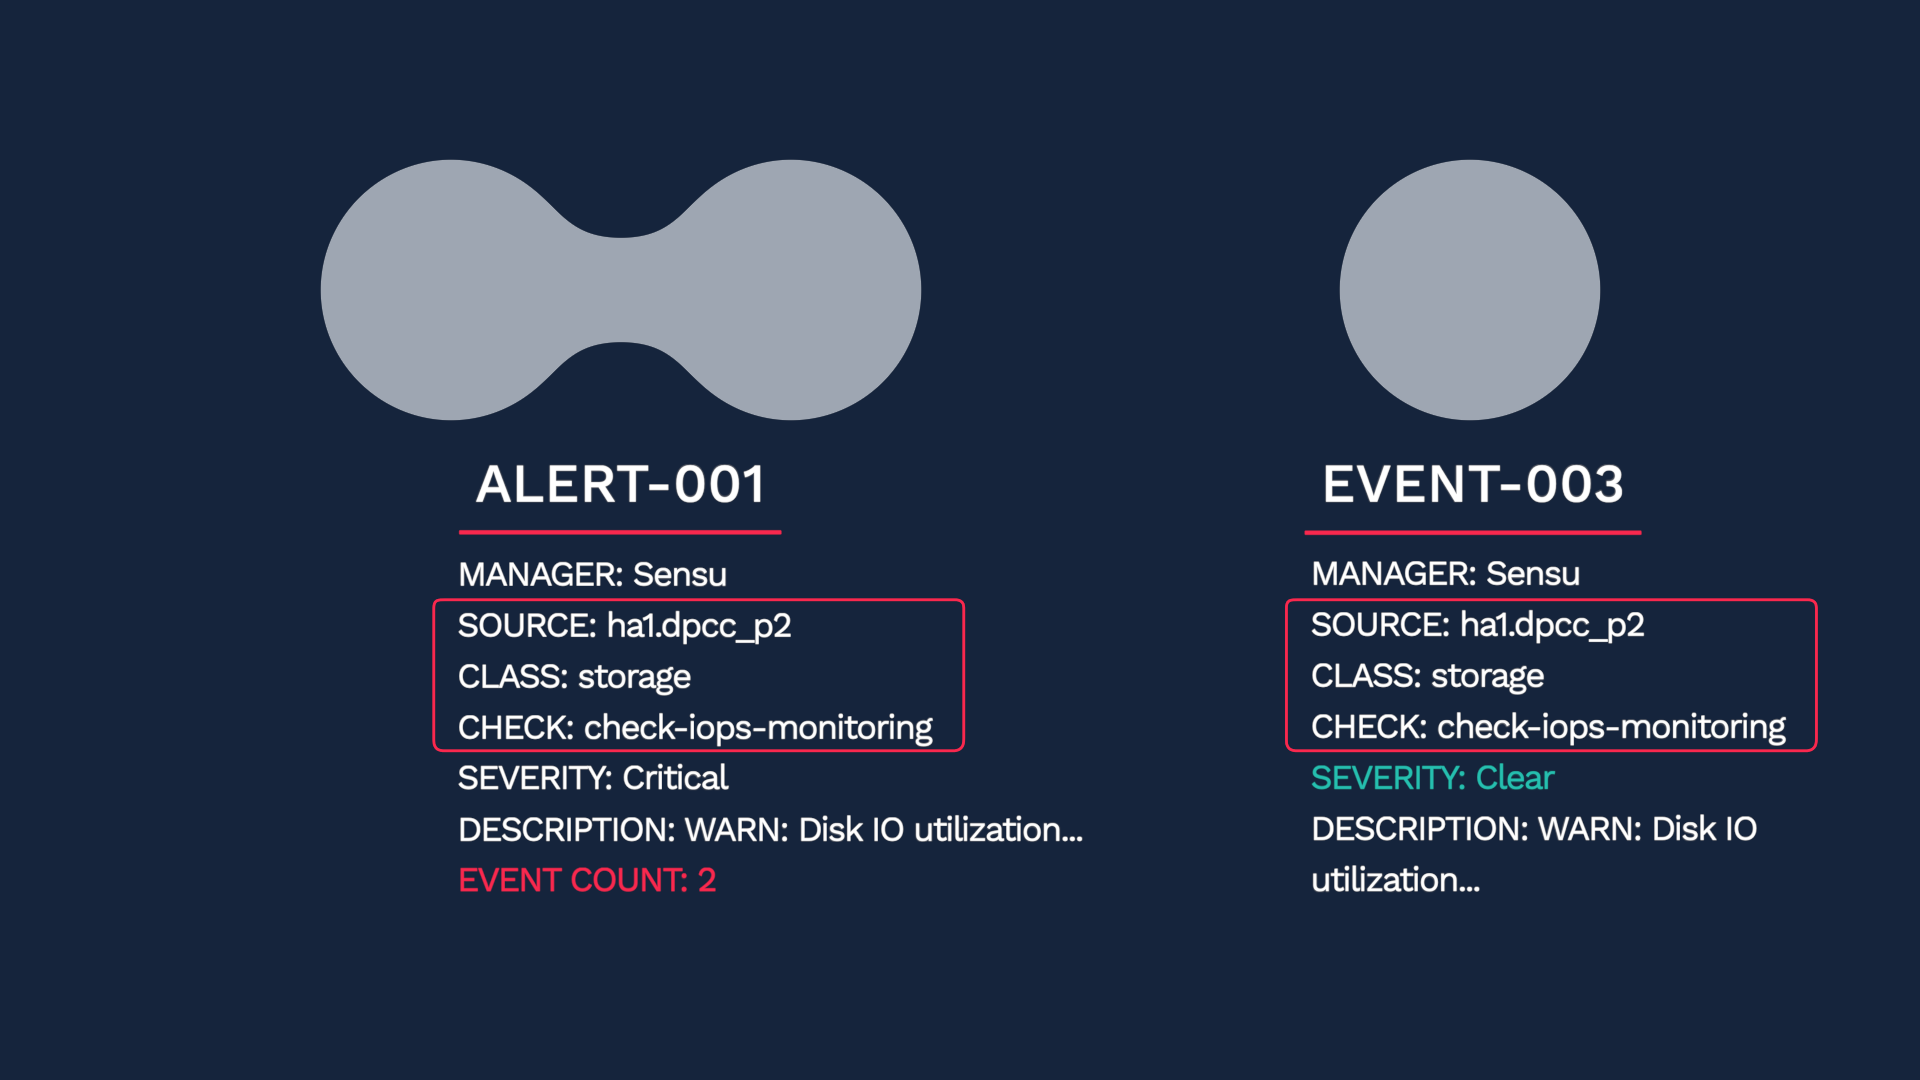
Incident Management dedupes this event into an existing alert. The status of the alert updates to Clear.
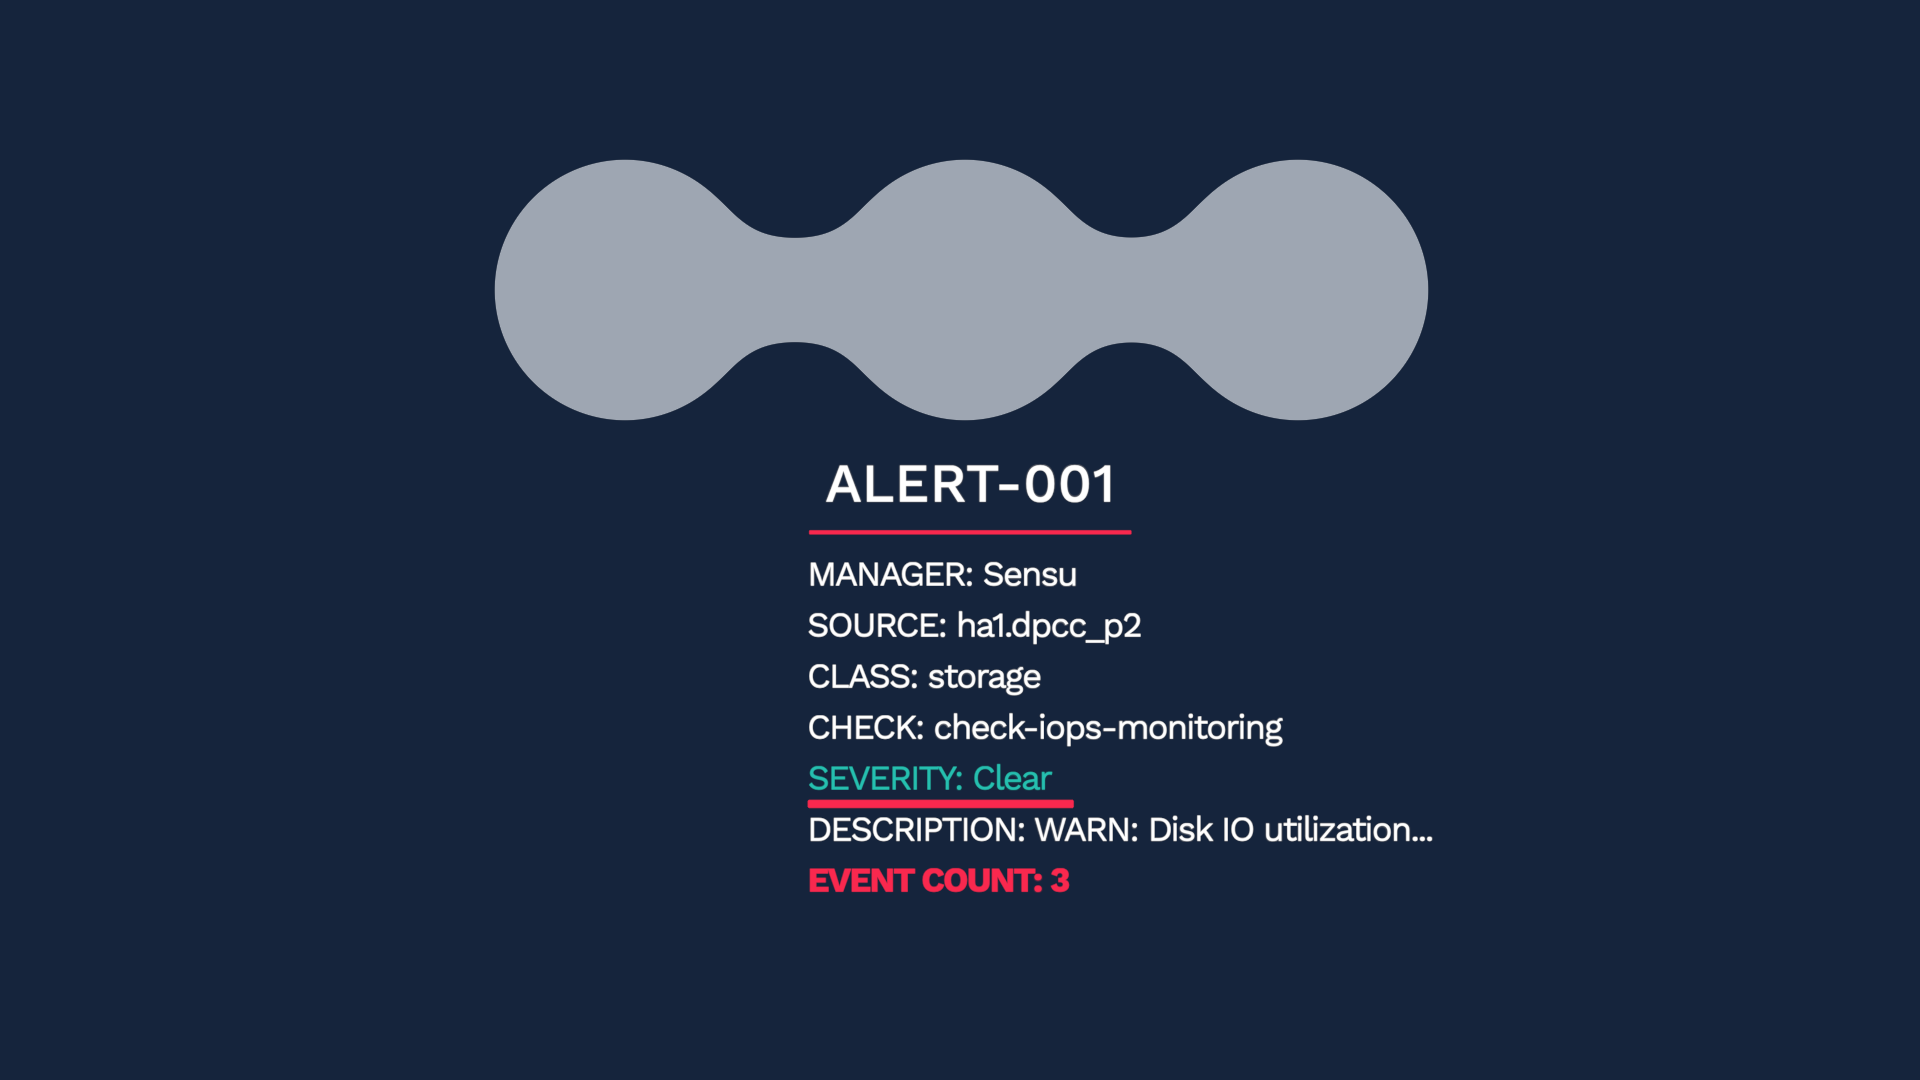
Without deduplication, it would take a manual correlation to figure out the issue has resolved itself. Have you had a series of link flapping events? All those up and down events would be consolidated into one alert with Incident Management.
So, after the 1700 events have been processed, here’s what we got. They are deduplicated into 29 alerts.
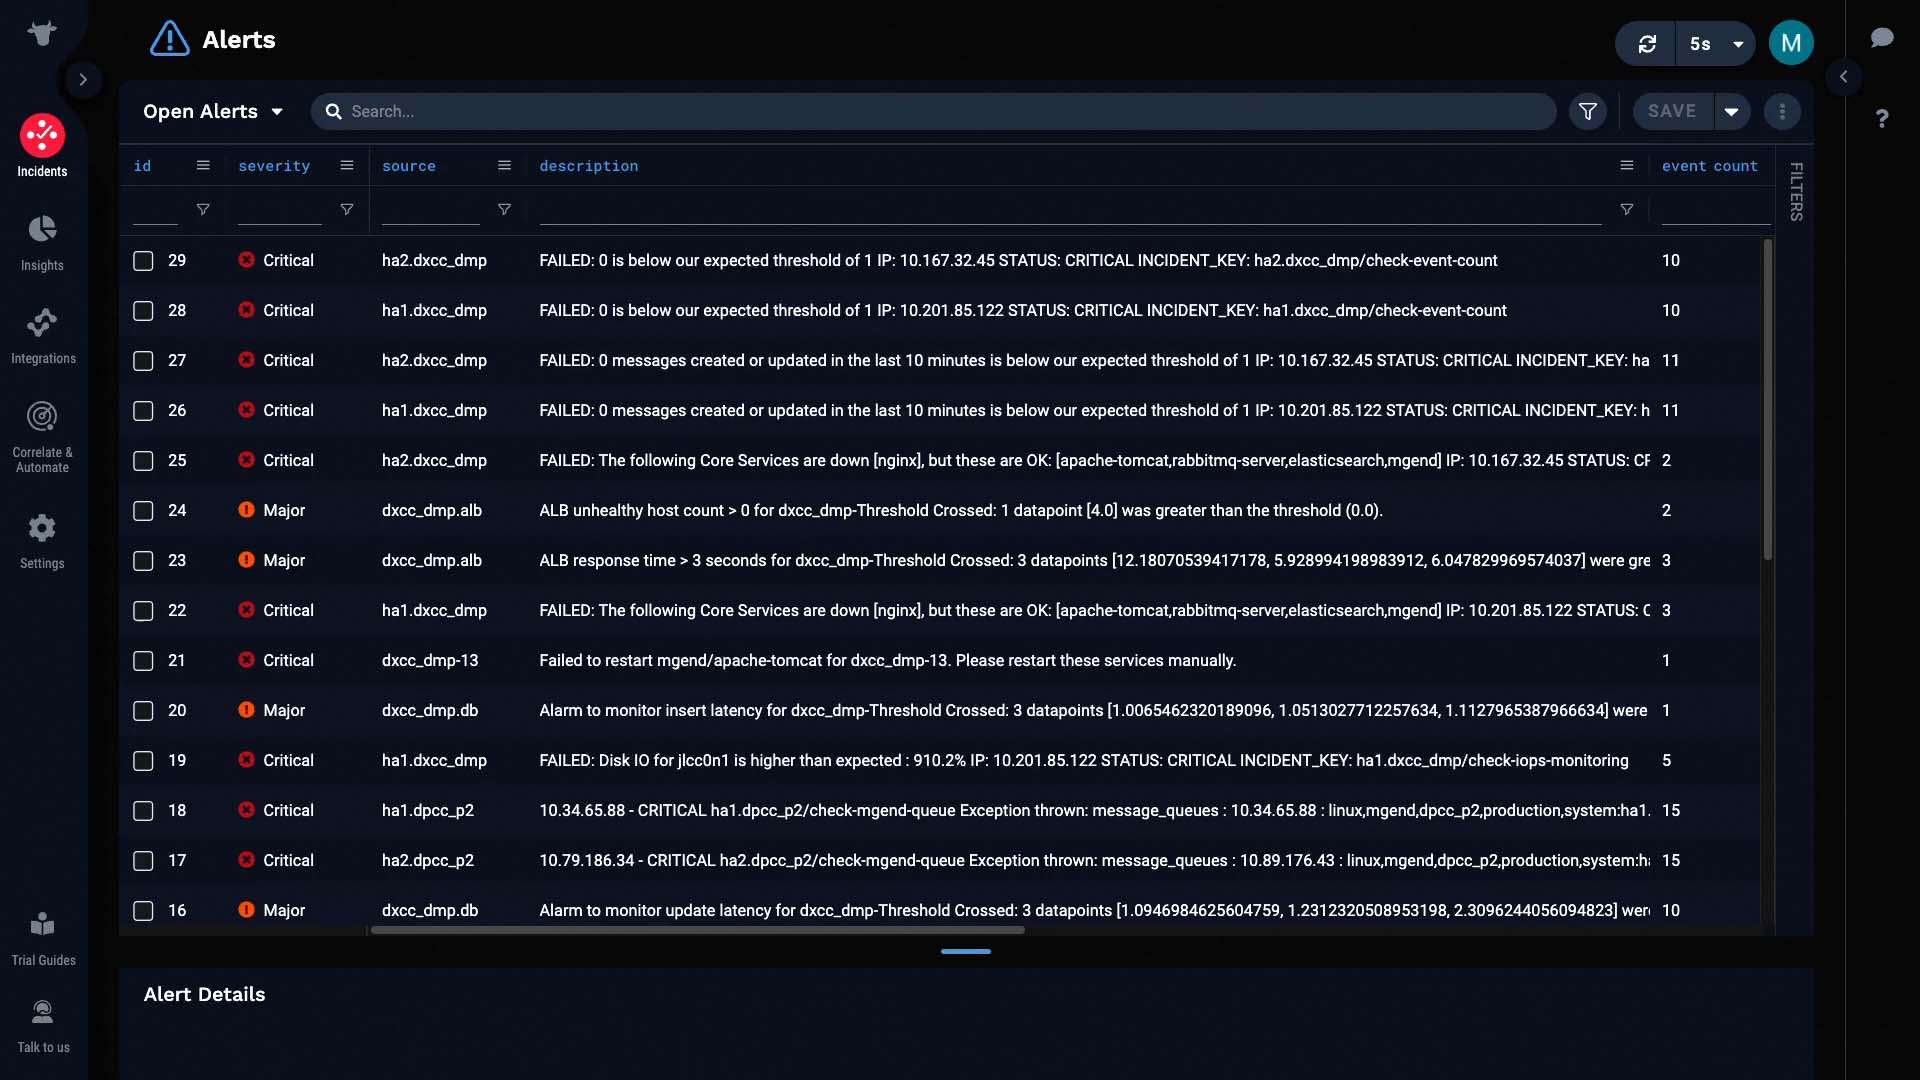
This is the power of noise reduction. It helps you direct your focus on what actually matters.
But we don’t stop here. These 29 alerts are processed further before you come in. They are now correlated based on their relatedness.
Here, the 29 alerts are now clustered into 3 incidents.
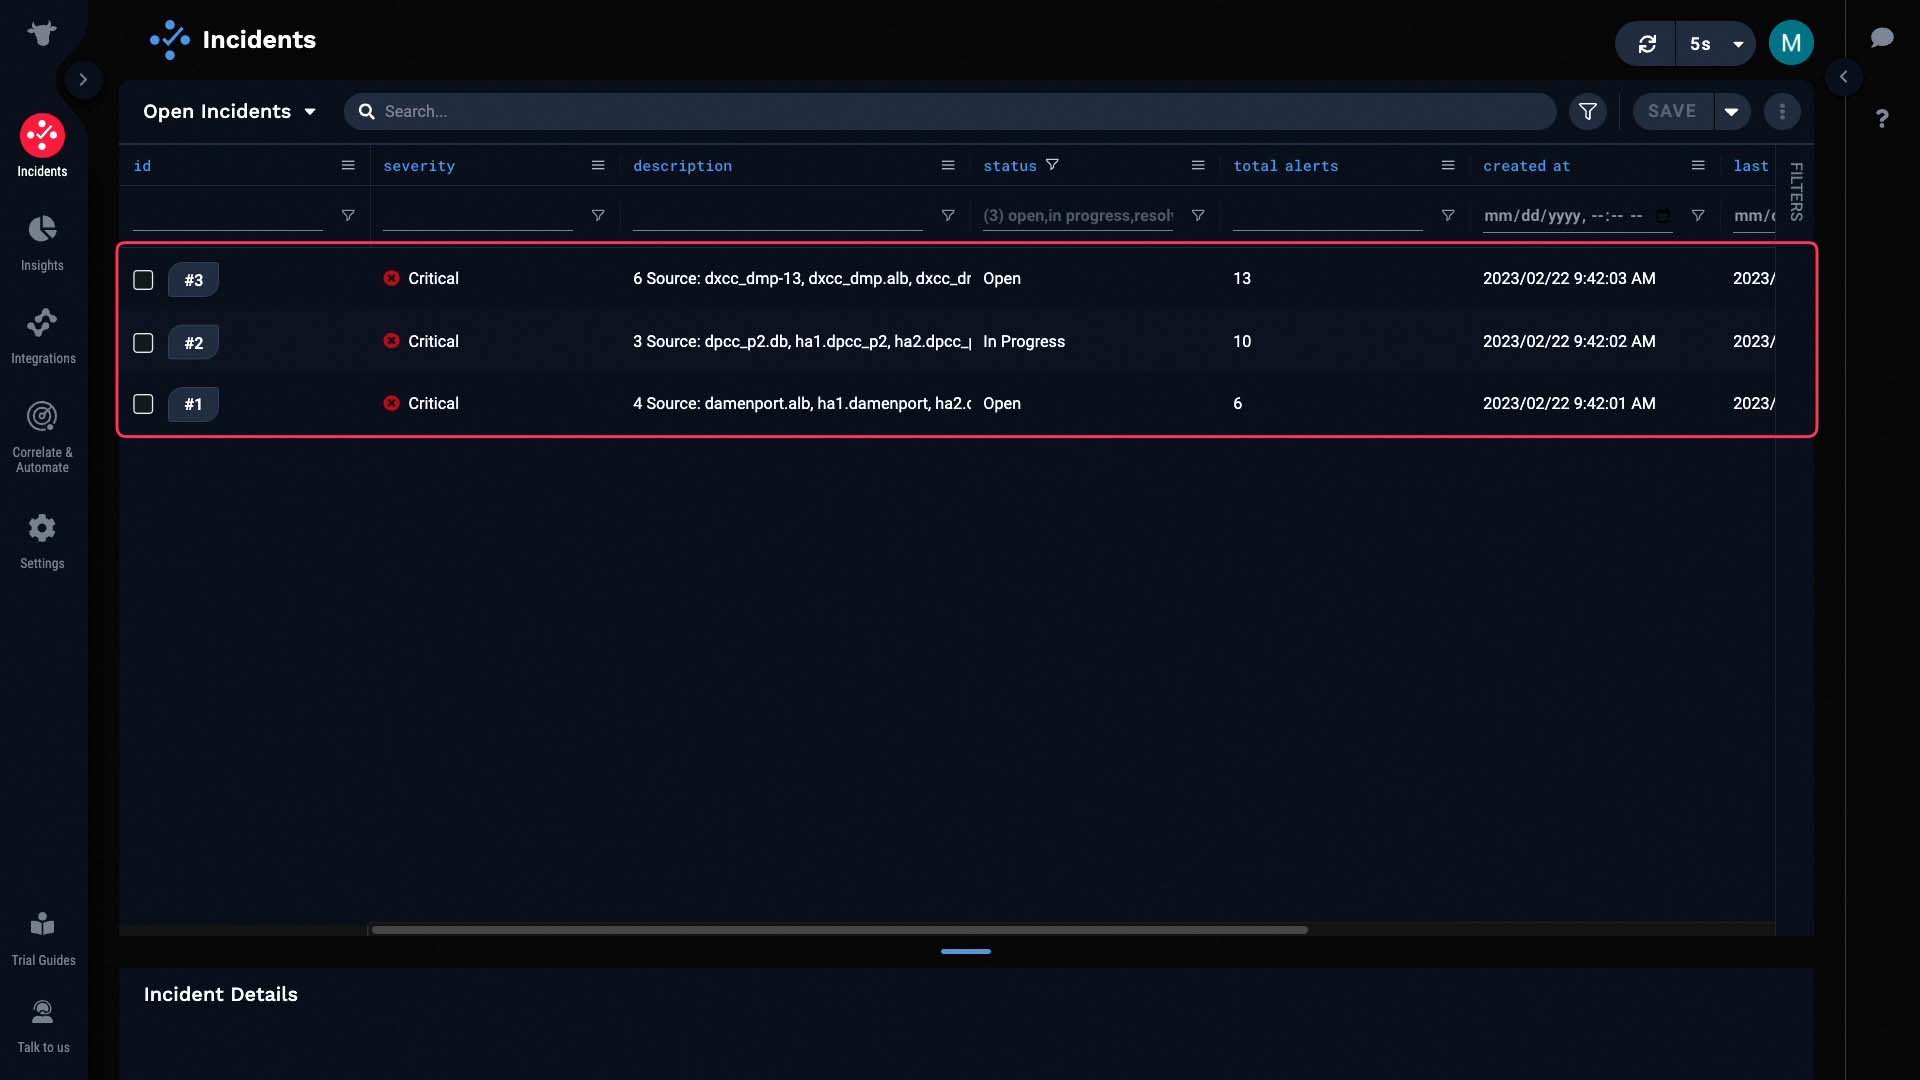
Incident Management evaluates alerts for their relatedness, and clusters the related alerts into one incident.To learn more about the correlation mechanism, watch the “Correlation Engine in APEX AIOps Incident Management” video.
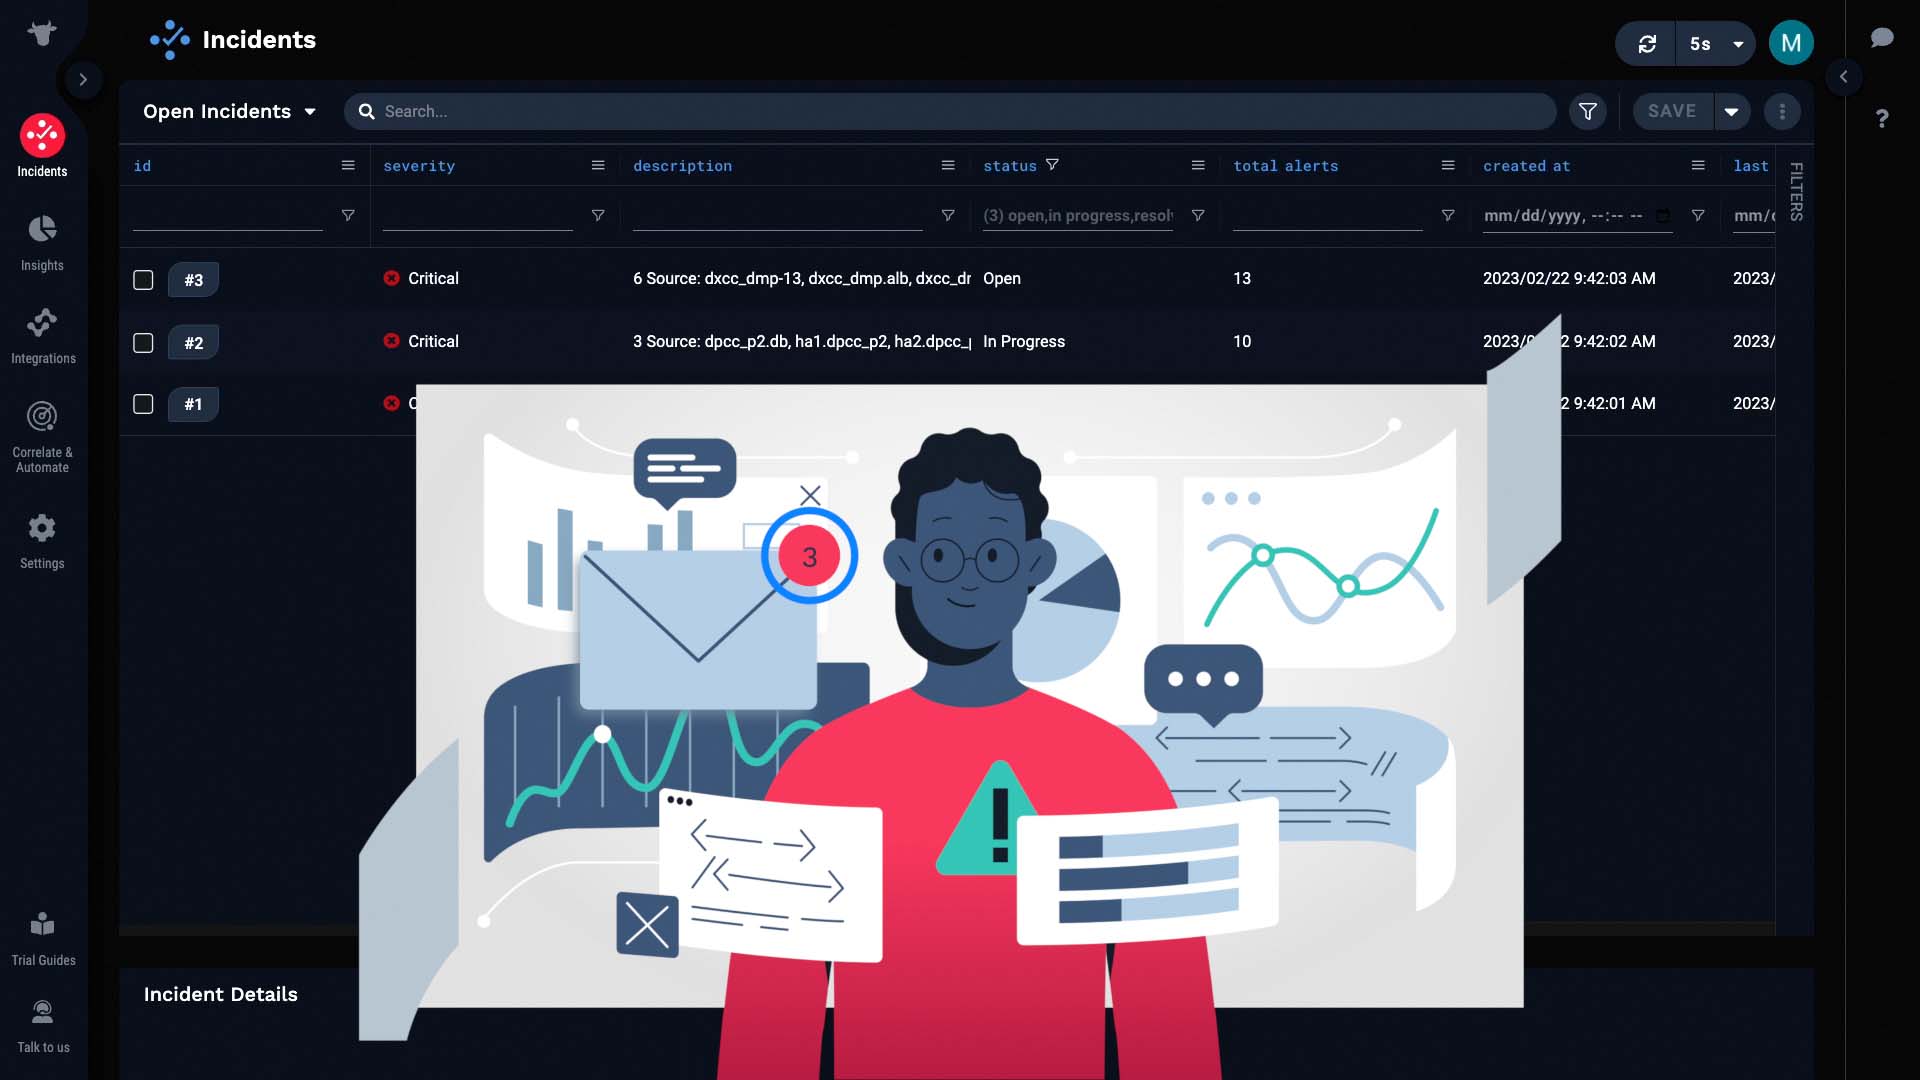
Imagine instead of getting paged 29 times for each of the alerts, now you get 3. No more pager fatigue for your team!
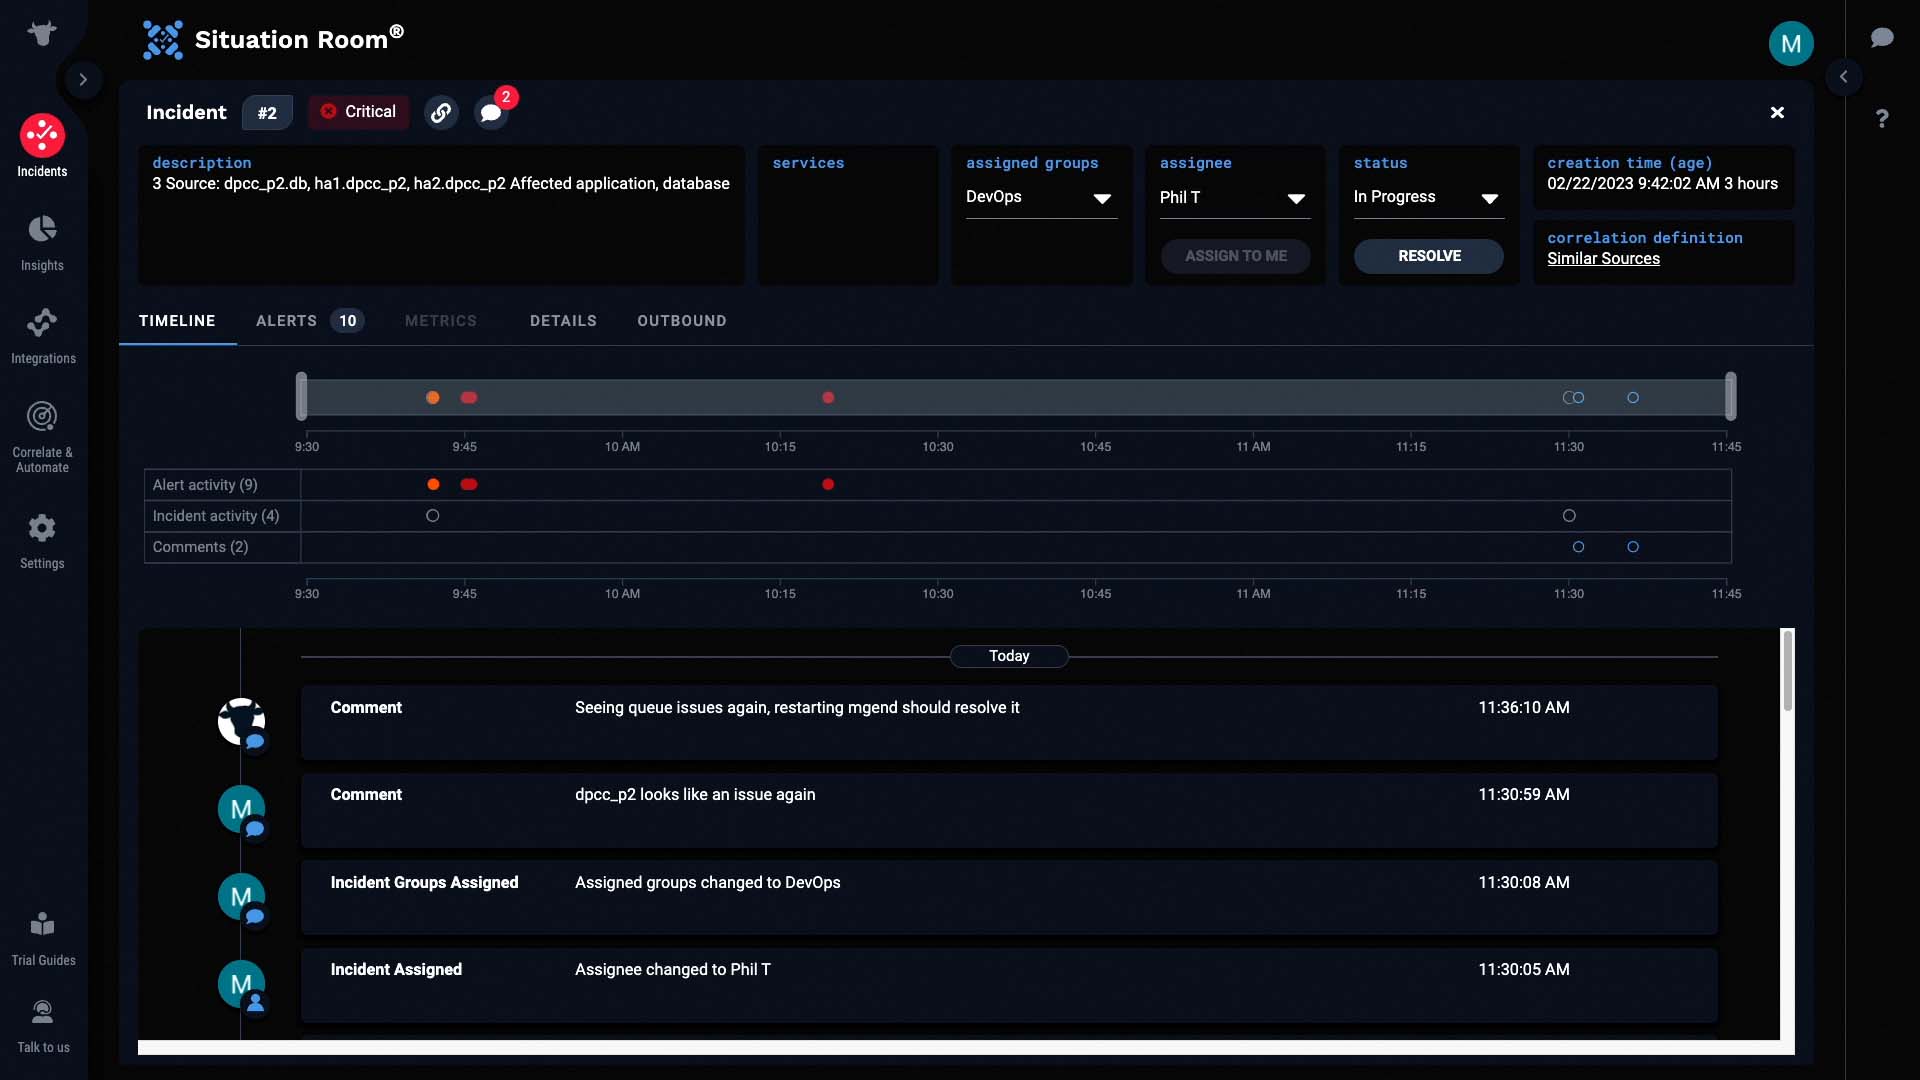
Let’s examine one of the incidents and verify Incident Management has made a meaningful correlation. Let’s see if we can figure out what’s going on with this incident. Let’s go into the Situation Room. The Situation Room is where you can collaborate with your team on an incident.
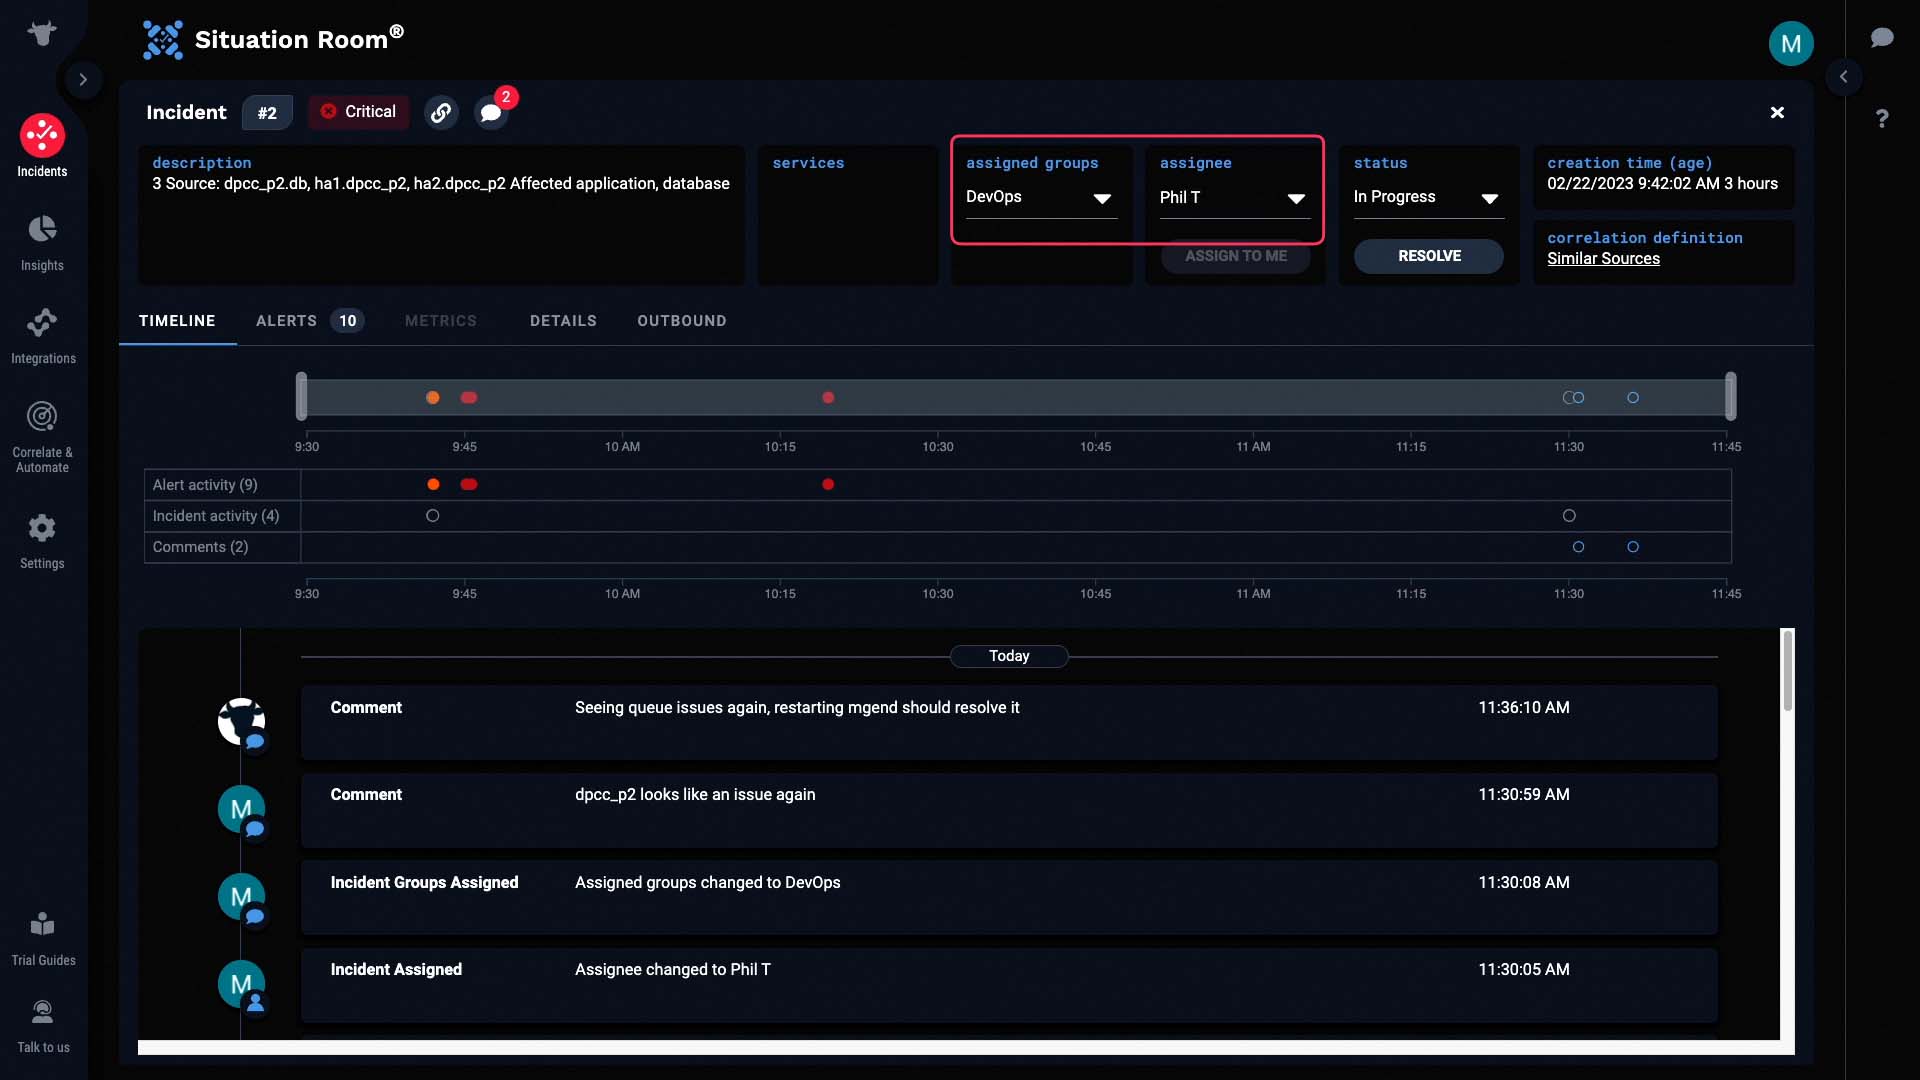
Looks like a team is already assigned to this one.
Here, we can see the timeline of activities pertaining to this incident.
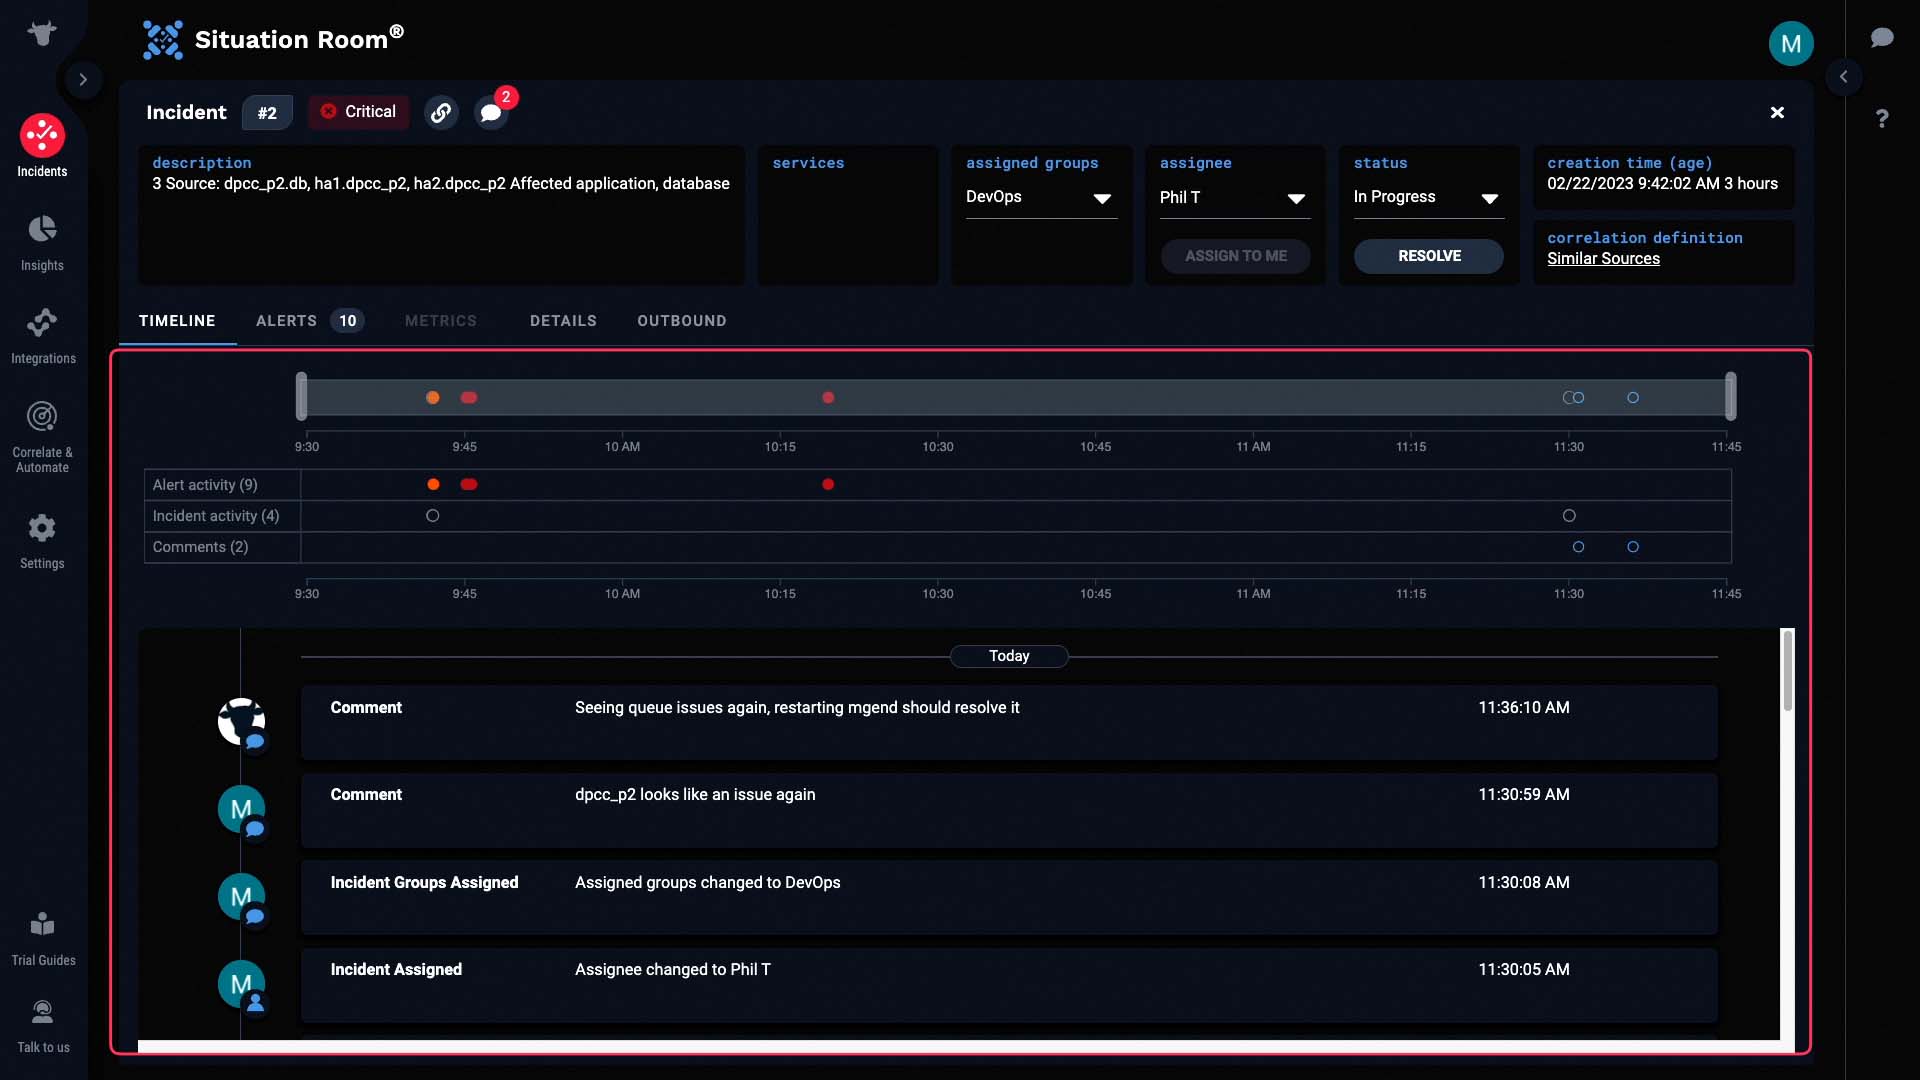
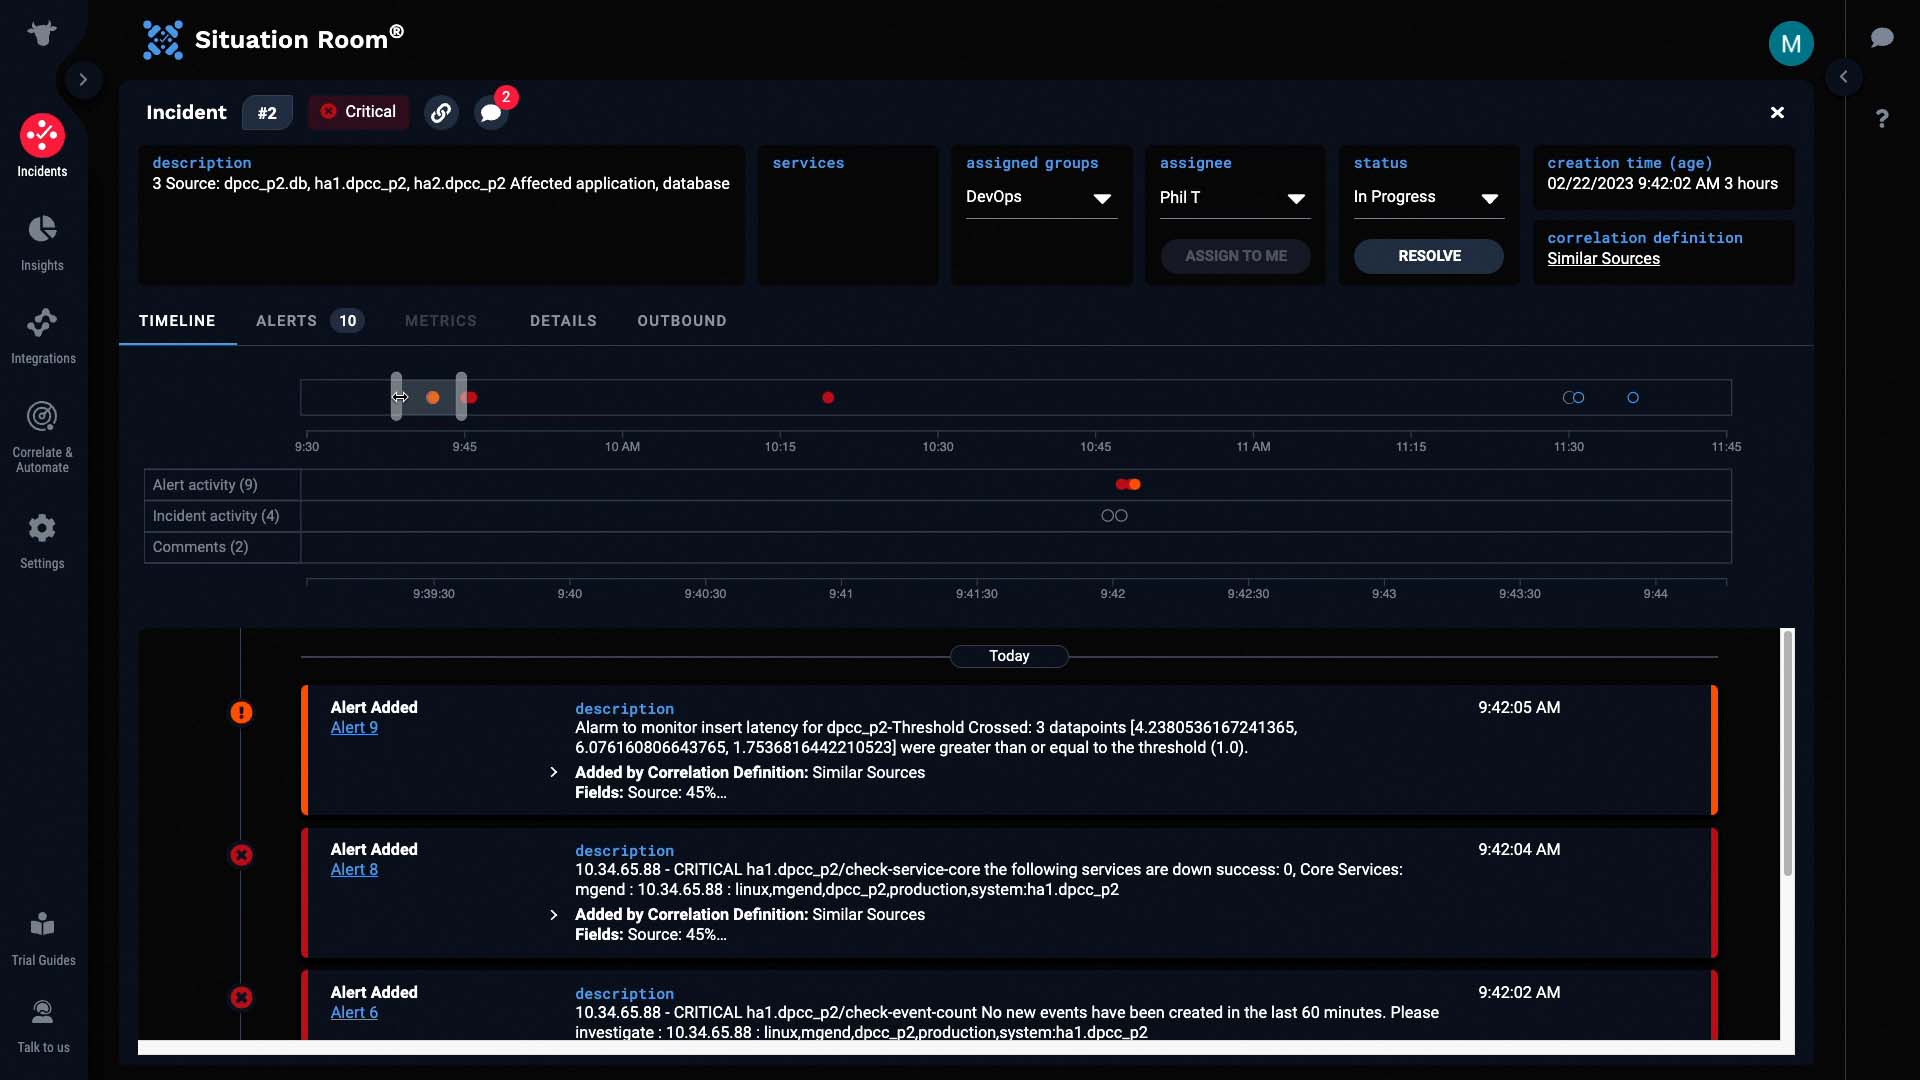
We can zoom in to any particular area of interest to filter the activities.
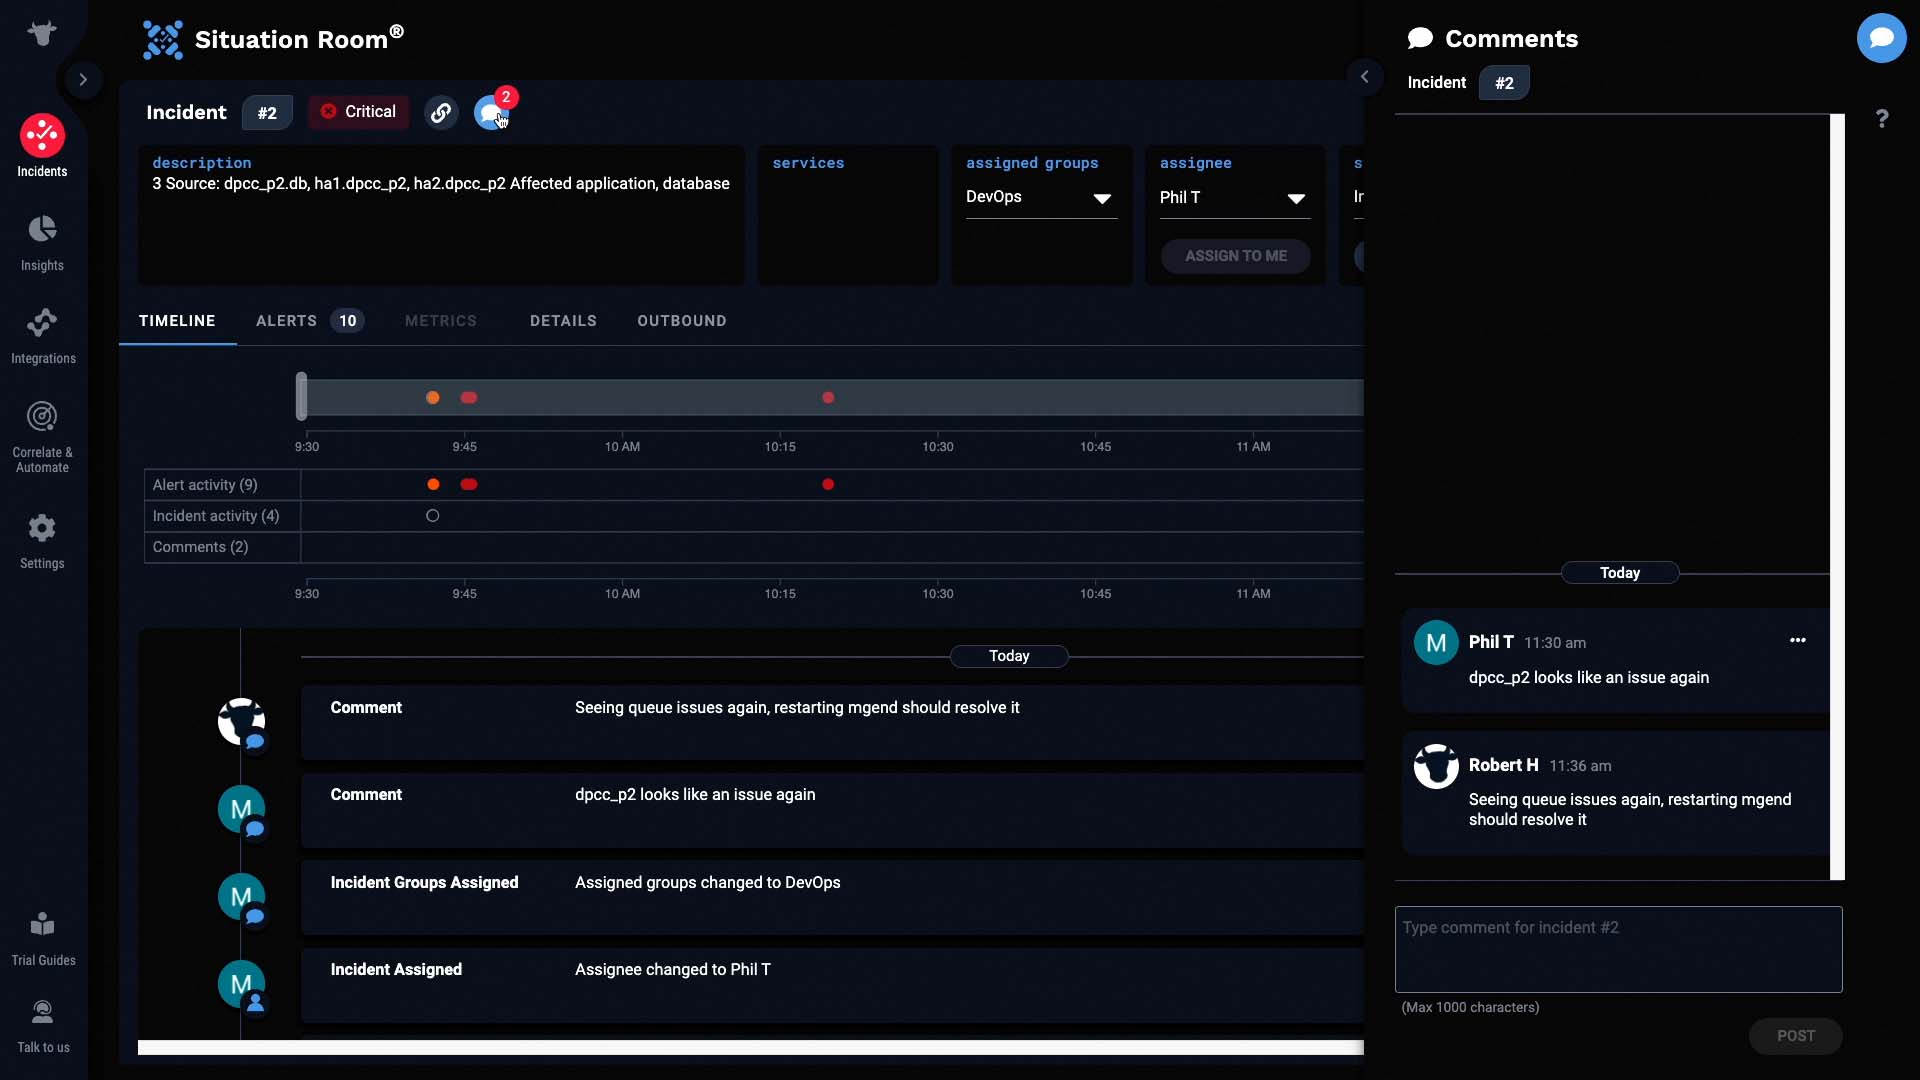
Looks like the group assigned is already reviewing this incident. Let’s do the same!
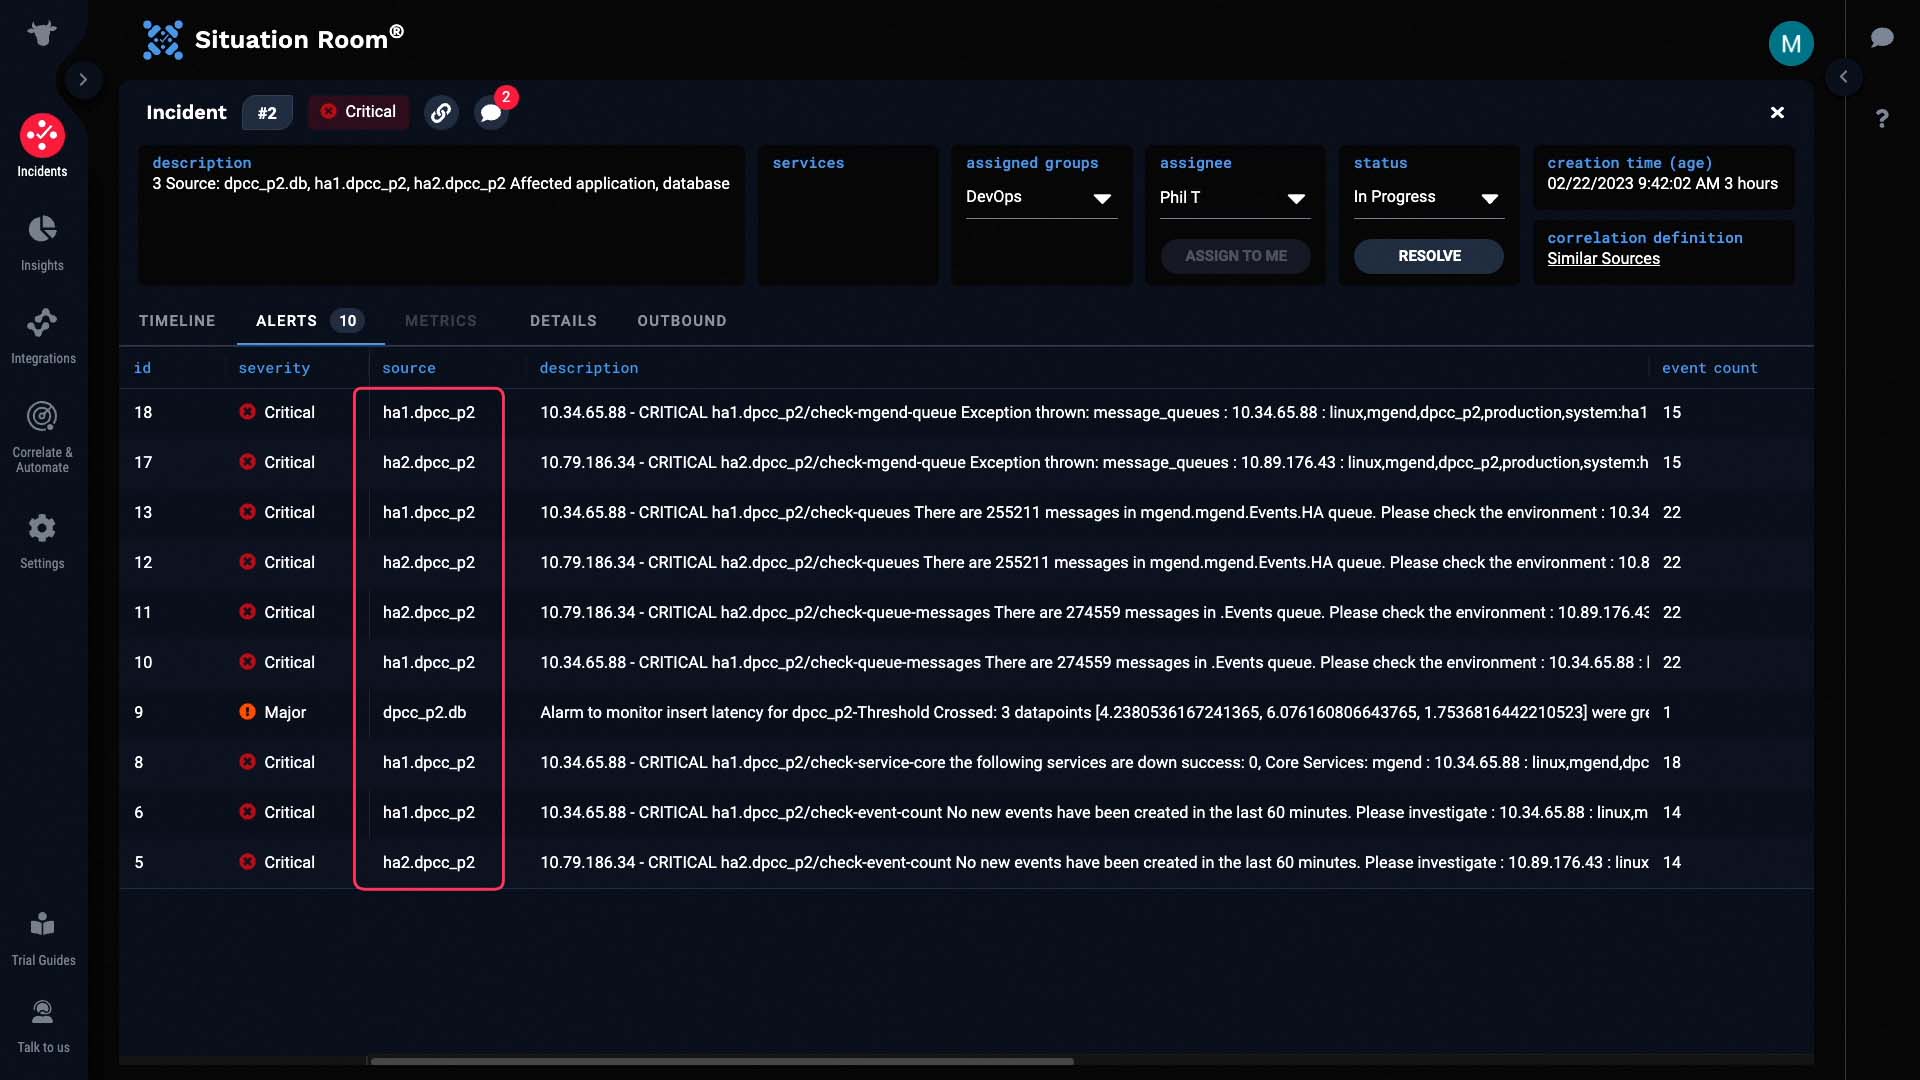
We’ll look at the alerts in the incident. The incident has 10 alerts, which consist of 169 events.
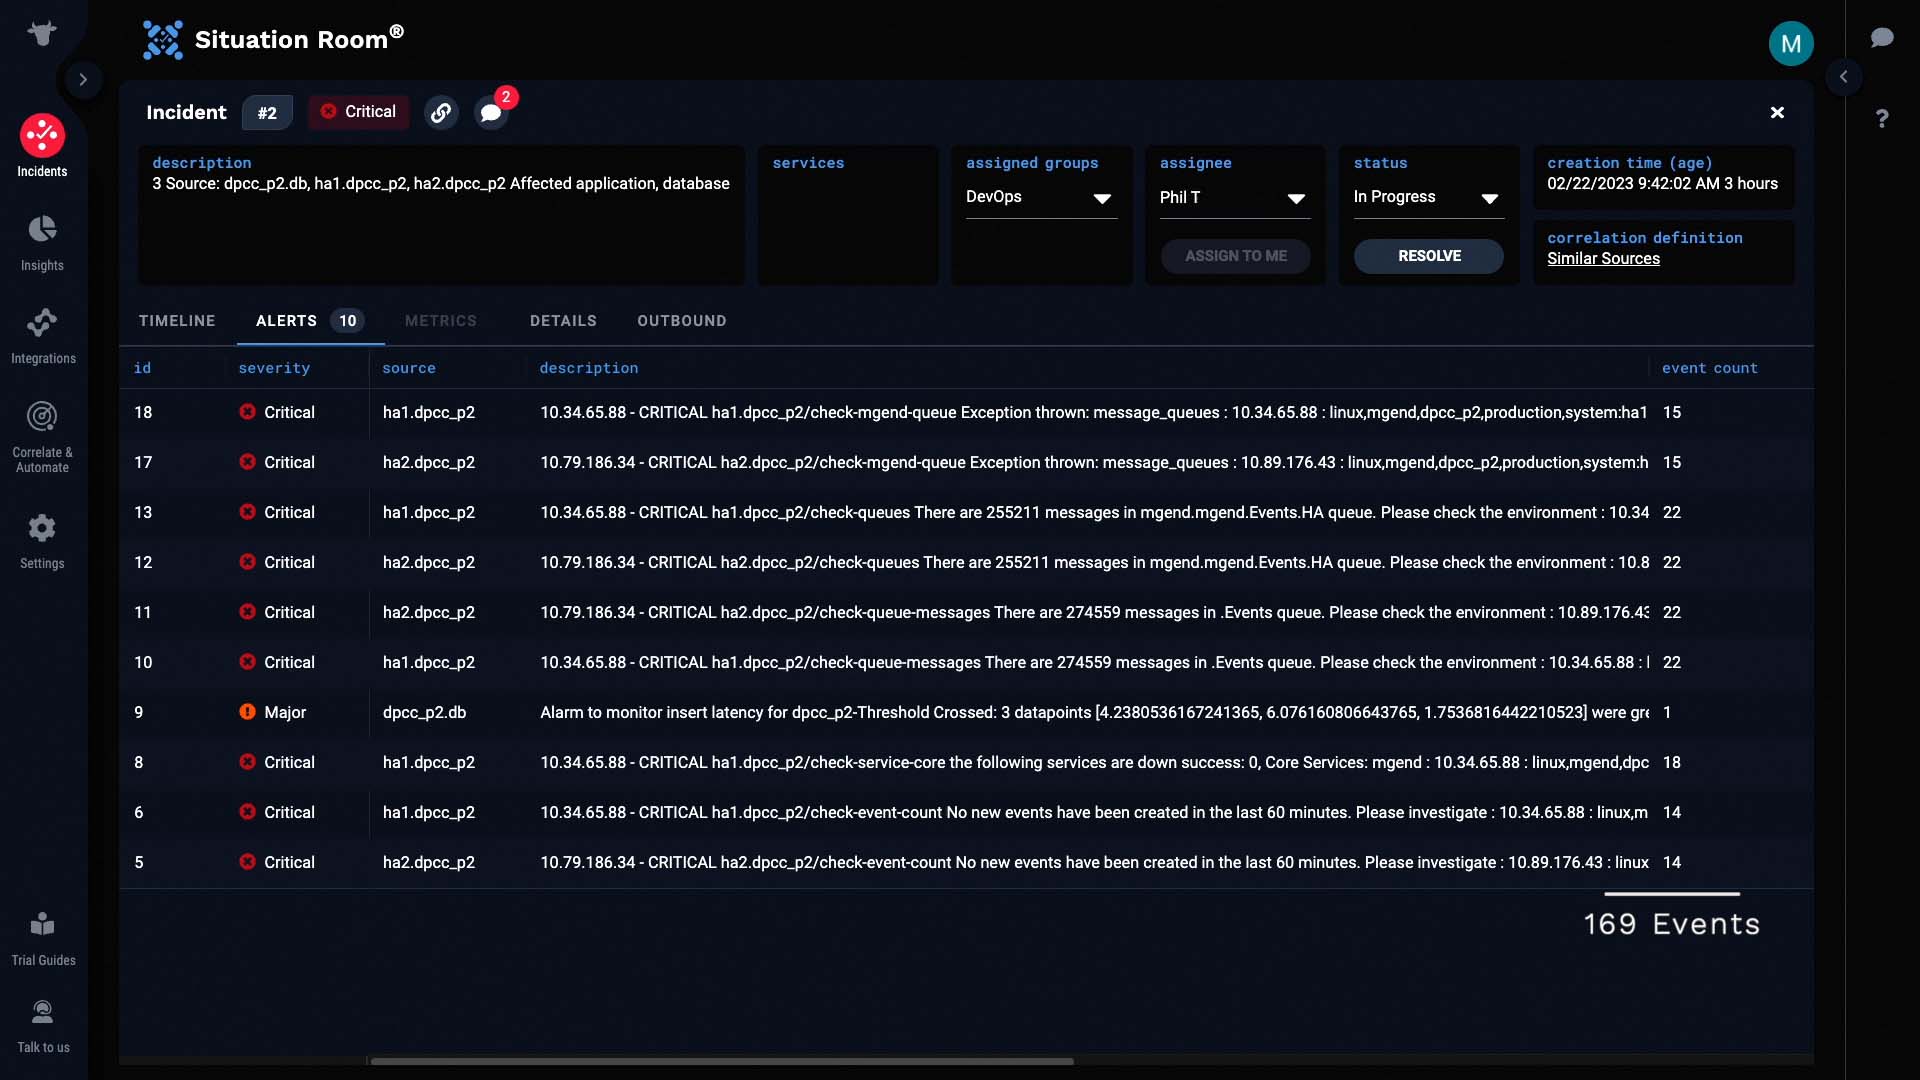
Lets see what else we can learn from the alert details. We can see that the dpcc system is the one involved.
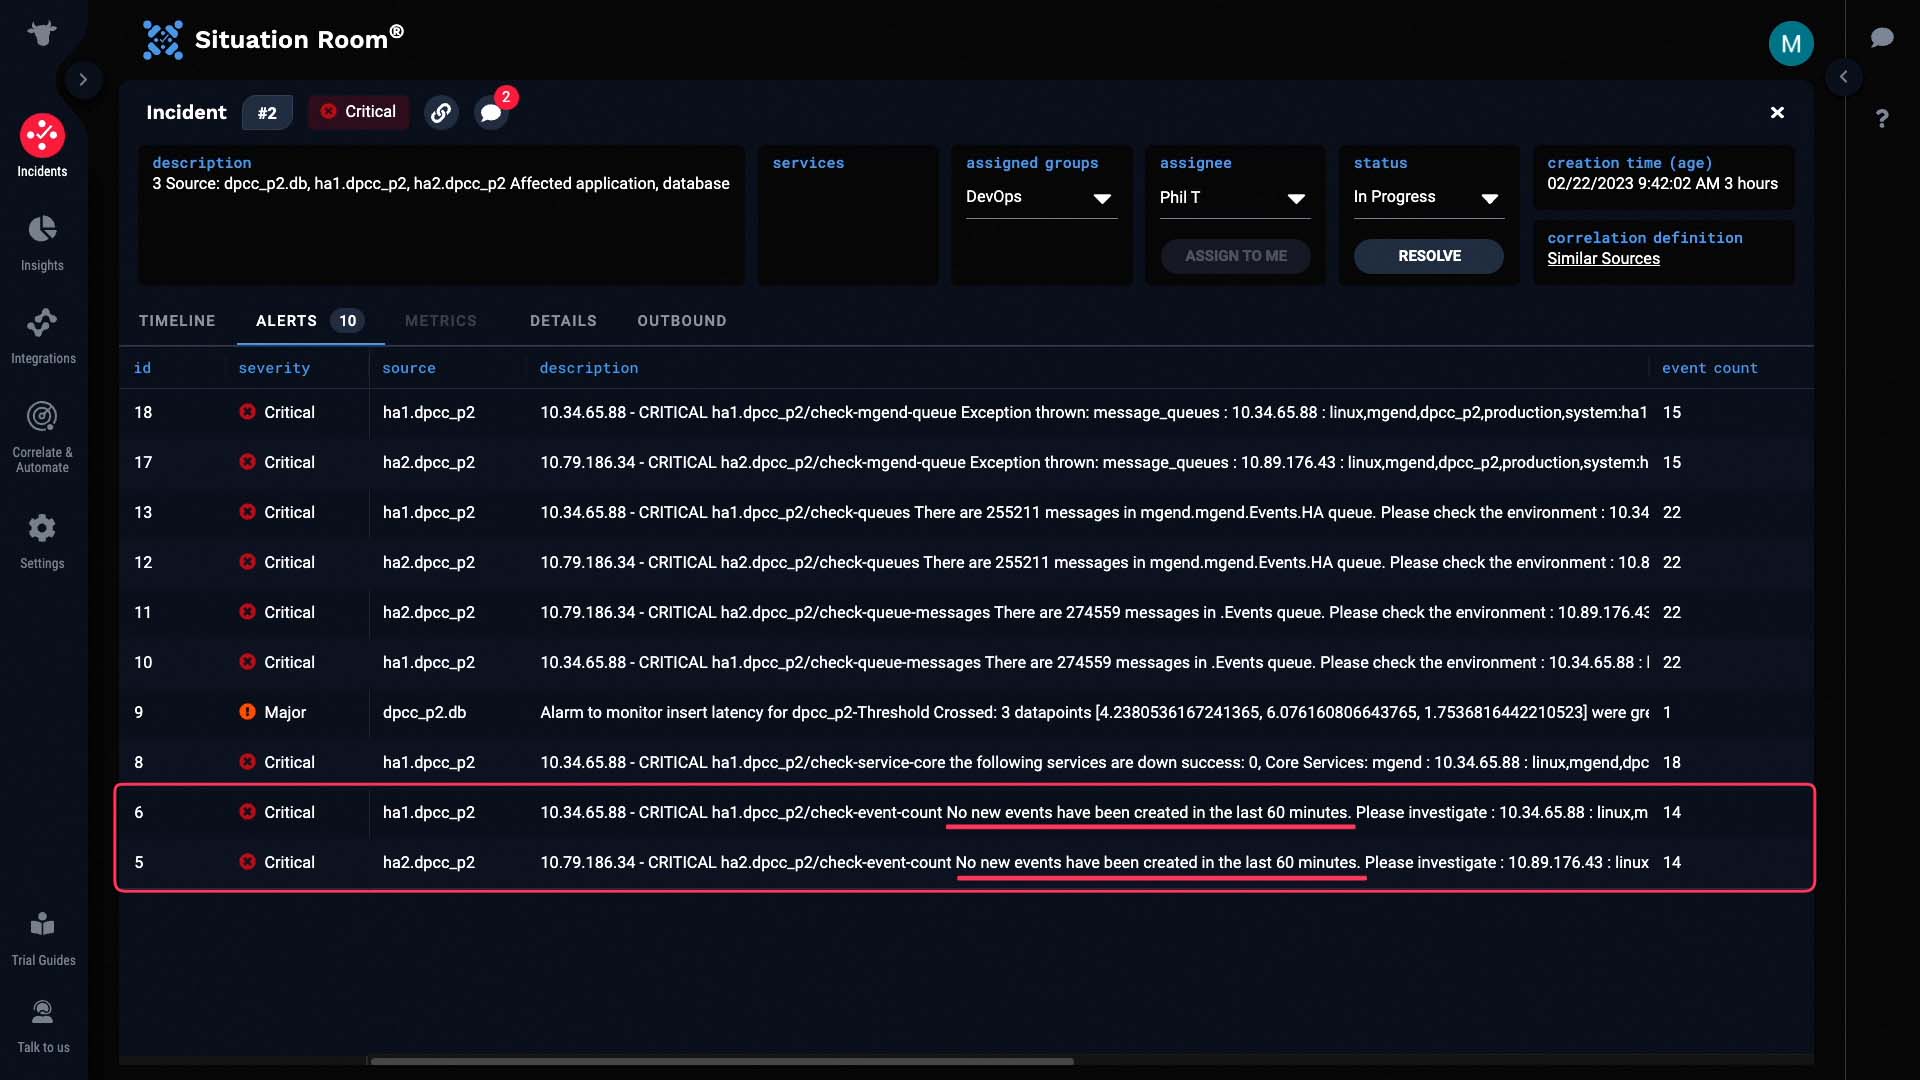
We have a monitoring setting to generate events when there is no activity for a prolonged amount of time. The hosts in this HA pair are not generating data...
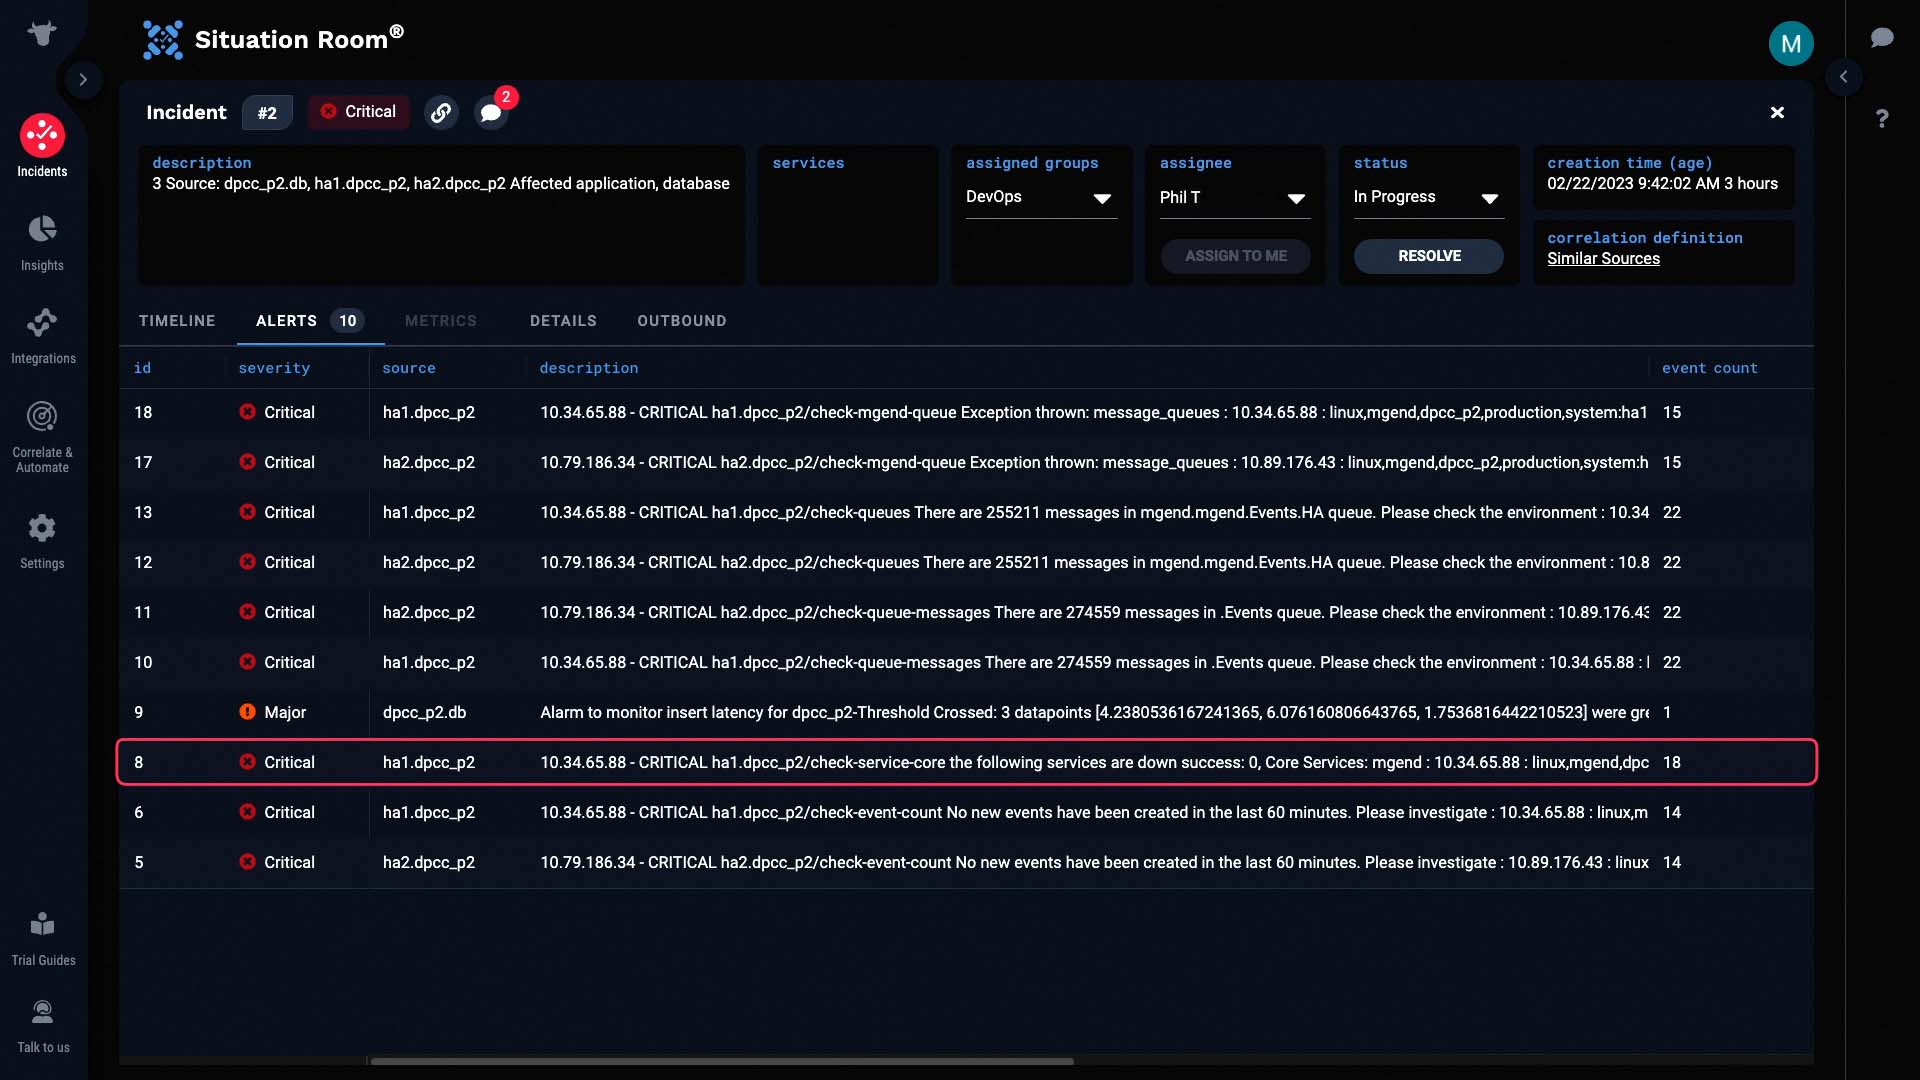
...and it looks like a core service is down.
The internal message queues are backed up.
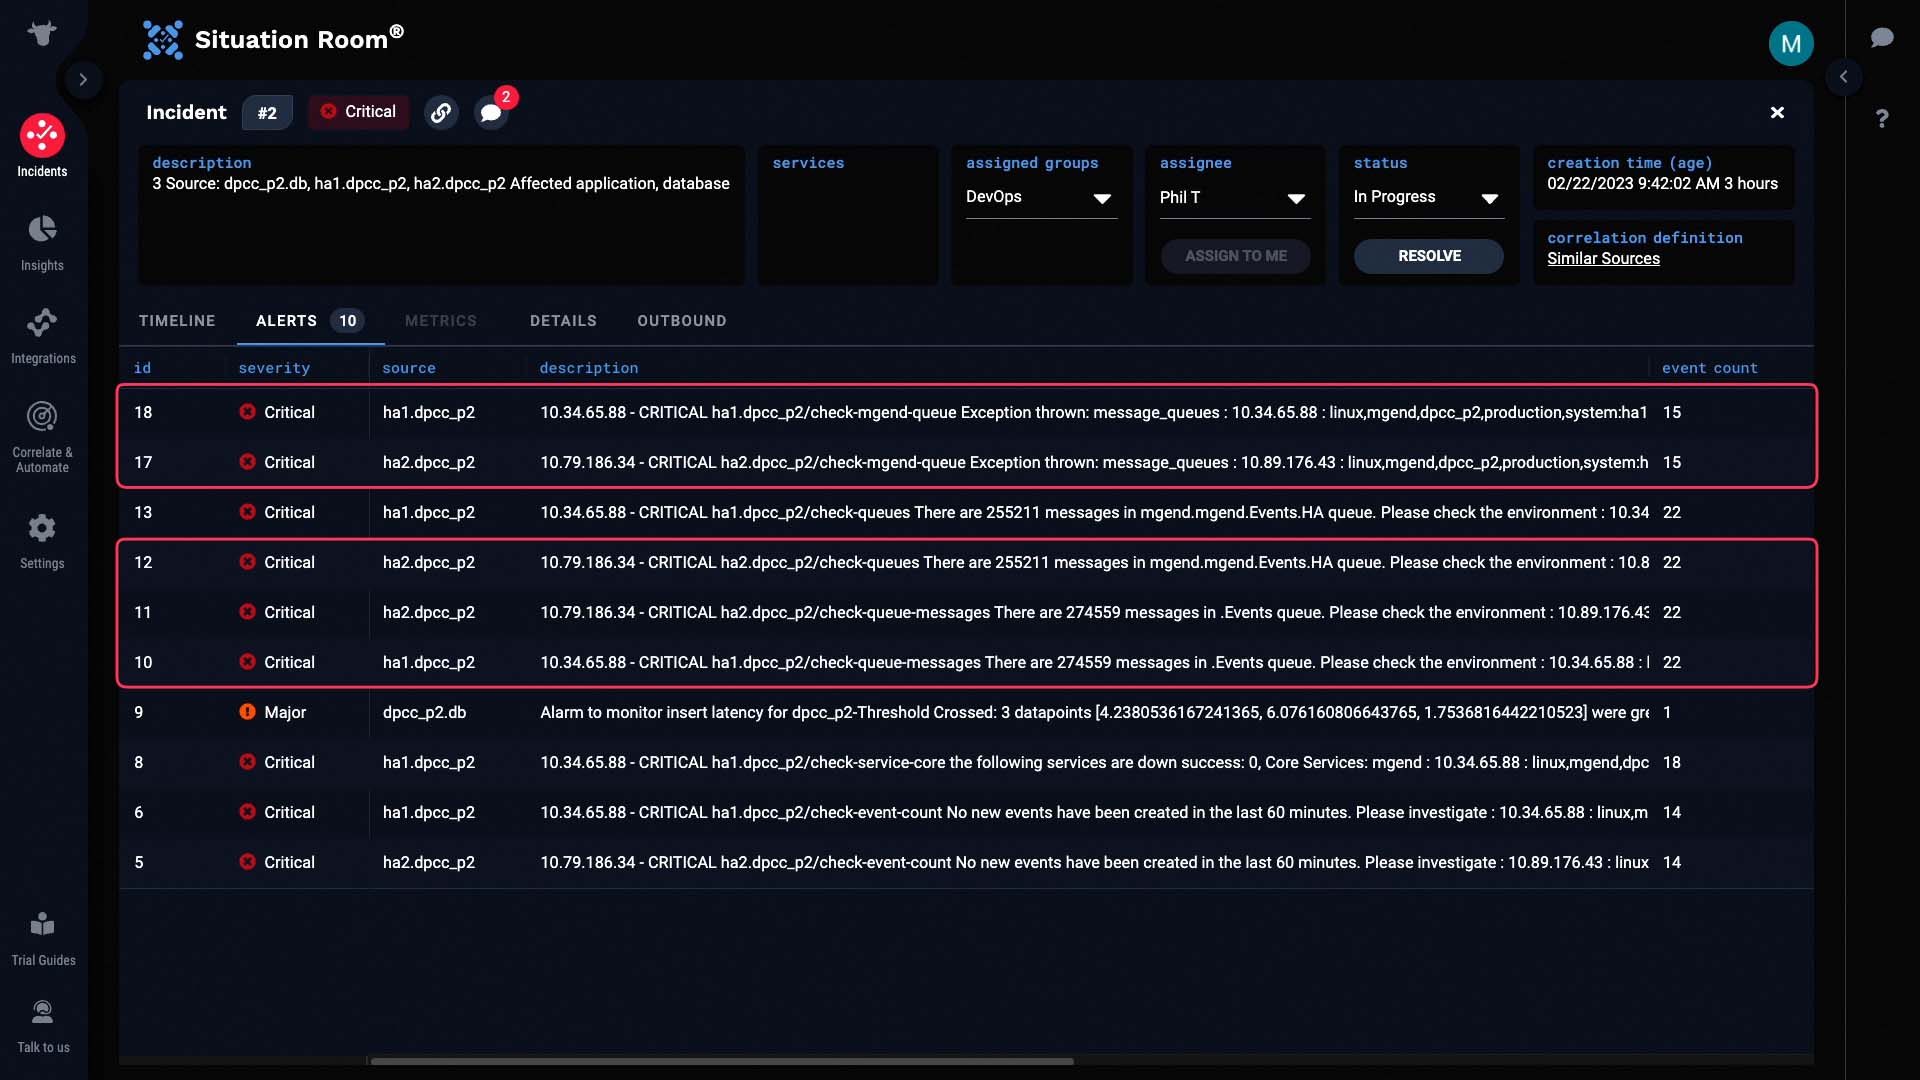
Looking here, it looks like we are having problems with slow database writes. It’s possible that database problems might have caused the core processing service to fail.
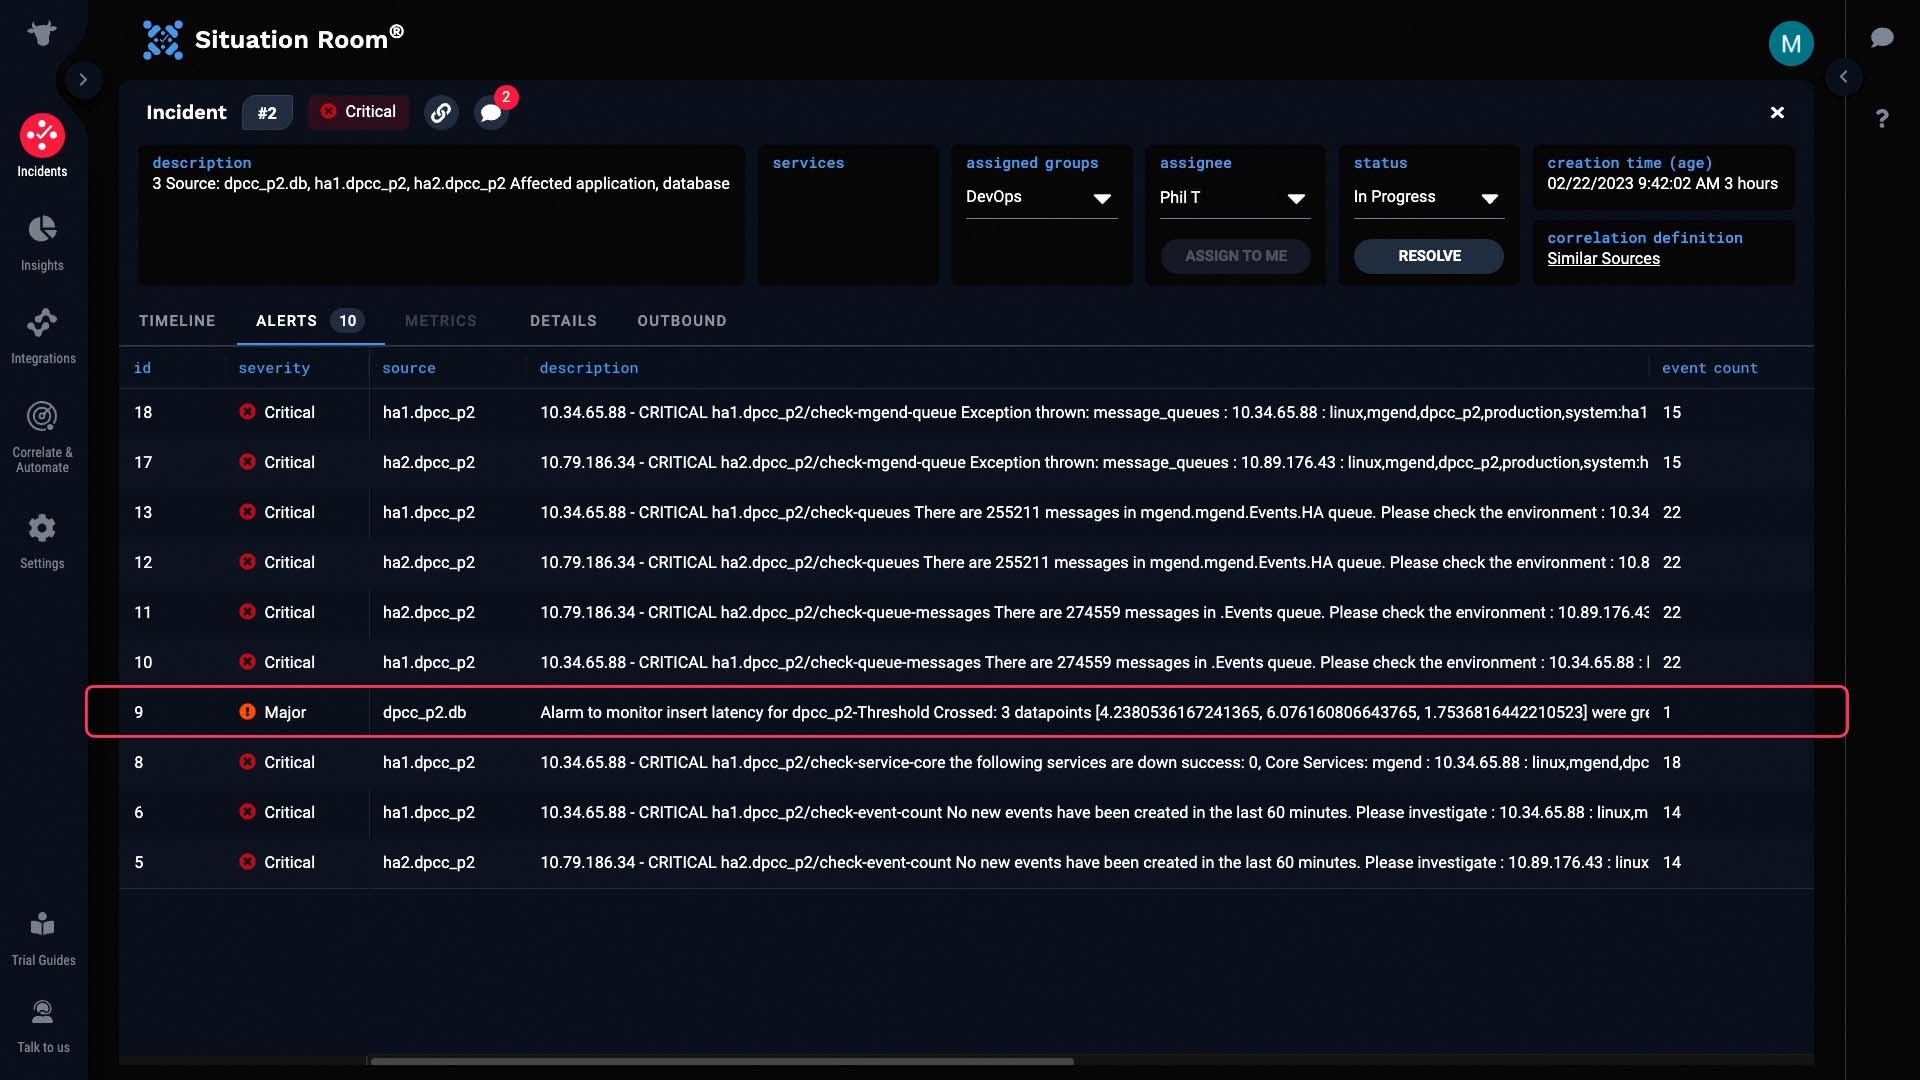
So, through Incident Management’s deduplication and correlation functionality, instead of looking at 1700 events to find 169 related events, you are presented with a complete picture from the start. Thanks for watching!