Module 1: Data ingestion
Module contents:
BASIC | 2 MIN
Moogsoft offers several different methods of getting data into the product.
Can you explain which method to use for a given use case?
Can you explain the characteristics of each type?
Watch the video if you are not sure!
Consult the documentation for more information.
Demo video: Different ingestion methods in APEX AIOps Incident Management ►
This video explains some of the different methods for ingesting data into APEX AIOps Incident Management, including collectors, tool-specific integrations, and custom (CYOI) integrations.
*Please note Moogsoft is now part of Dell's IT Operations solution called APEX AIOps, and changed its name to APEX AIOps Incident Management. The UI in this video may differ slightly but the content covered is still relevant.
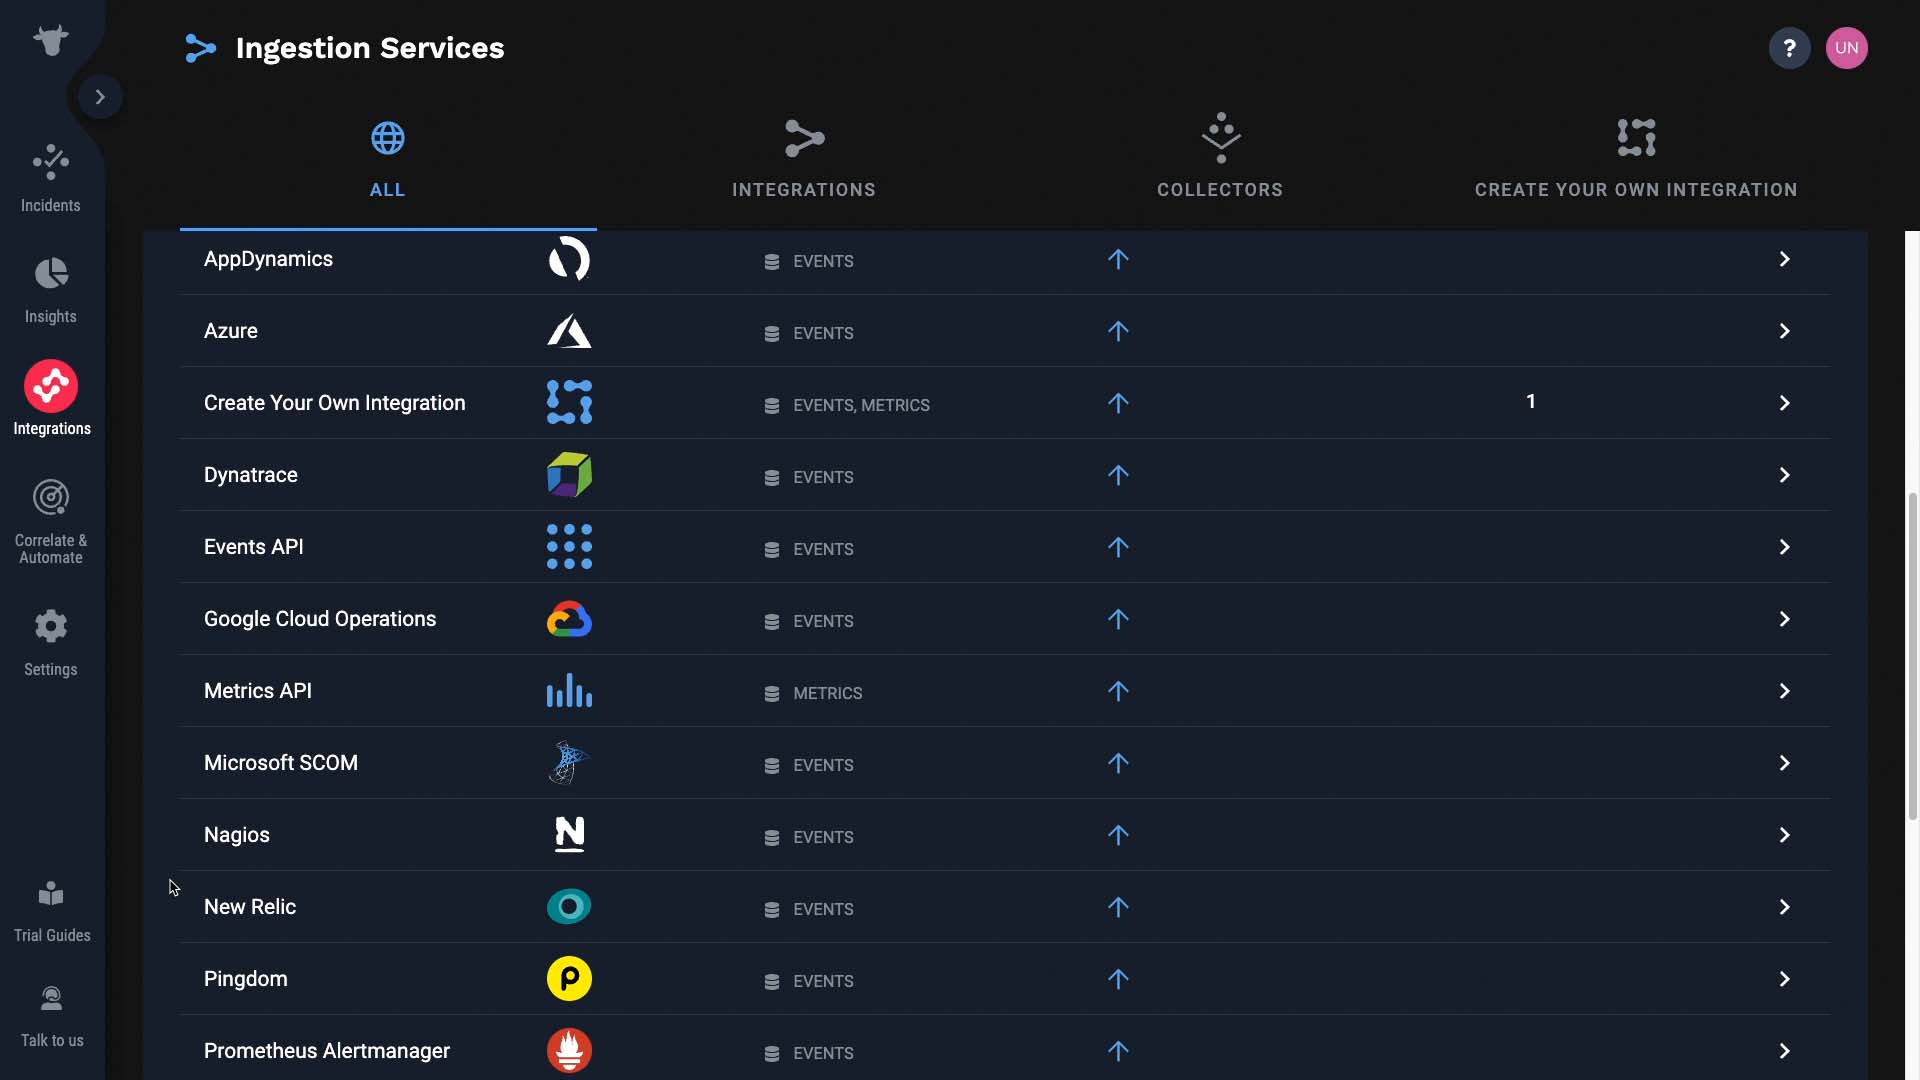
There are a few different methods for ingesting data into Incident Management.
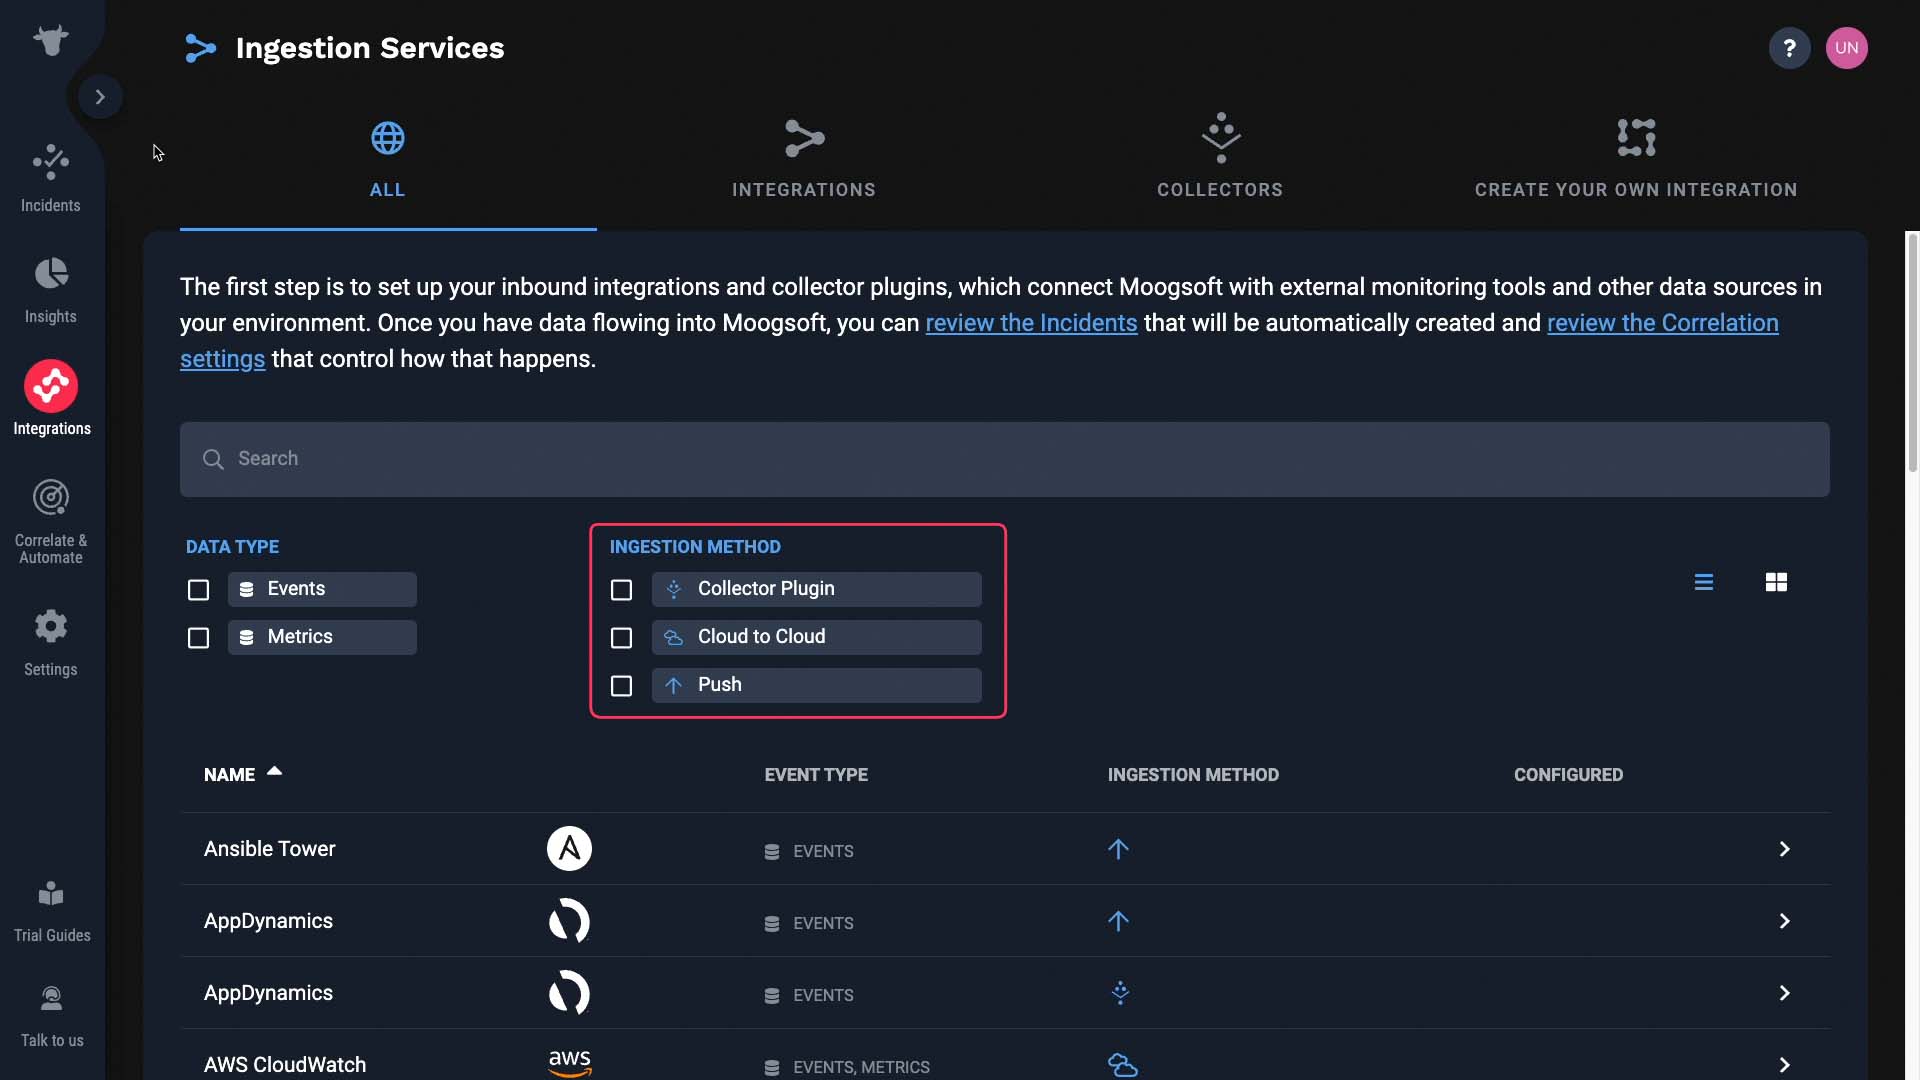
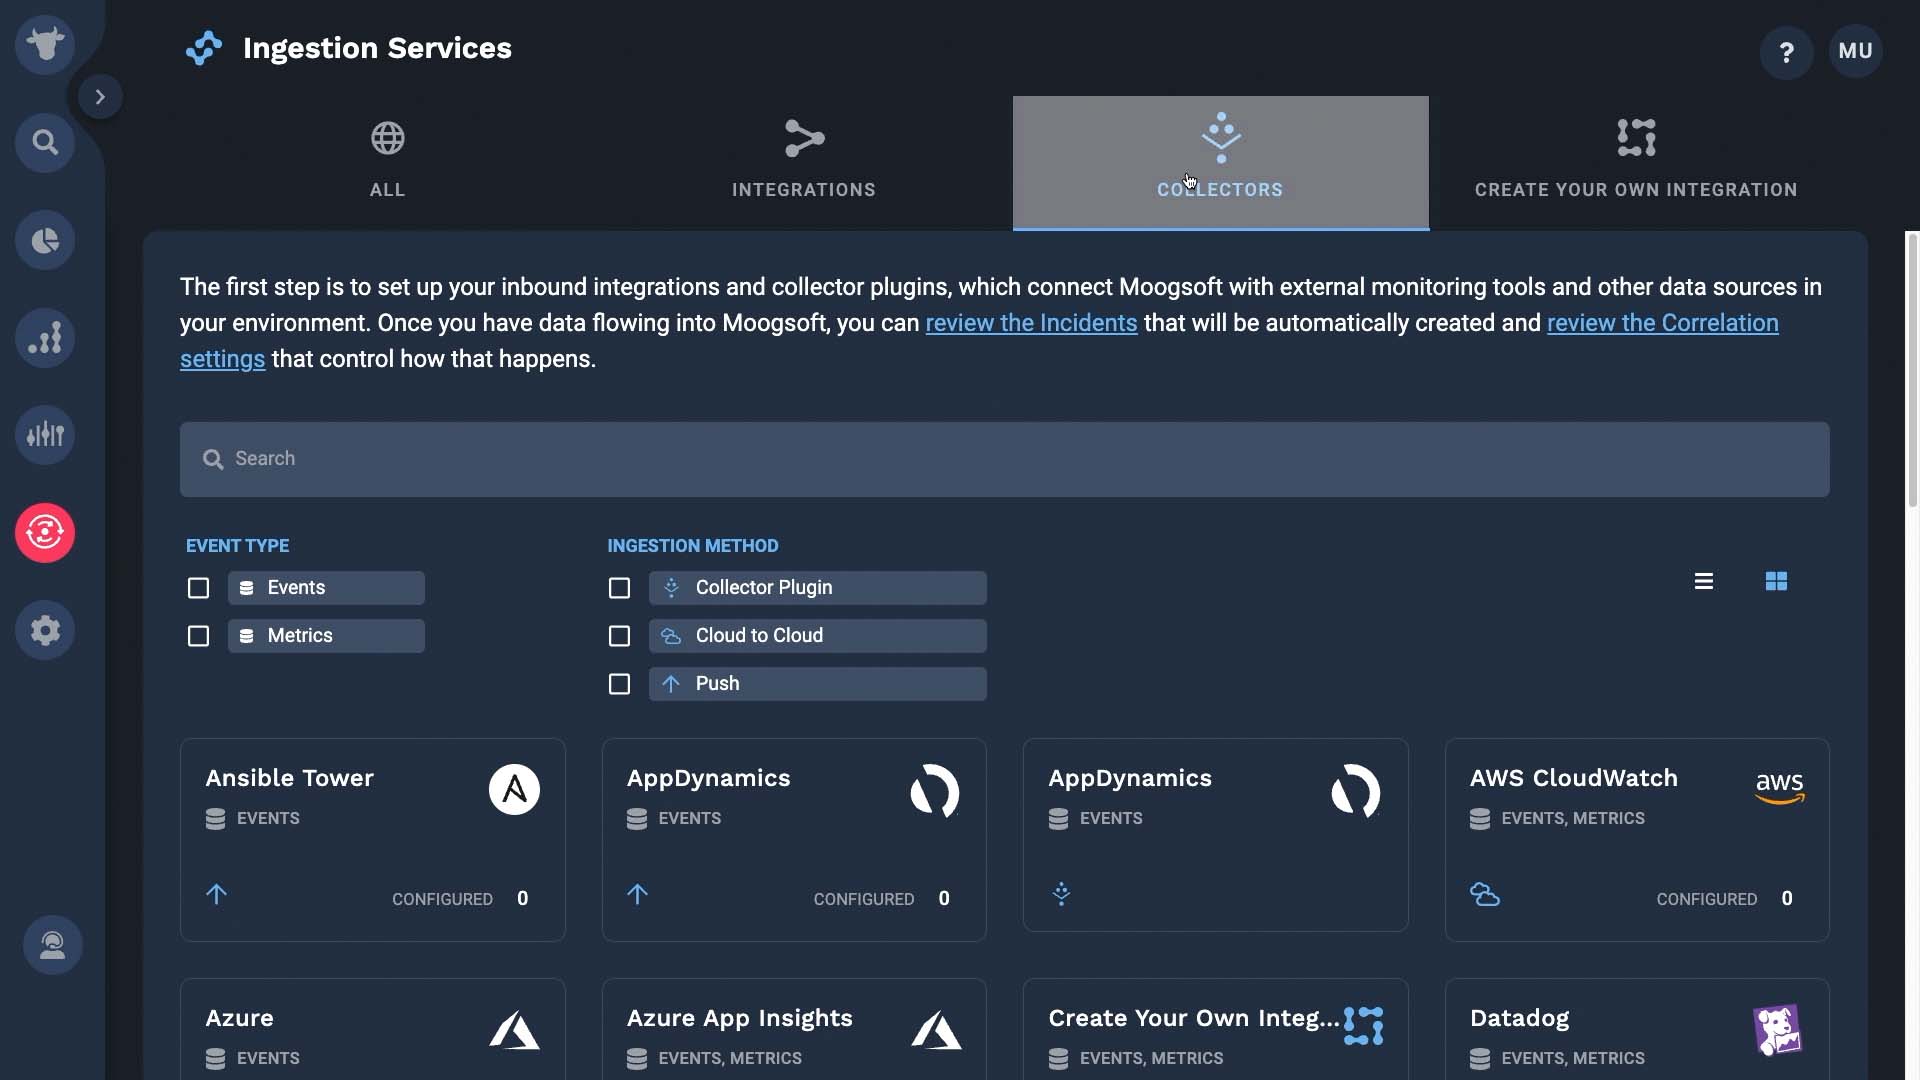
The collector is an agent that is deployed on a system you want to monitor. It handles discovery and sourcing metrics data. Then it transmits the data to Incident Management without the involvement of an additional third-party software product.
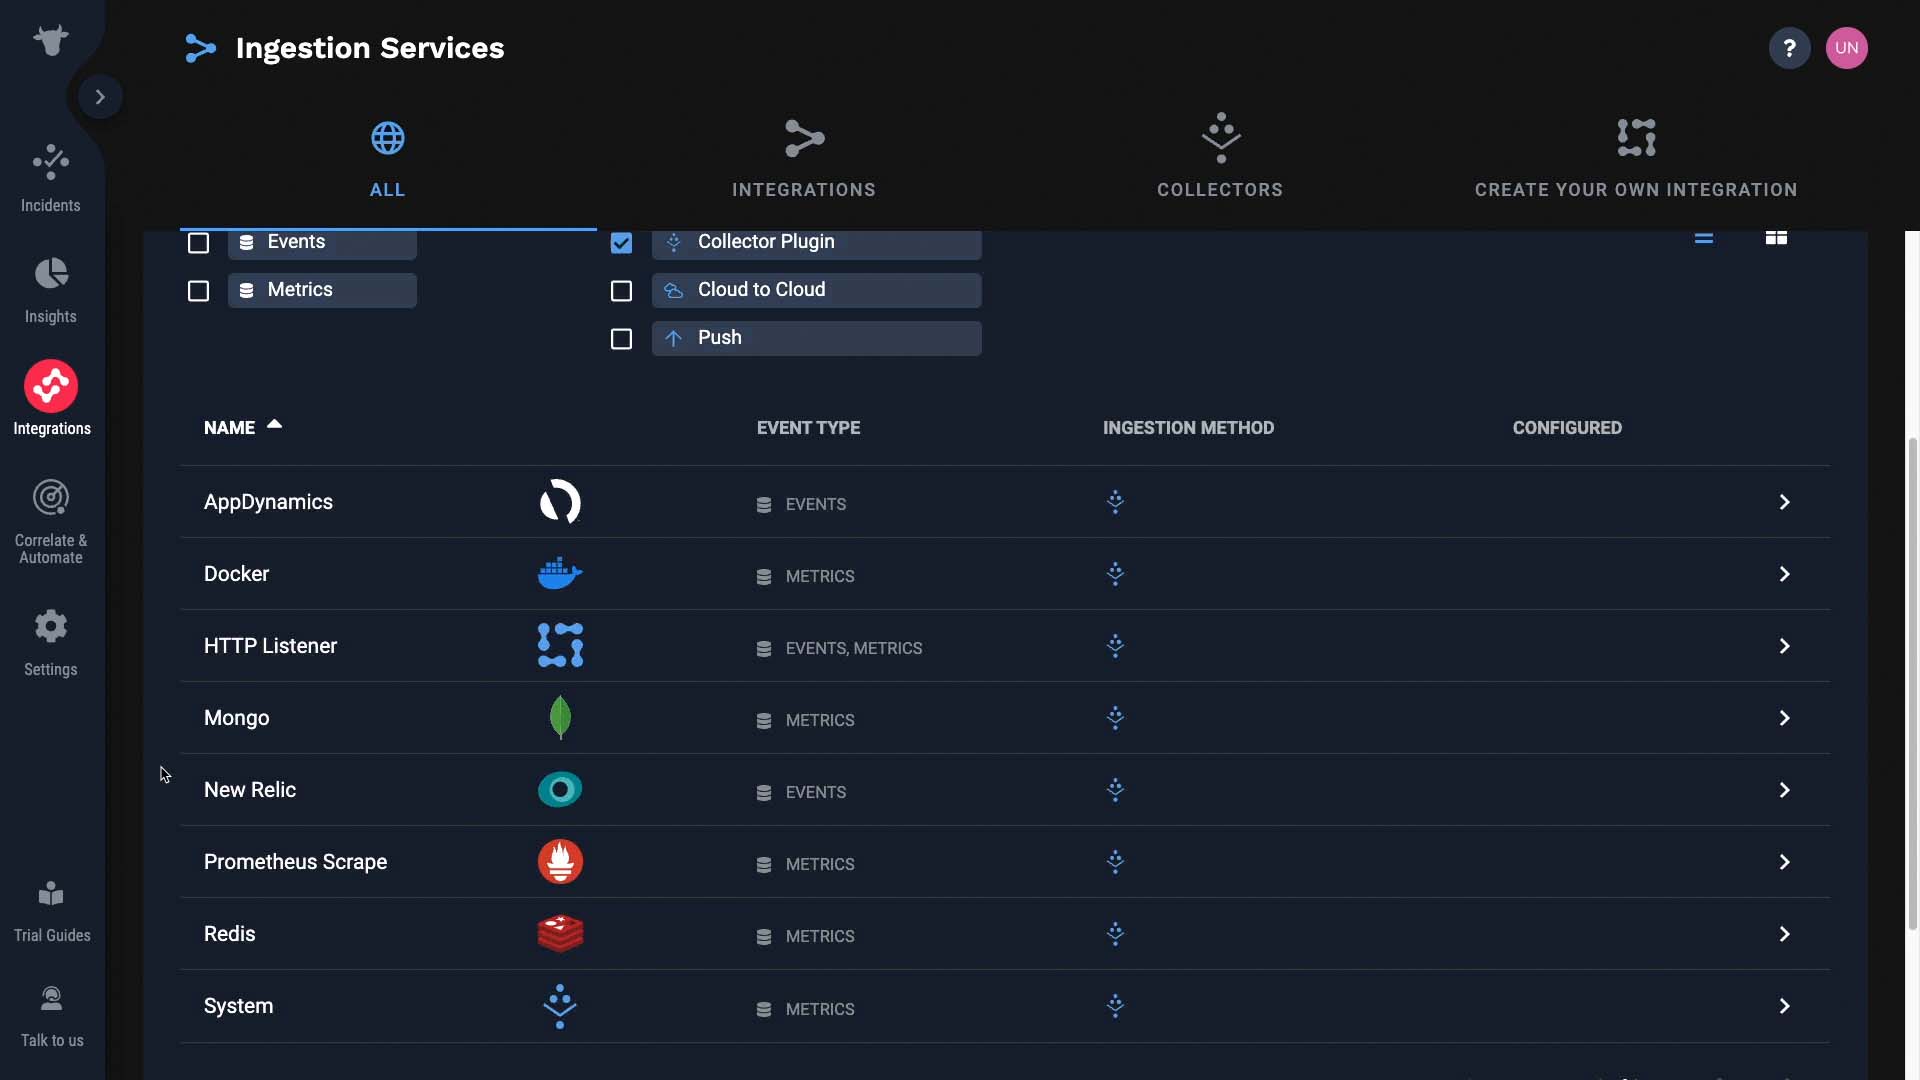
These are tool-specific integrations.
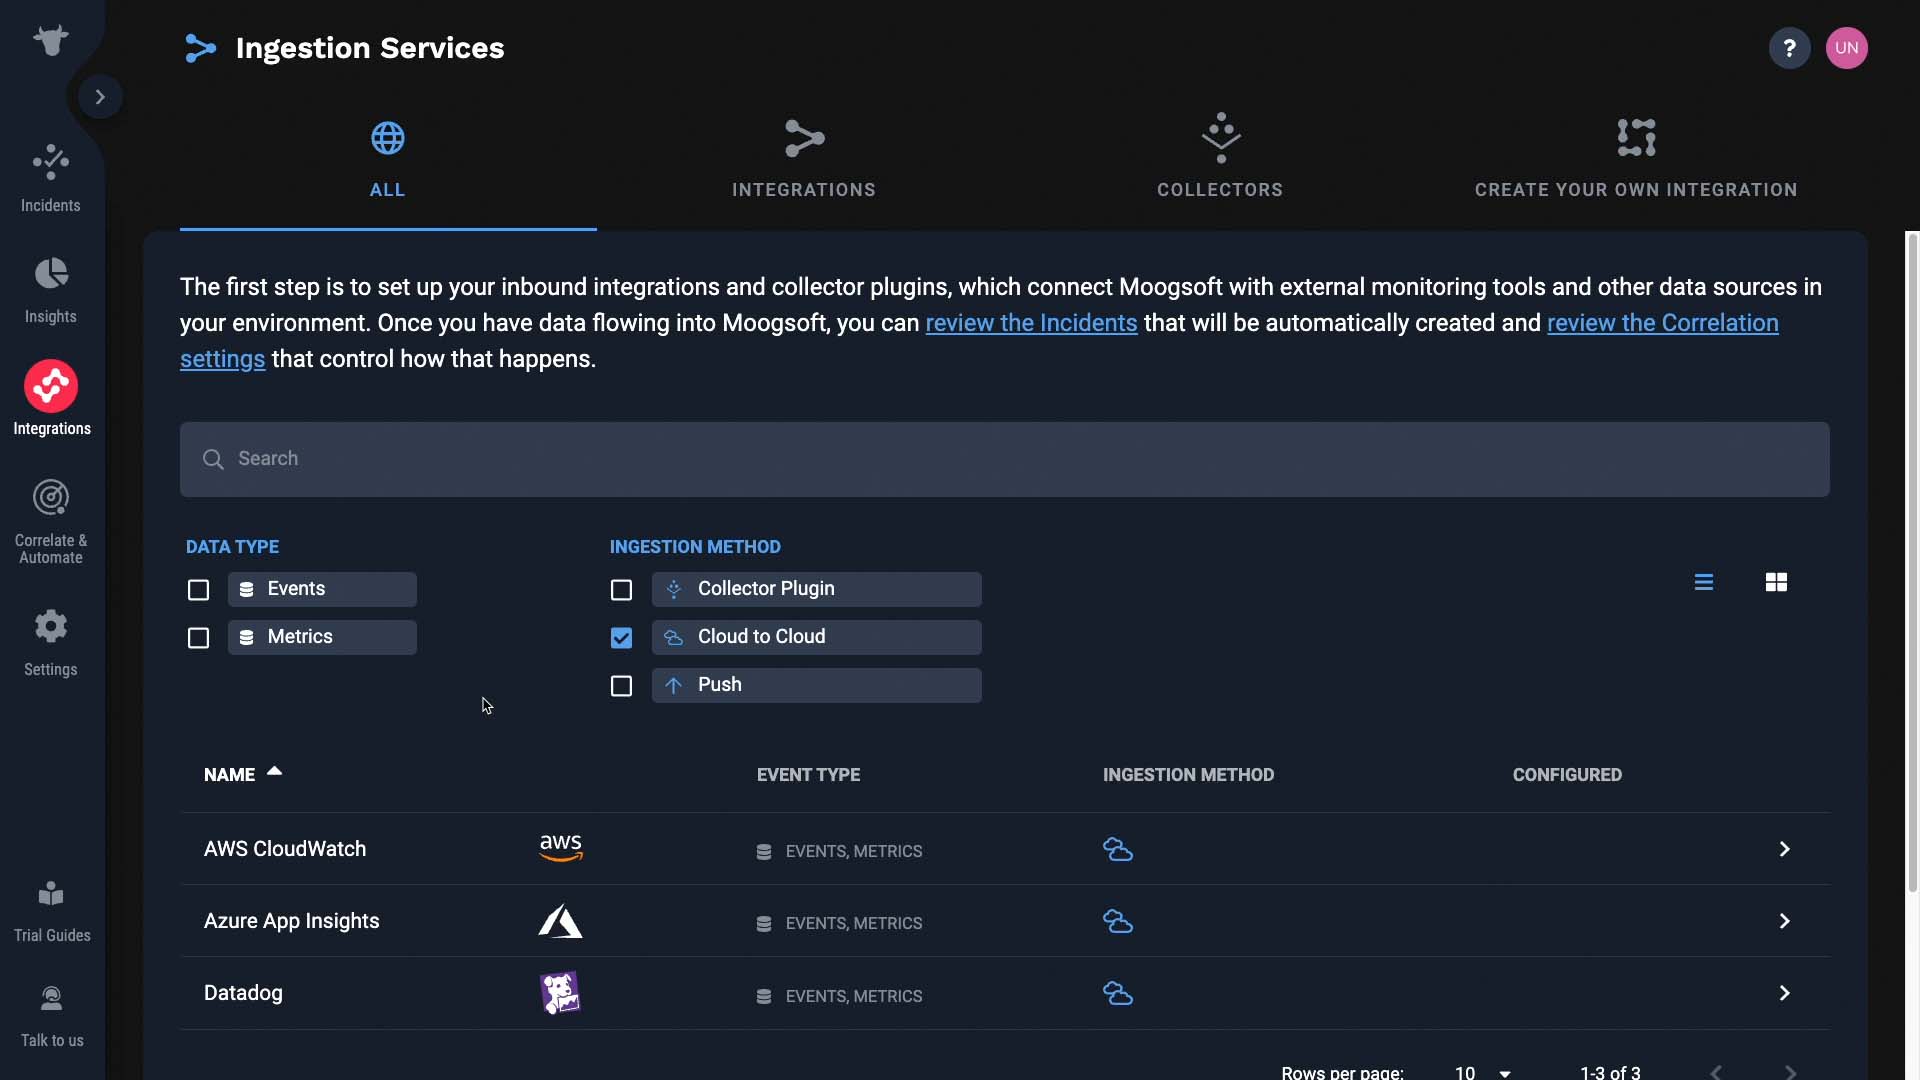
These are fully UI-based integrations and include logic to reformat data from third-party software into Incident Management format without additional configuration.
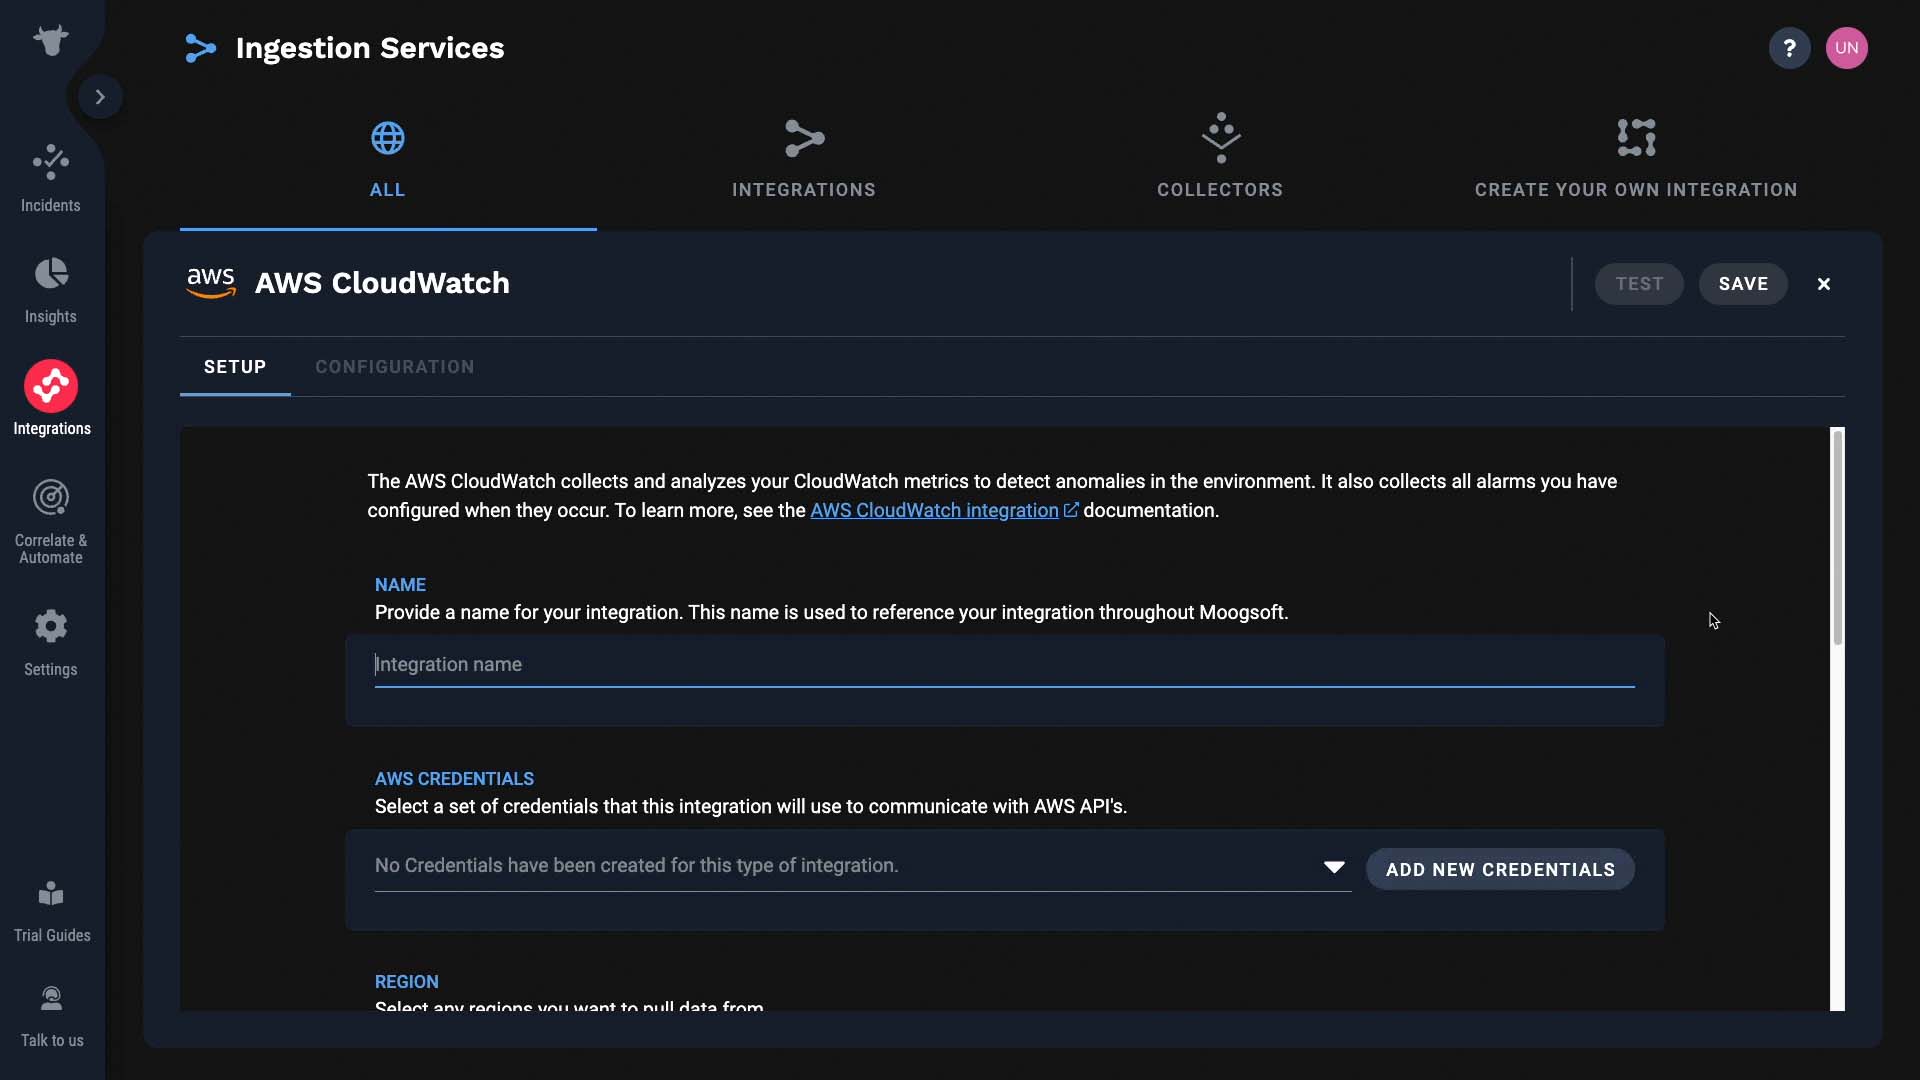
Push integrations are done via webhook. These consist of instructions and preconfigured mappings for transmitting data from a third-party monitoring application to Incident Management.
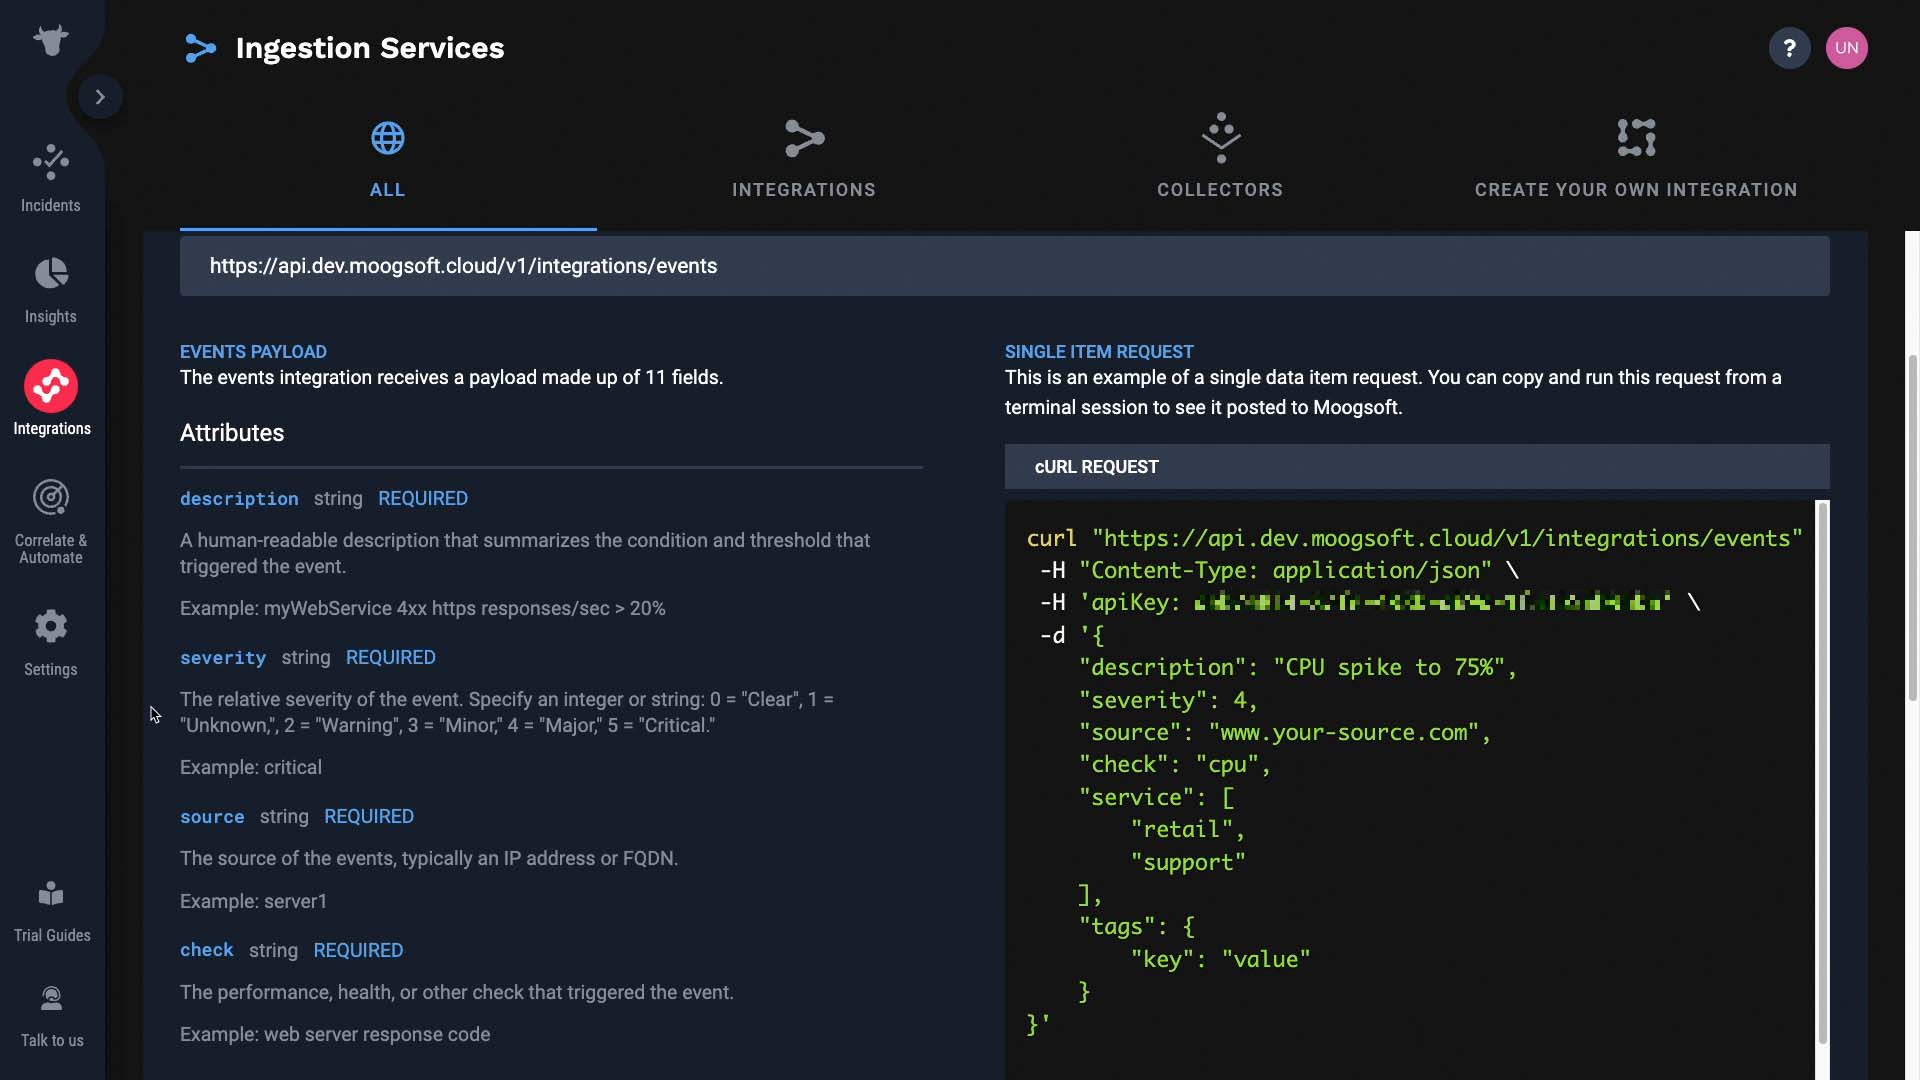
Under the push category, we also offer API-based integrations. Events and metrics API pages include a full description of the schema and required fields, as well as auto-generated cURL commands with example JSON events.
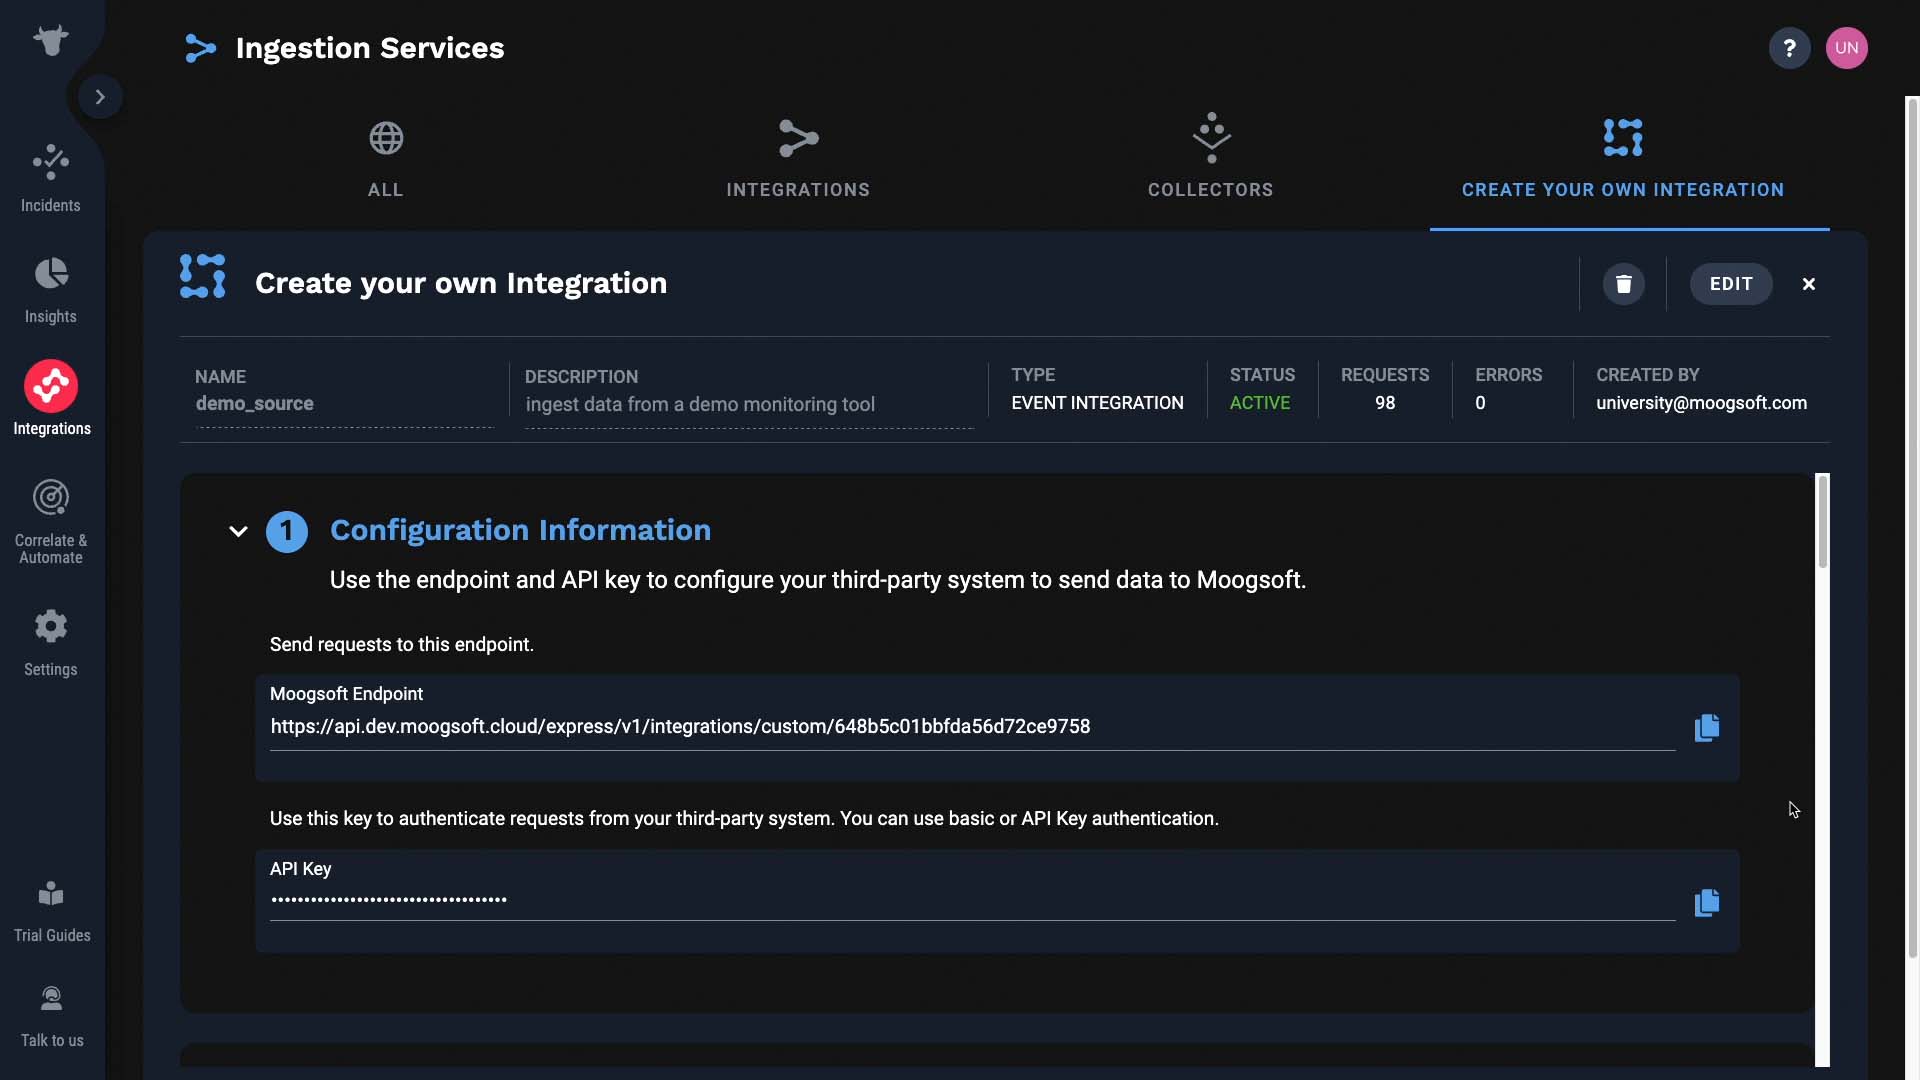
You can also build a custom integration. Choose this option over the events or metrics APIs if you want to ingest data with different schemas, and specify how to map third-party data to Incident Management.
BASIC | 2 MIN
Do you know how to install a Moogsoft collector? If not watch this demo.
Documentation is available here.
Demo video: Install an APEX AIOps Incident Management Collector ►
This video explains how to Install an APEX AIOps Incident Management Collector on an Amazon EC2 instance running Docker.
*Please note Moogsoft is now part of Dell's IT Operations solution called APEX AIOps, and changed its name to APEX AIOps Incident Management. The UI in this video may differ slightly but the content covered is still relevant.
In this demo, we are going to install the APEX AIOps Incident Management collector to an EC2 instance that's running Docker.
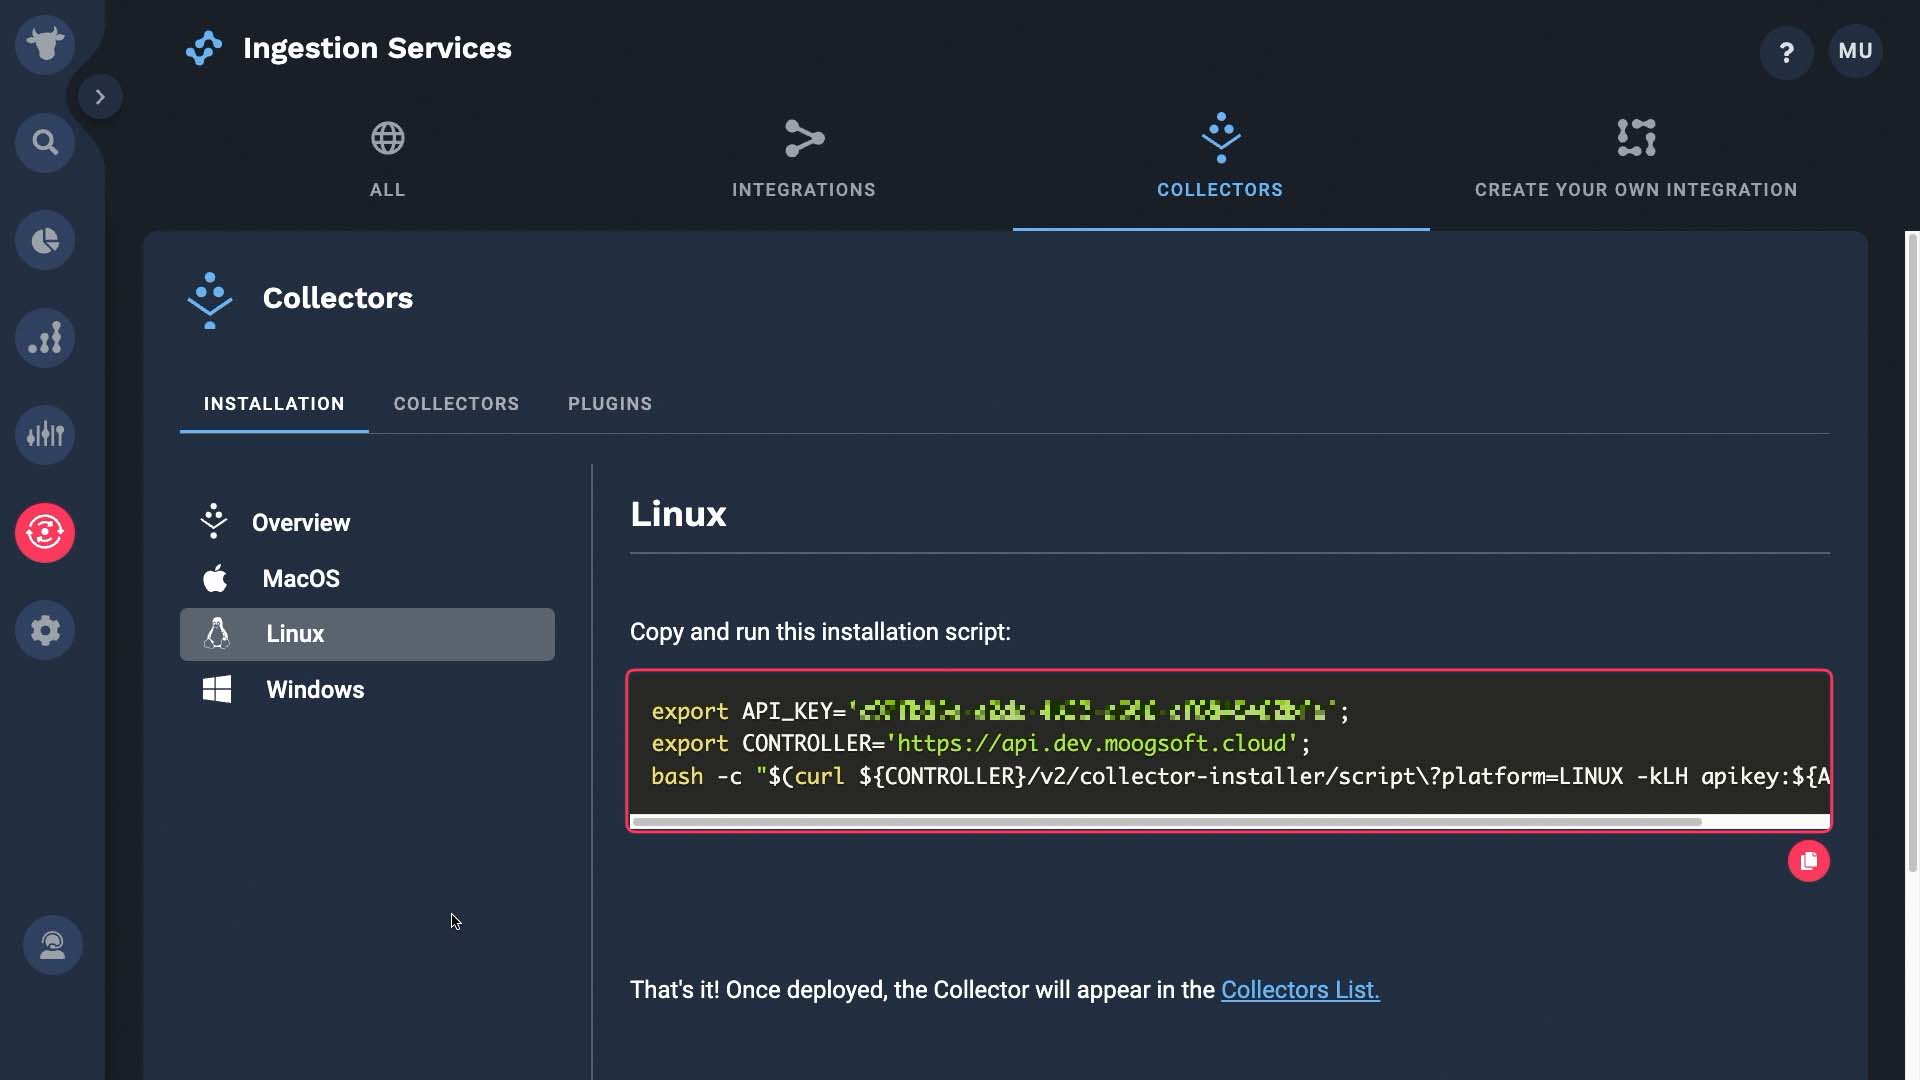
Here's the installation script.
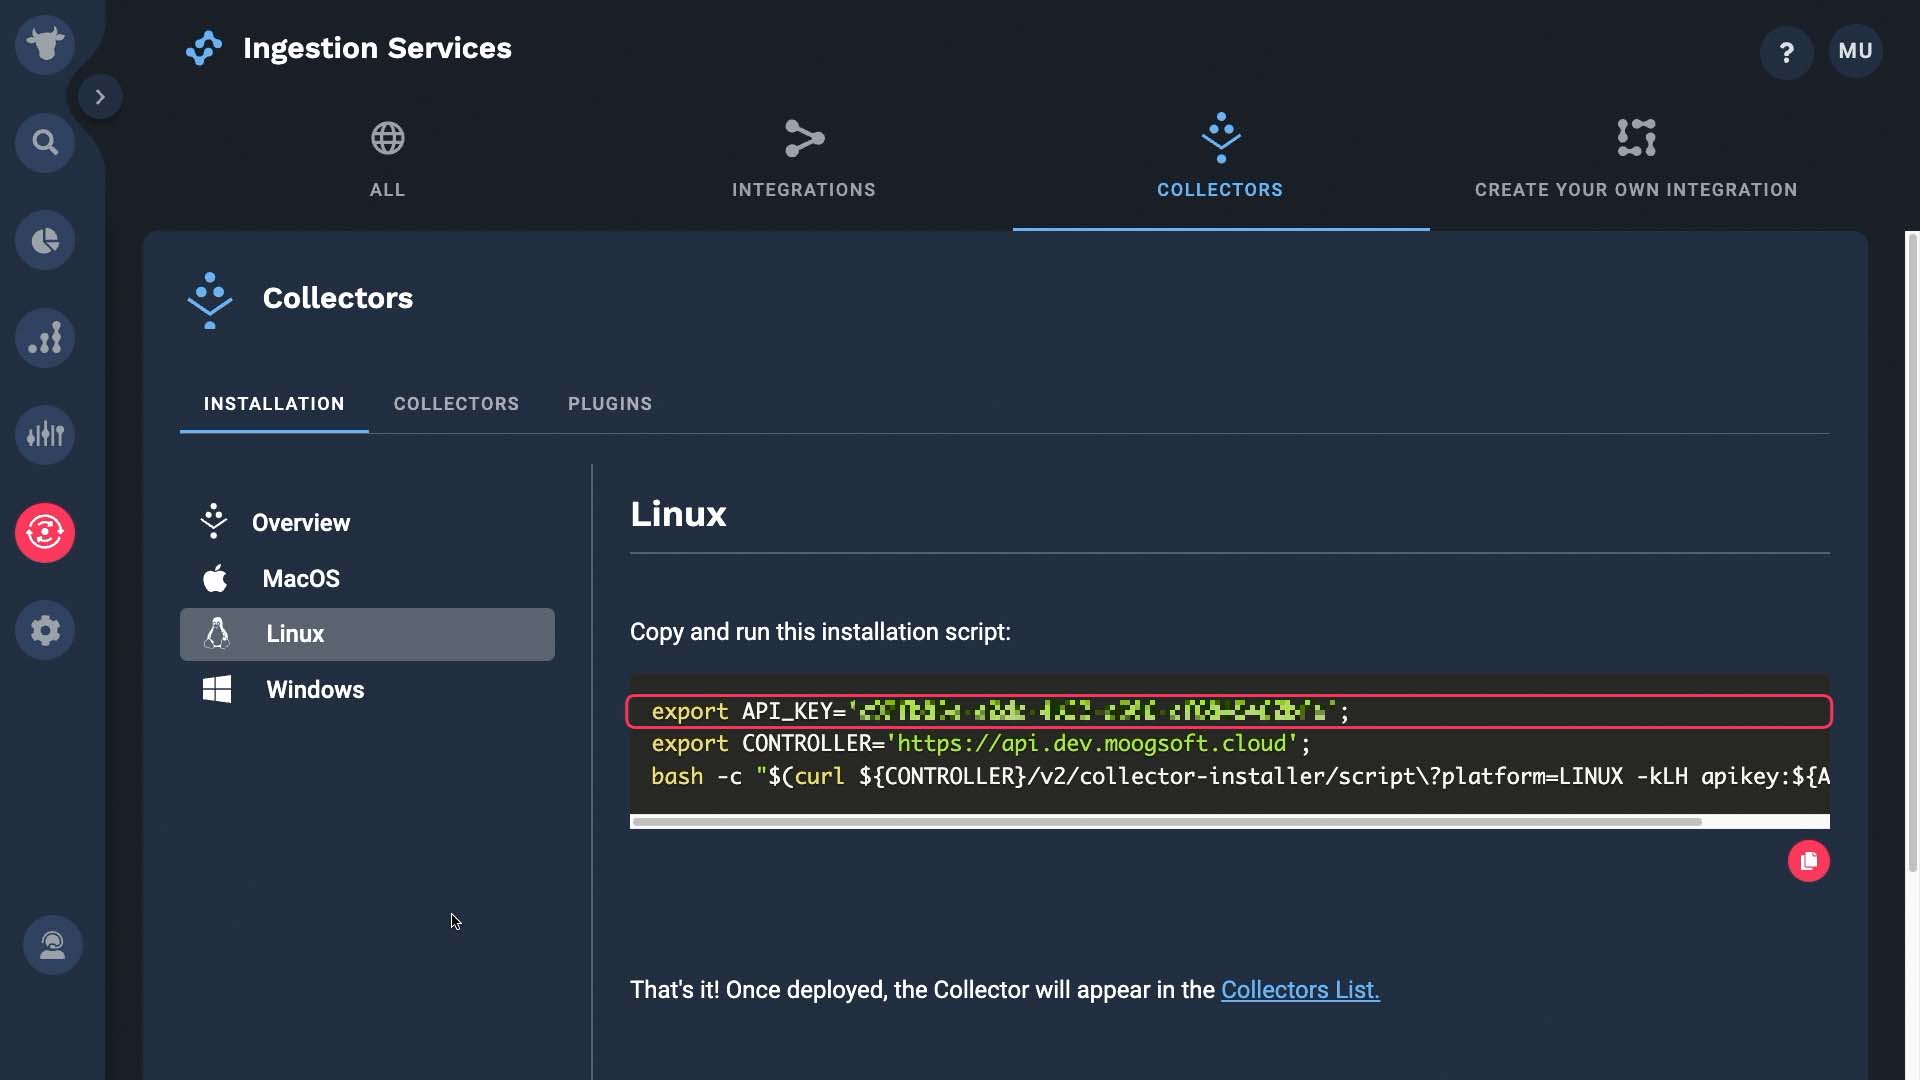
It sets the API key...
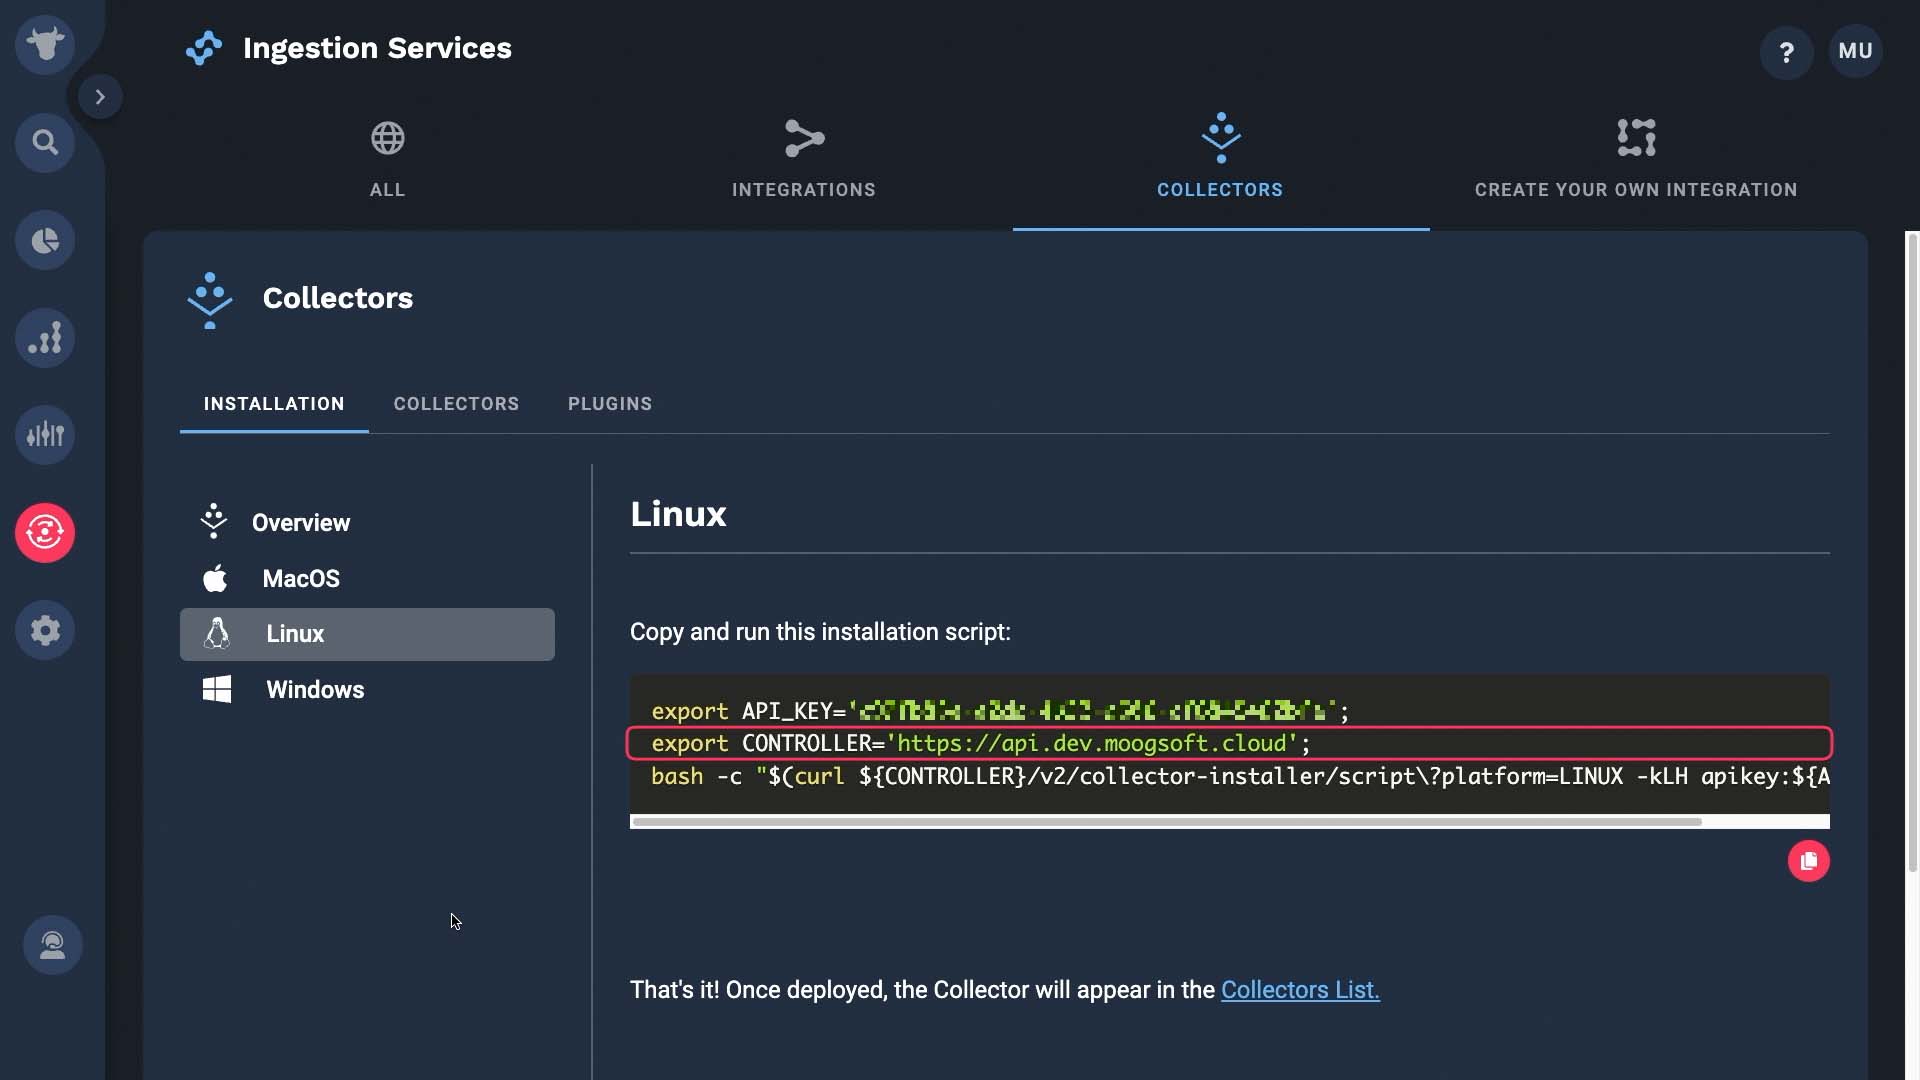
And the controller variable...
...then downloads the installer script and plugs in those variables.
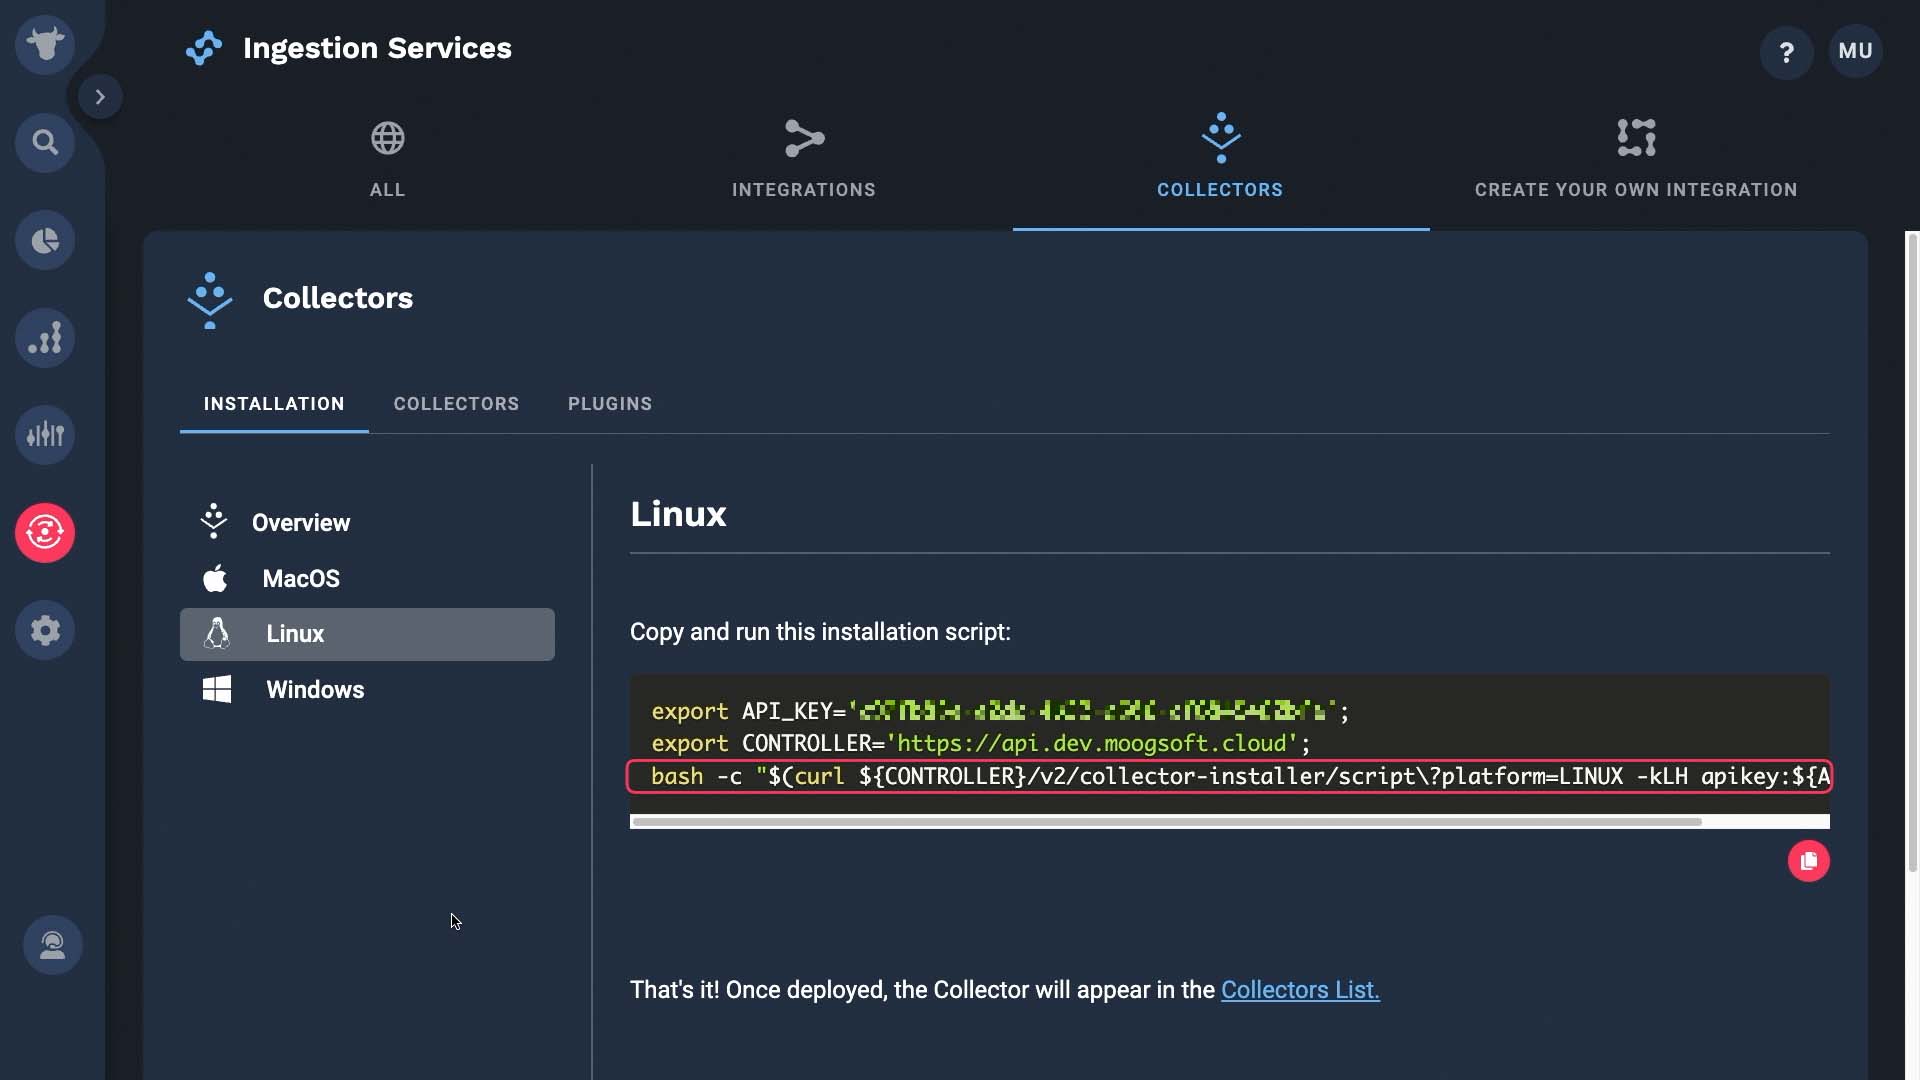
There's one more variable to be set, but we have to run this script first.
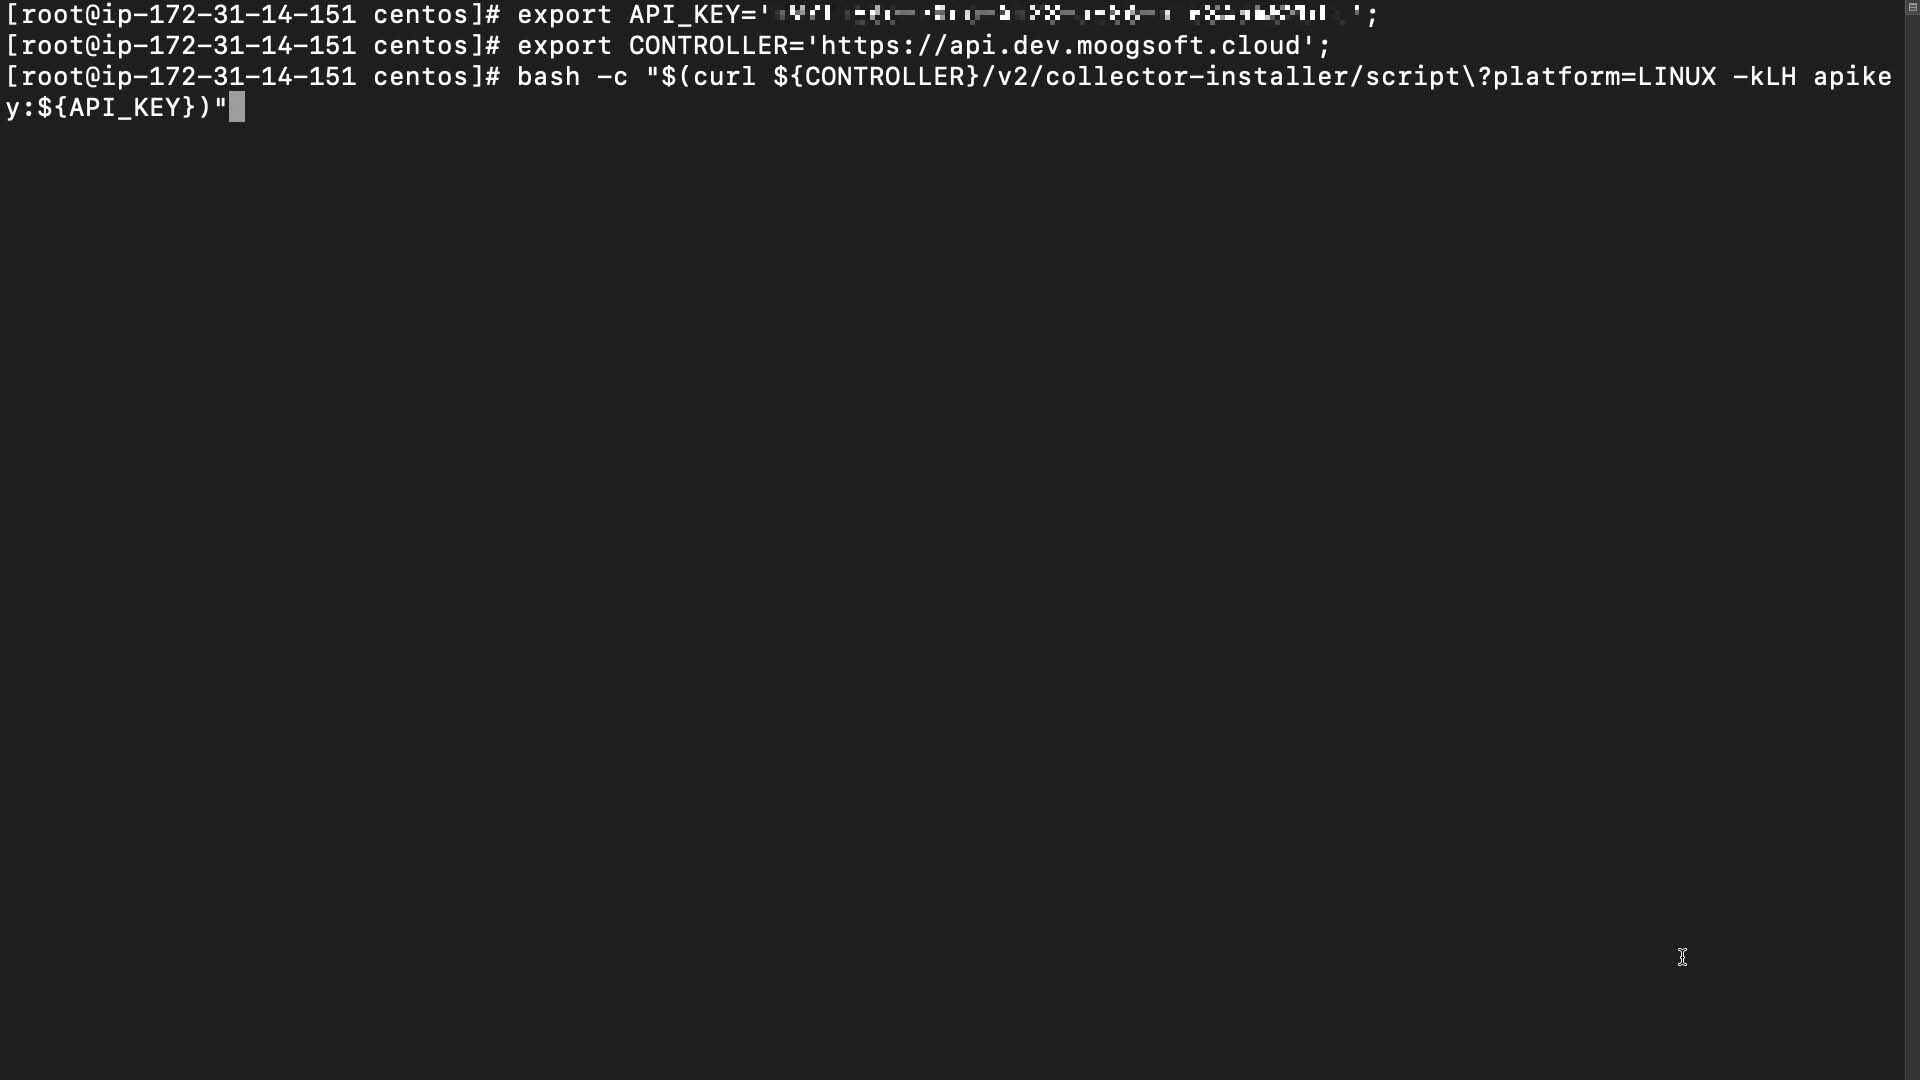
The install script is downloading now.
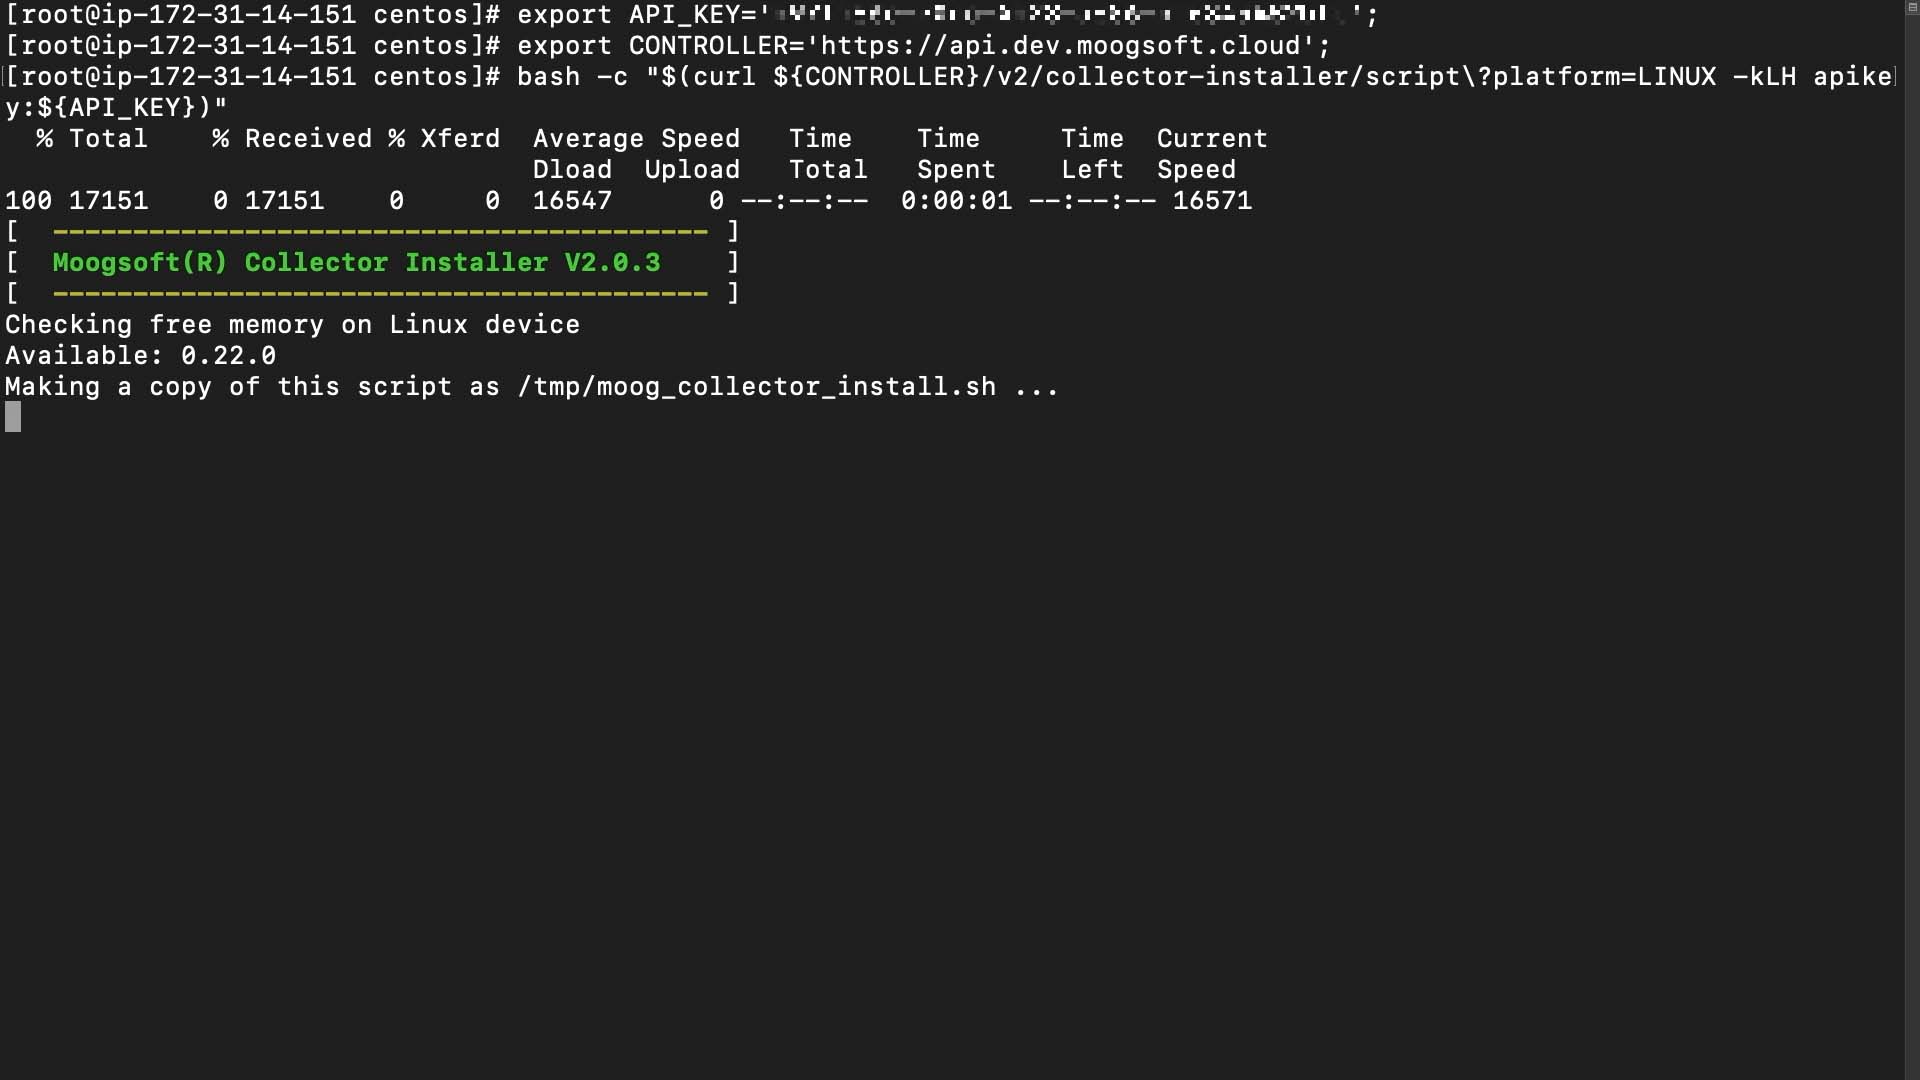
Here’s a prompt to set the file location variable. Note that the file location will be different based on whether you are installing the collector as a root user or not.
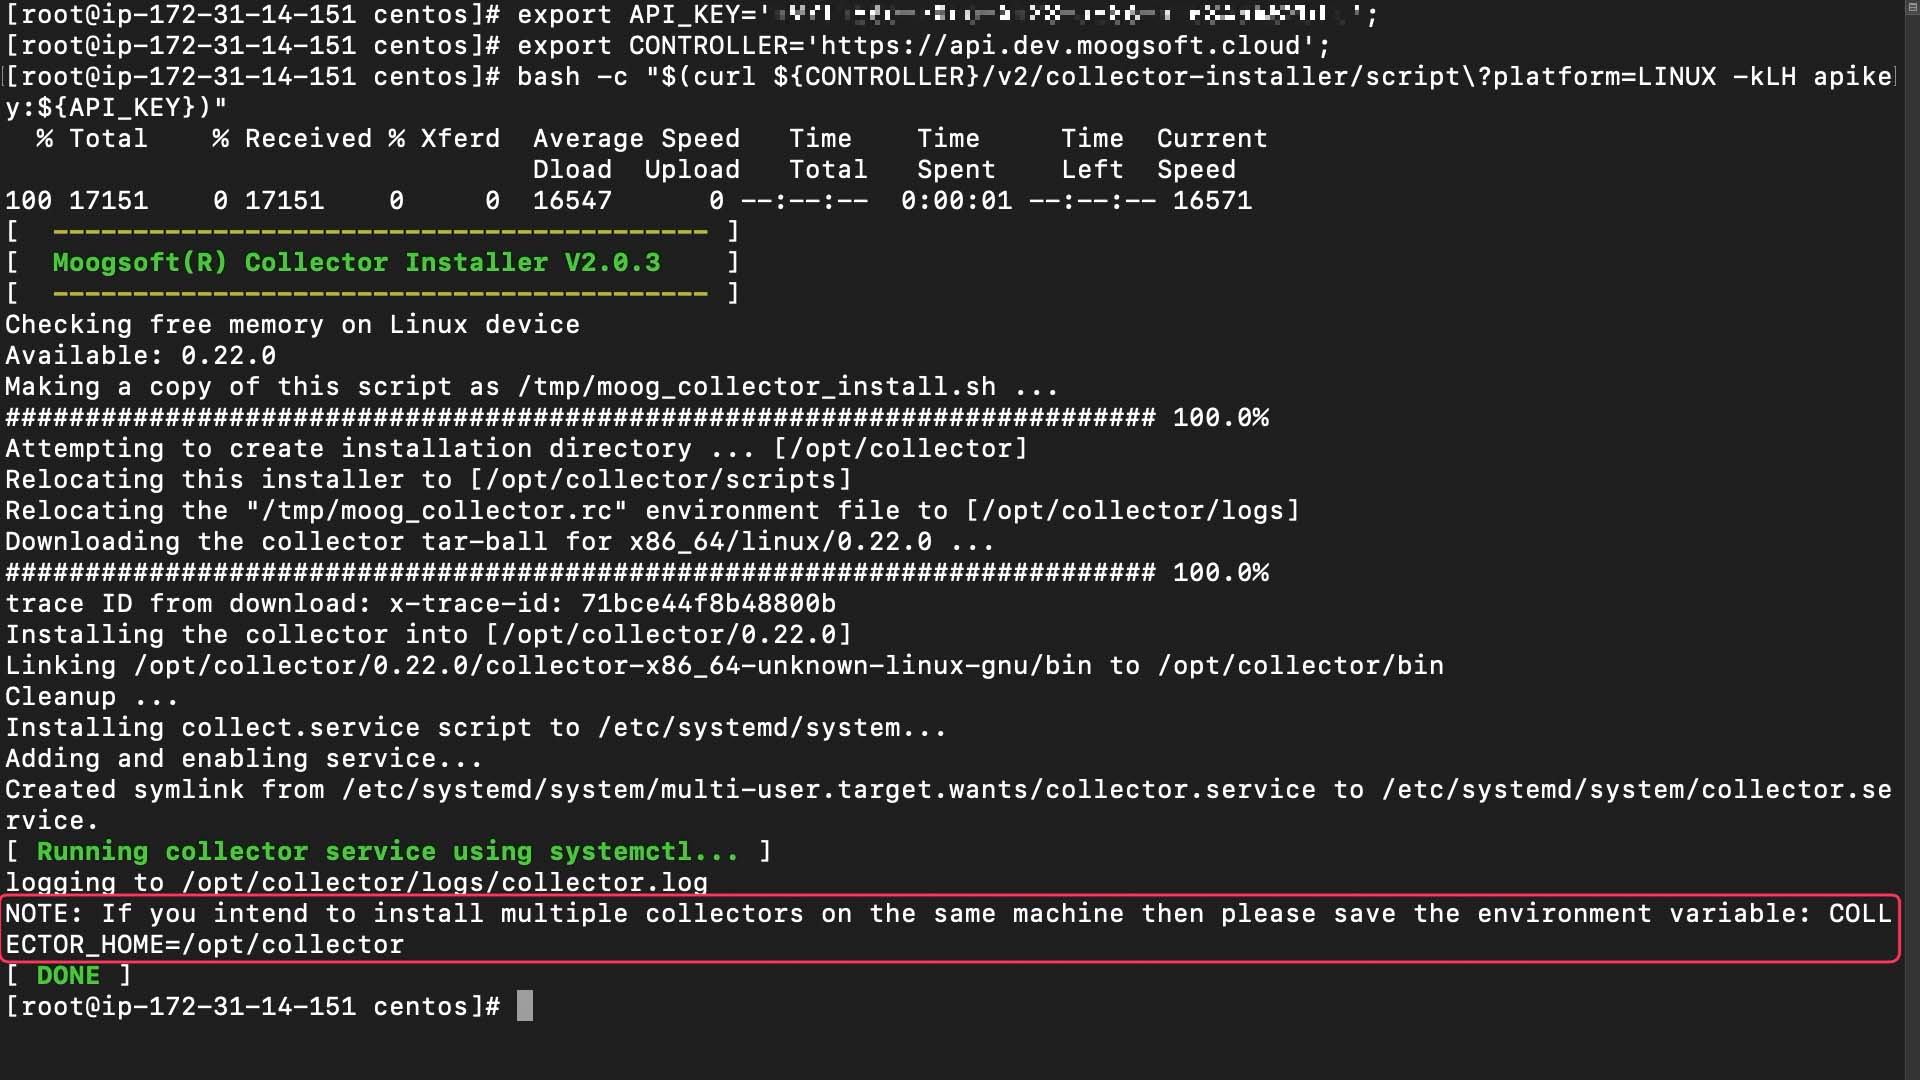
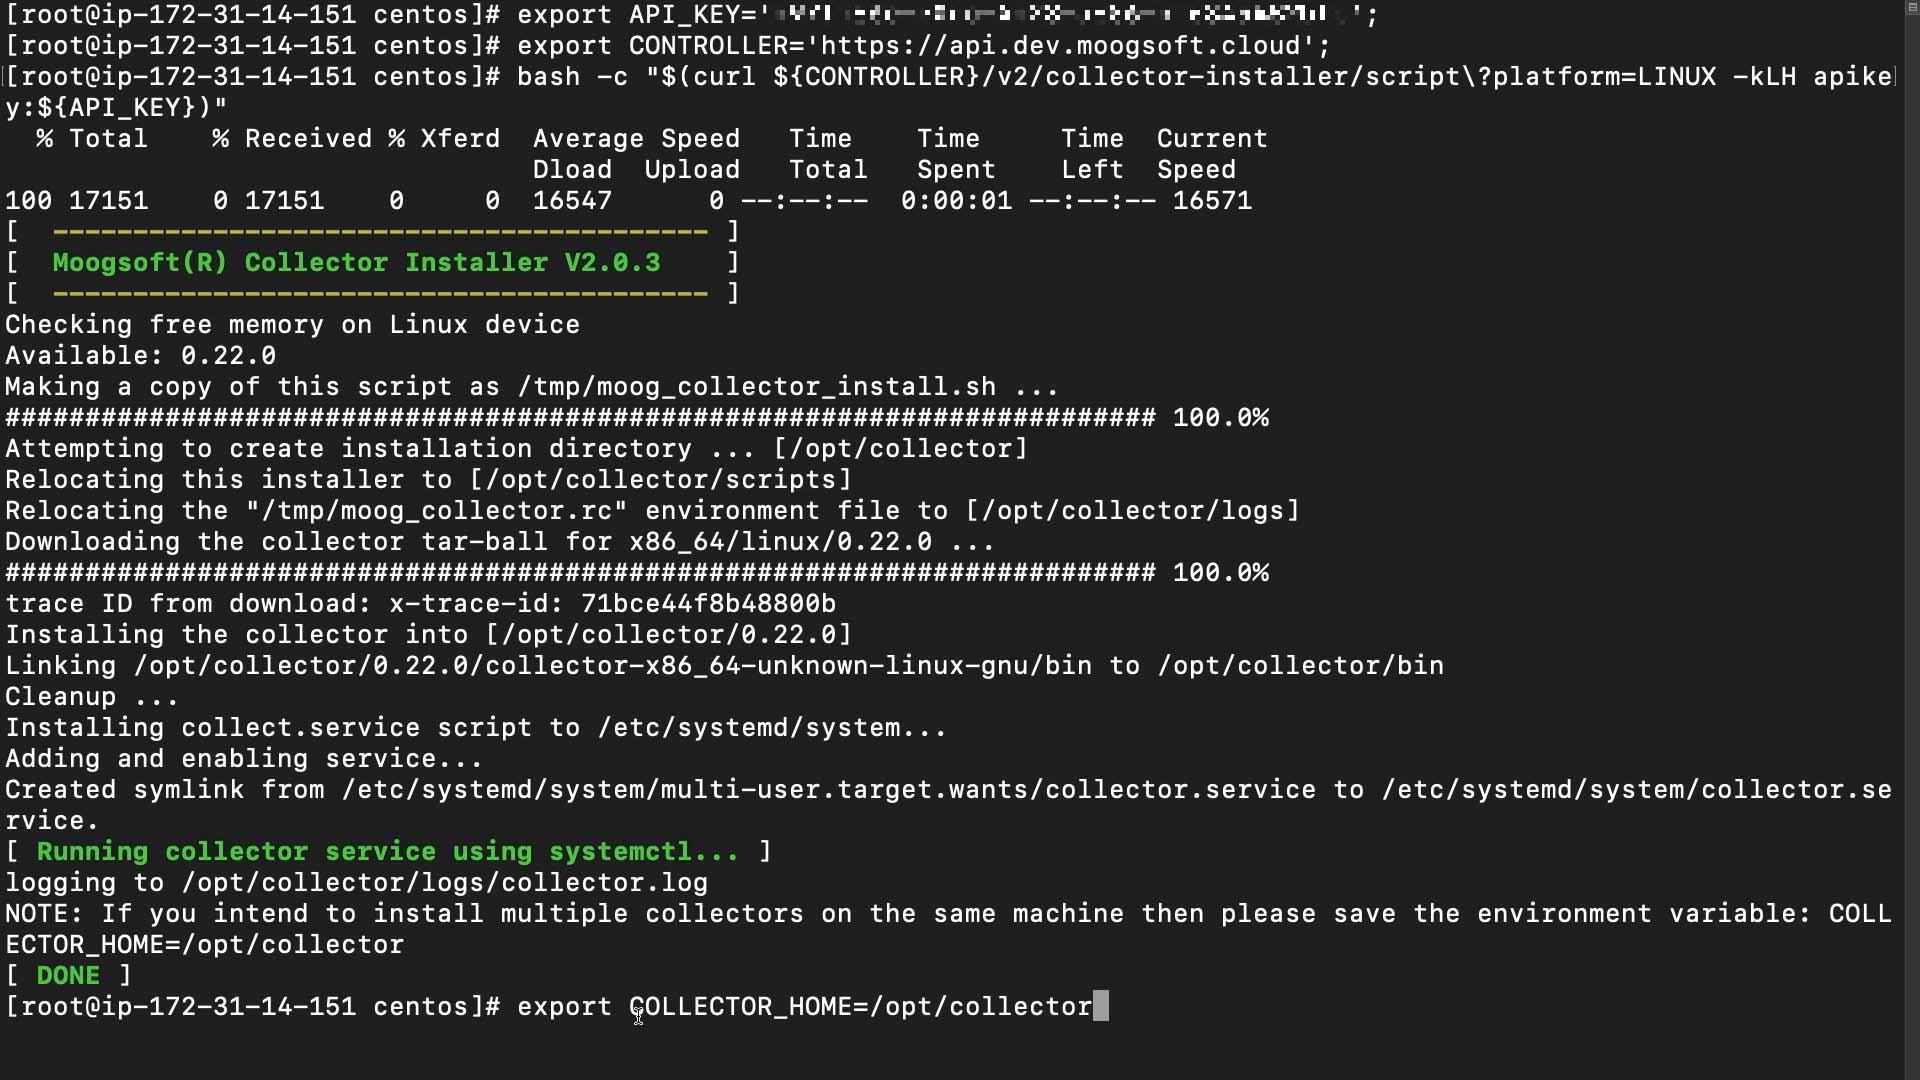
Saving this is not a requirement. But if you want to start, stop, and reload the collector later, either put this variable in one of your Linux startup config files, or export it like this.
Here’s the collector we just installed.
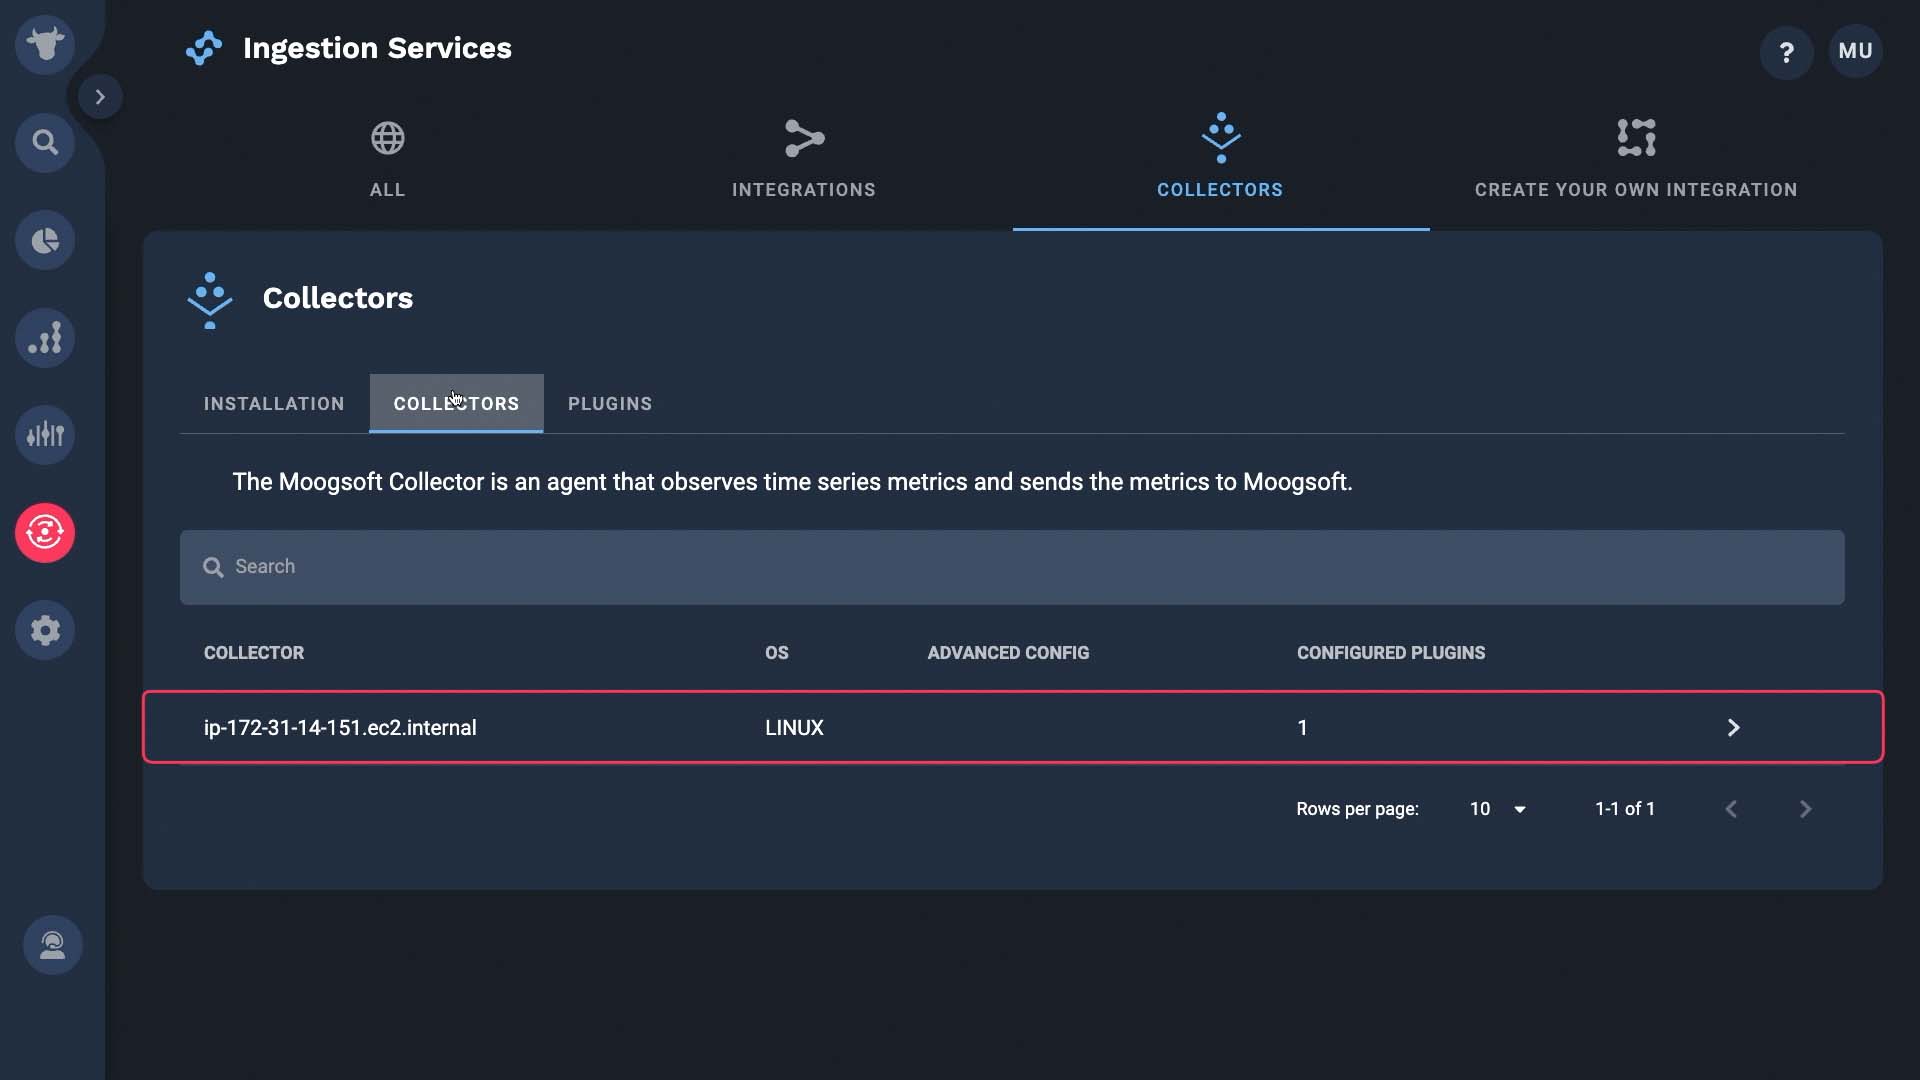
By default only the System plugin is enabled.
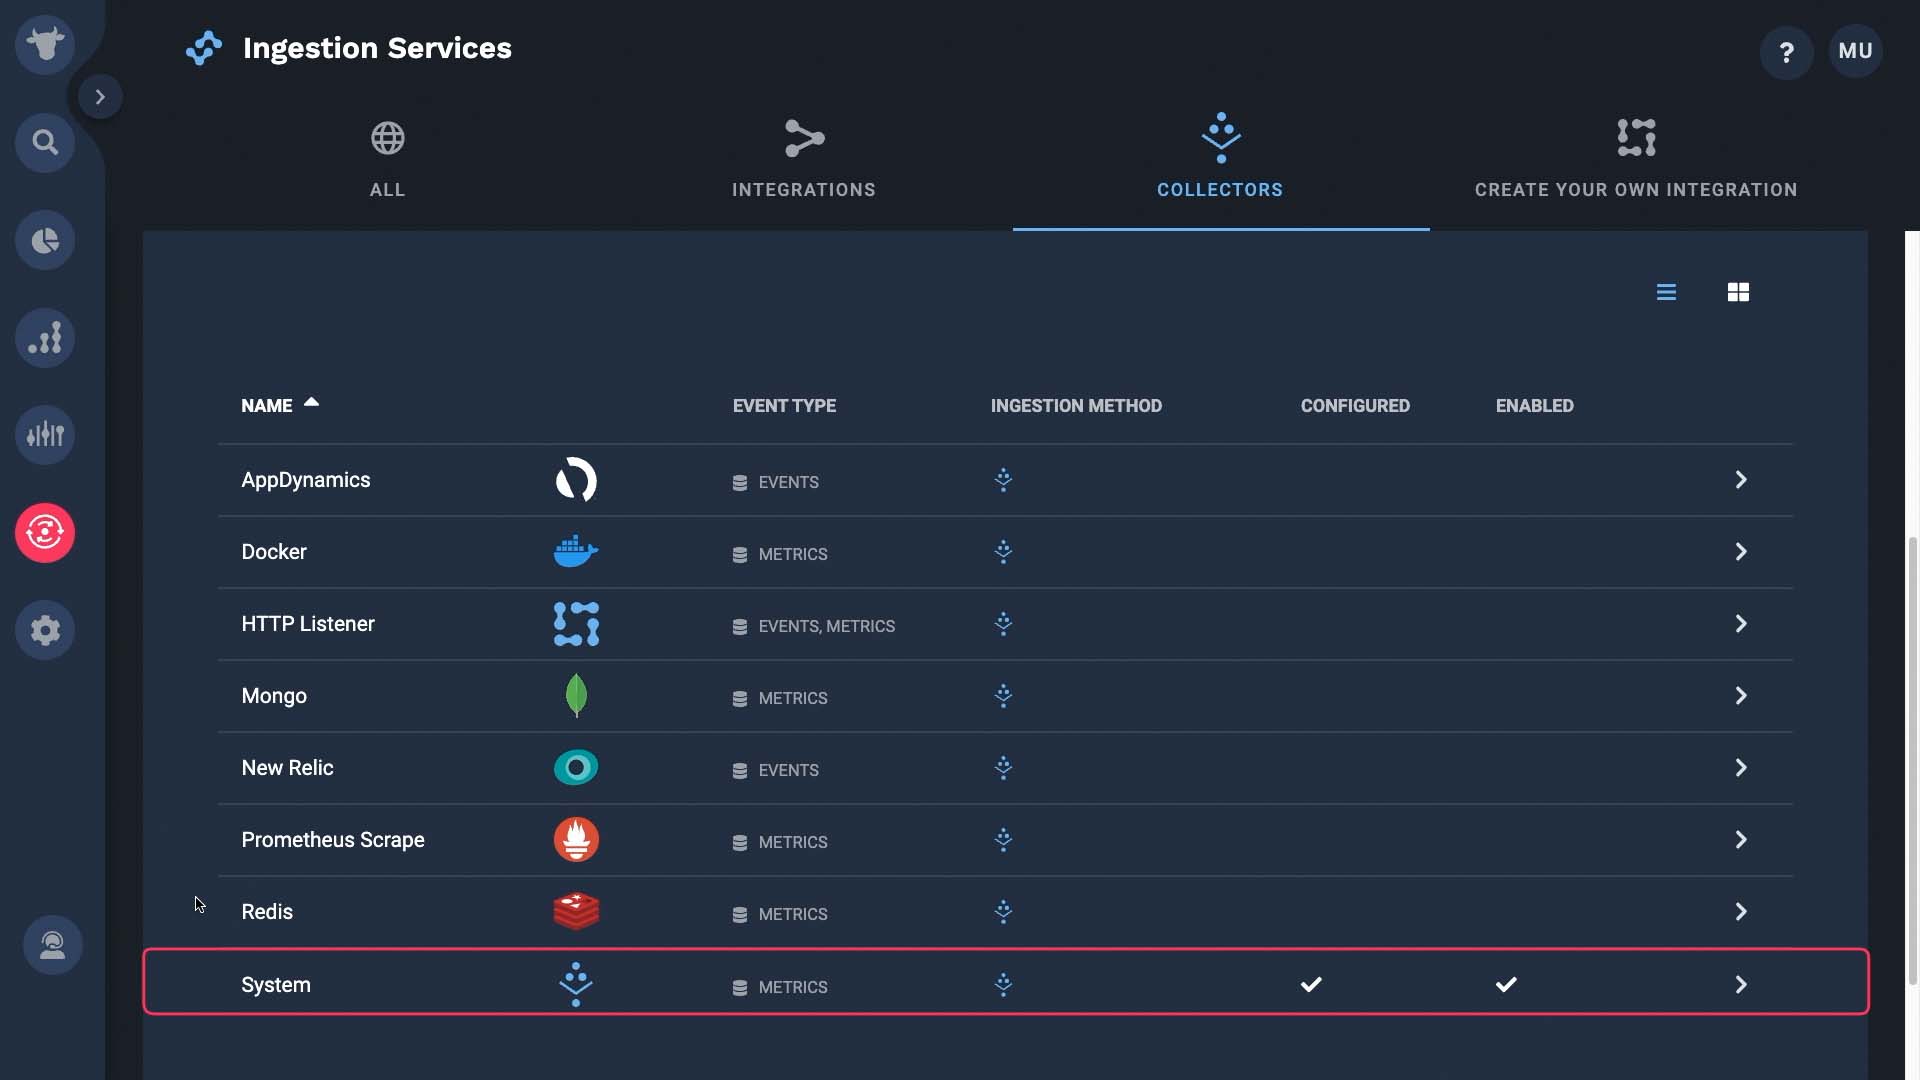
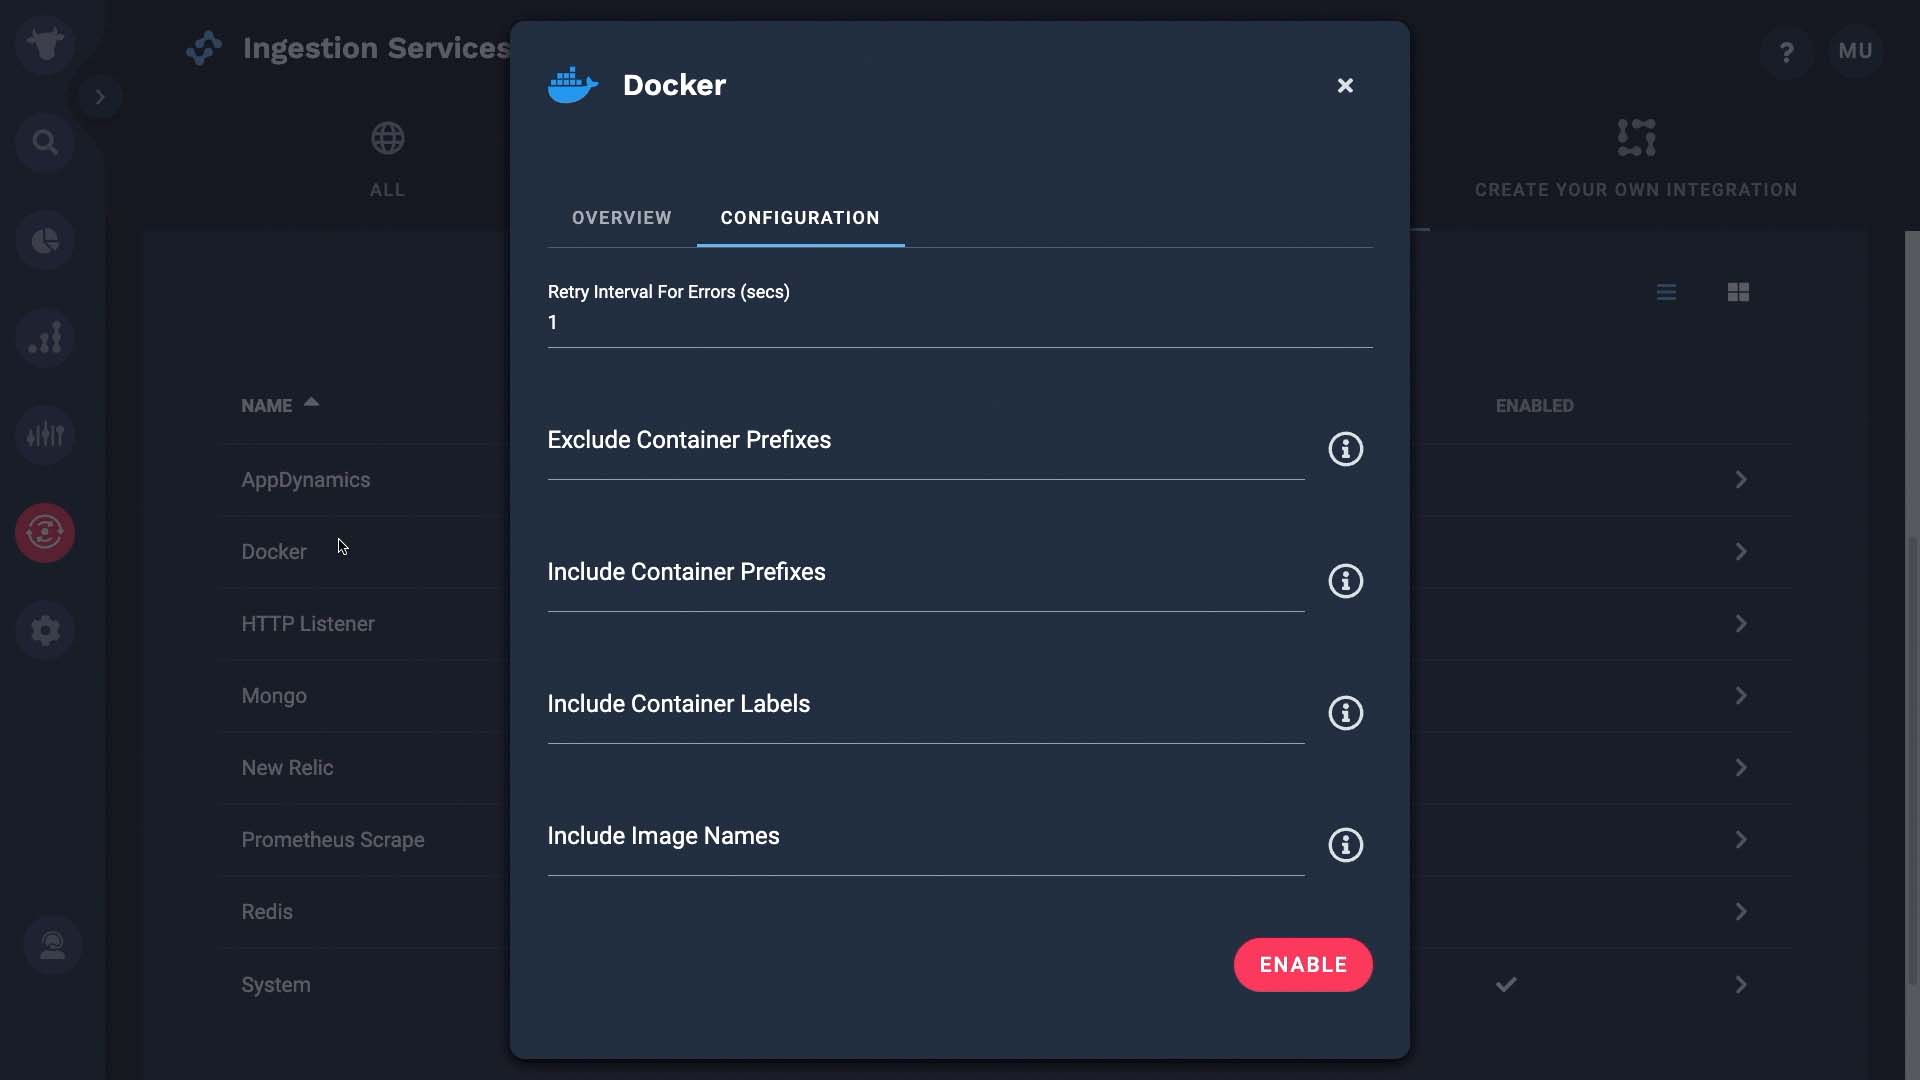
Let’s enable the Docker plugin. You can apply a filter to exclude certain container ID prefixes if you want.
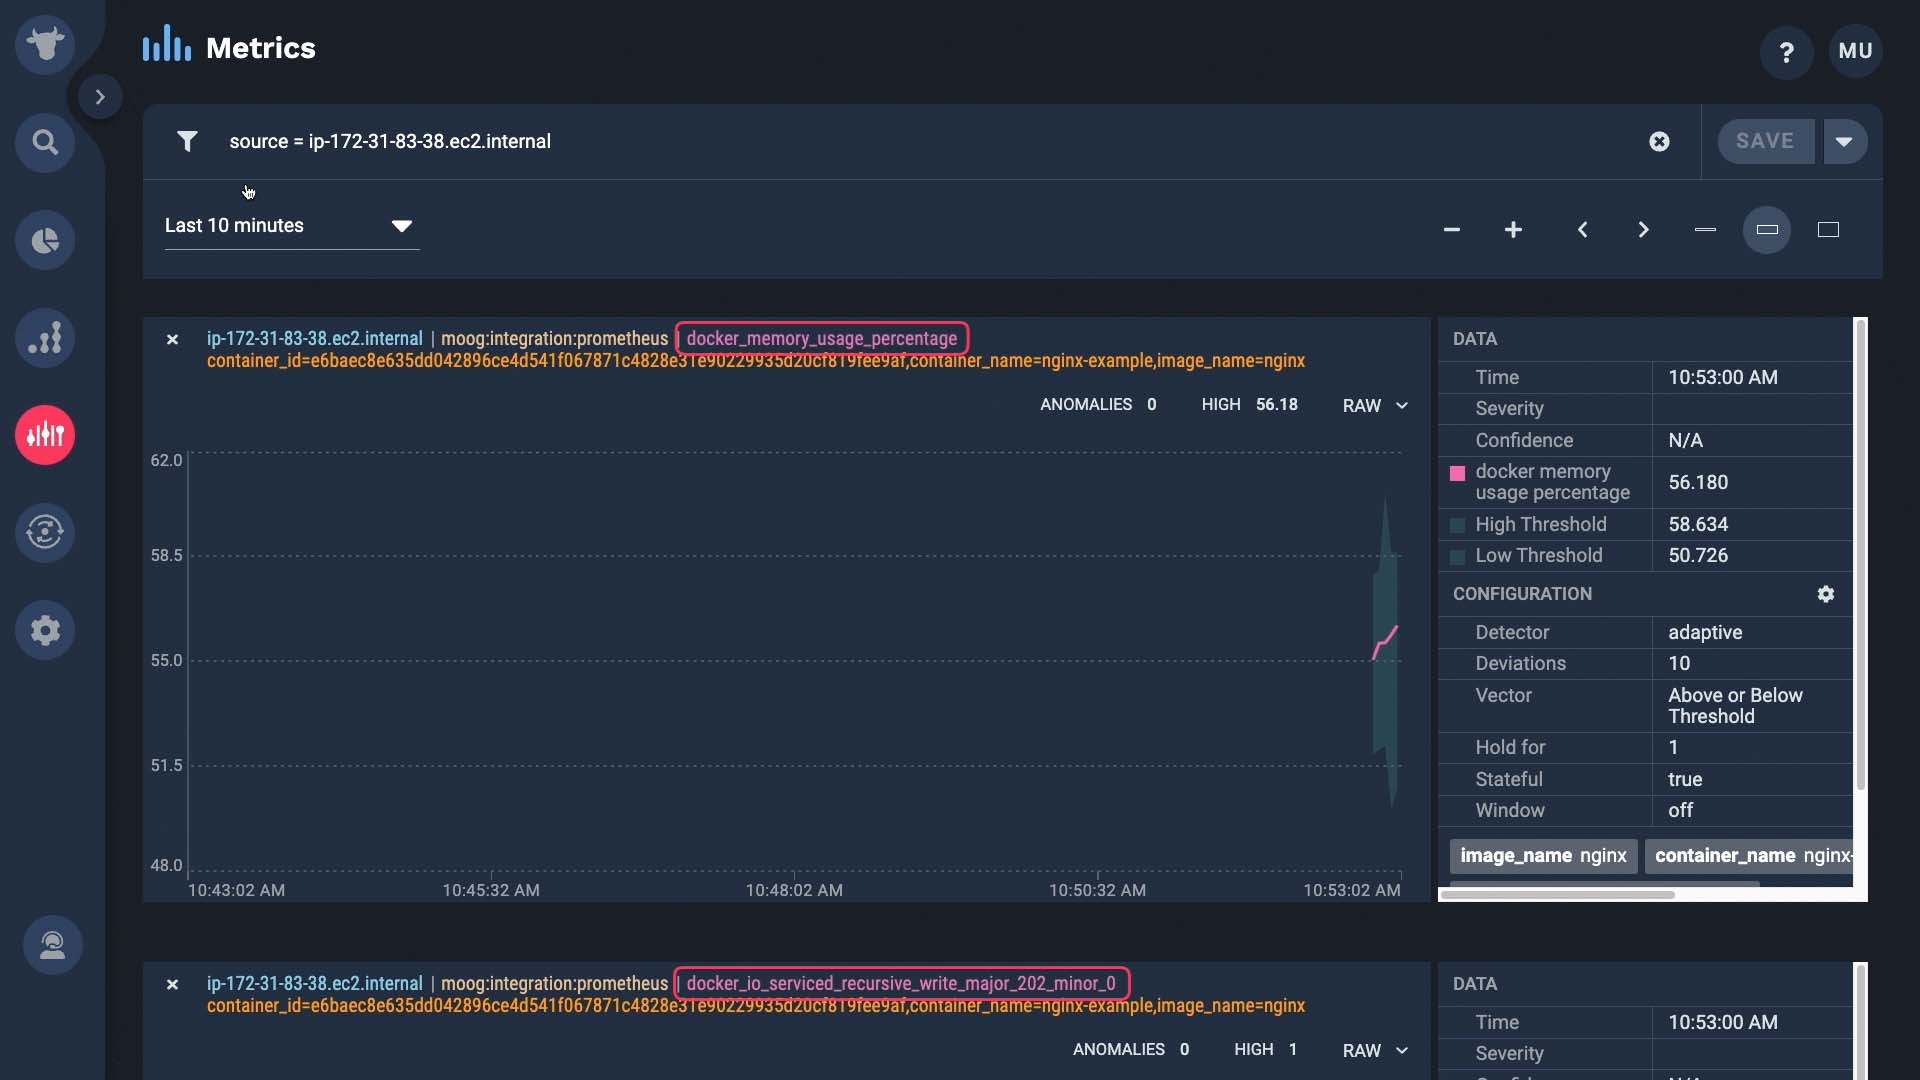
And now we enabled the Docker plugin. Let’s check if the metrics are flowing in. A wide variety of metrics are available. These came from the docker plugin we just enabled,,and they include container, memory cpu, network, and block IO stats.
These came from the system plugin that was enabled by default.
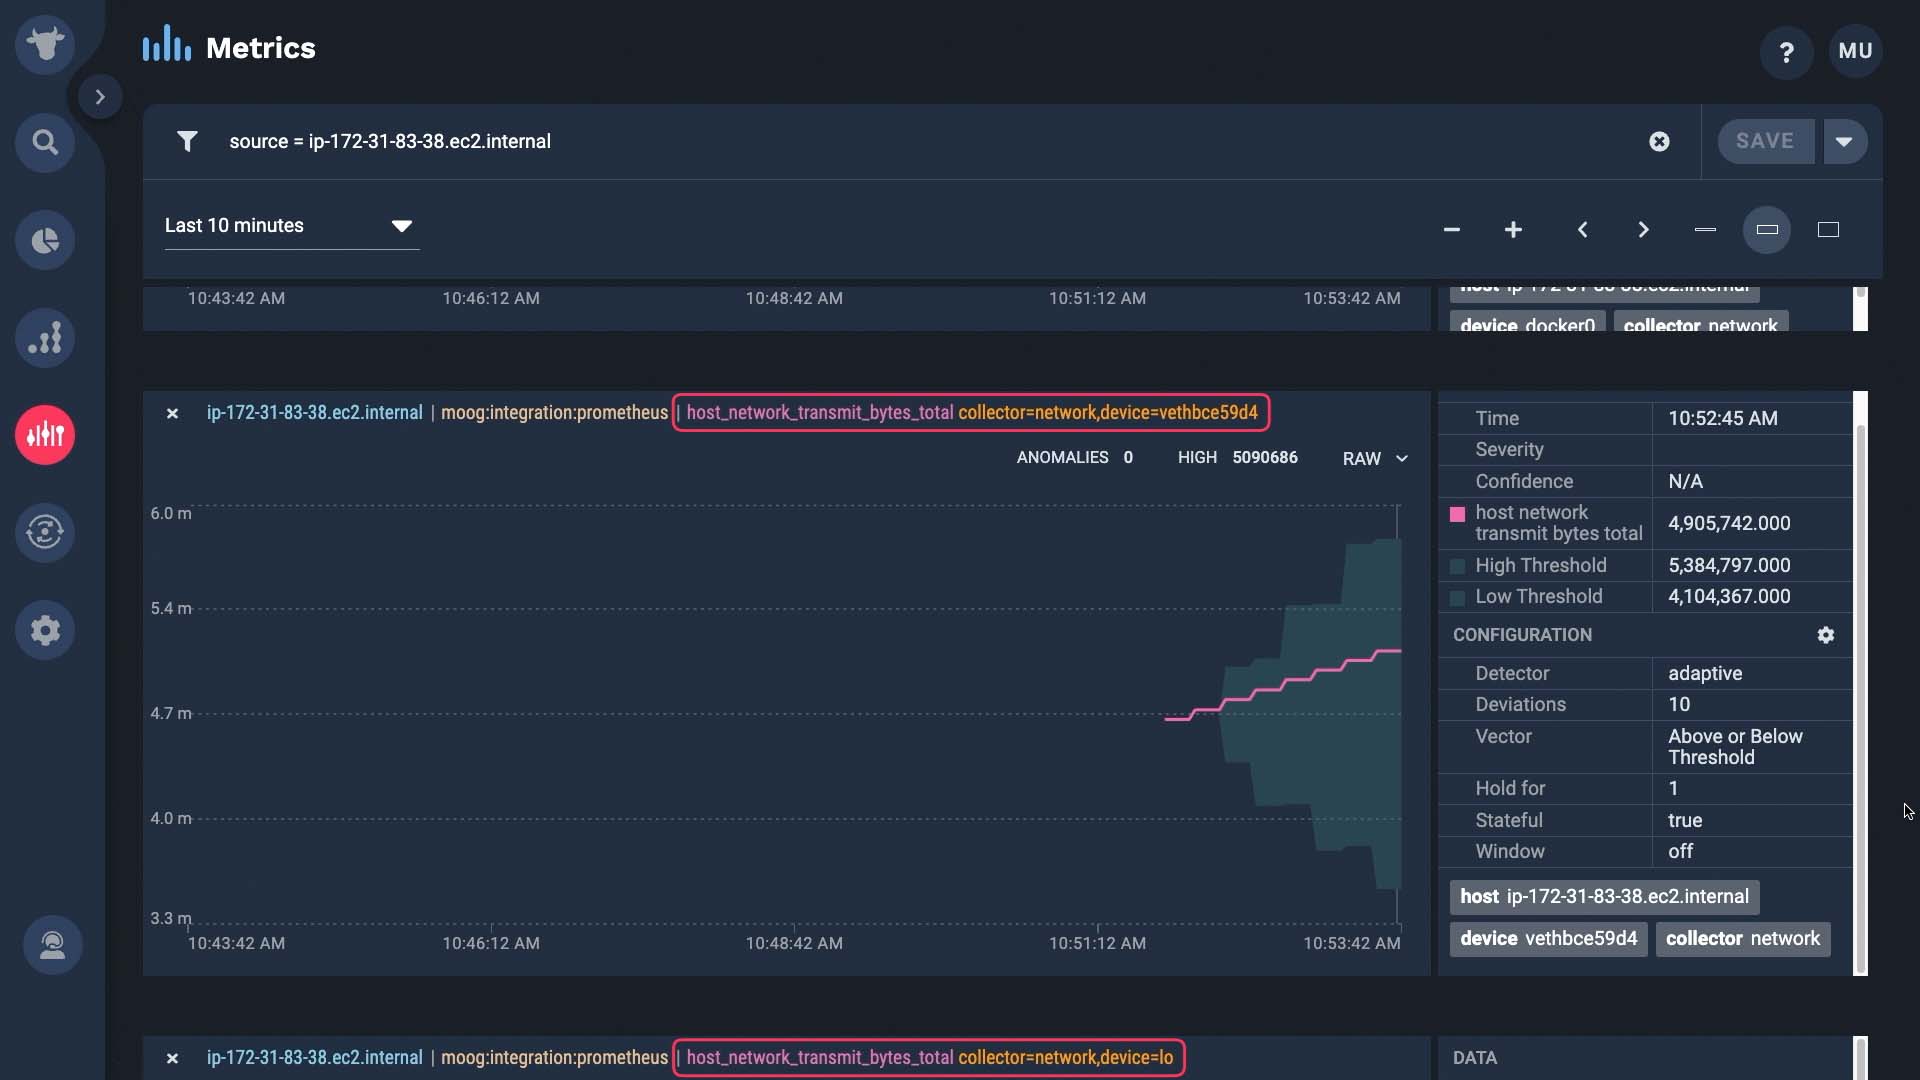
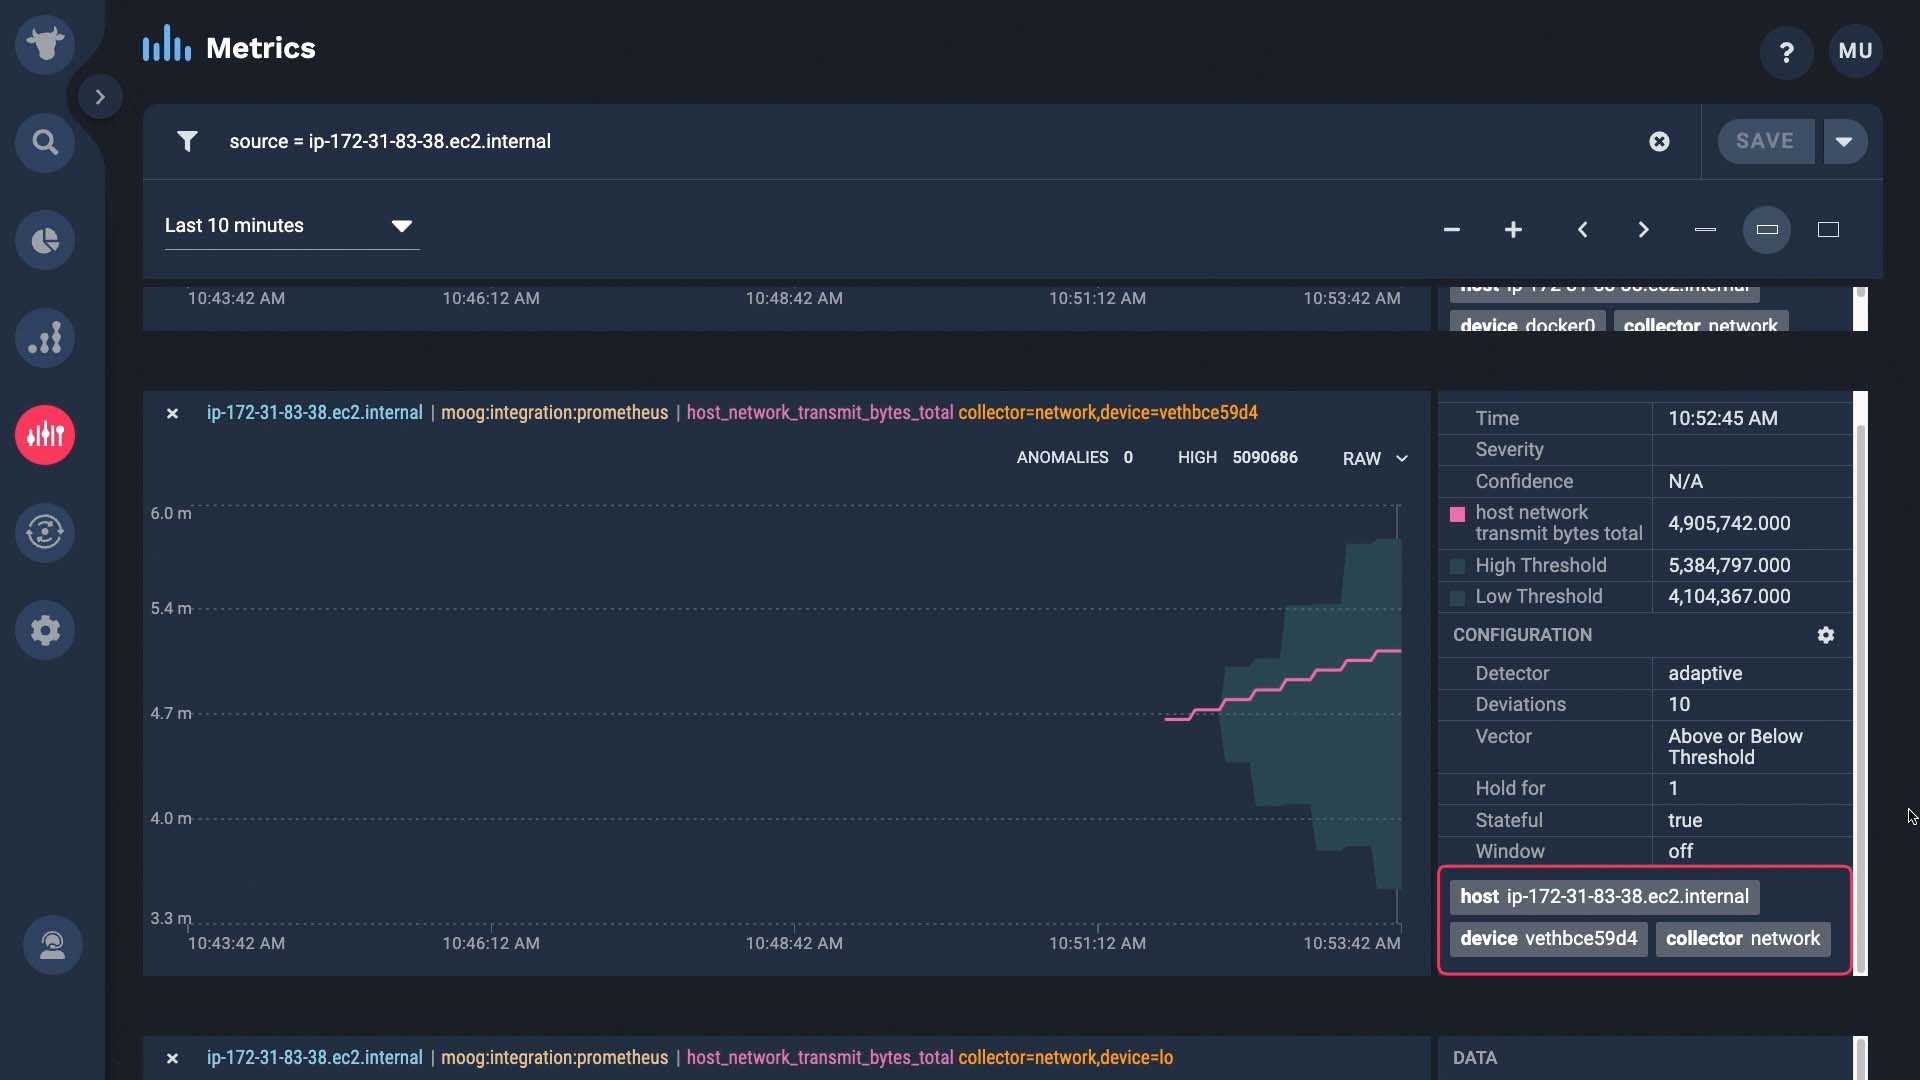
Each of these metrics come with a variety of useful tags that you can use for troubleshooting or correlating alerts when something happens.
Now you know how to install a collector. Thanks for watching!
BASIC | 4 MIN
This video demonstrates how to integrate AWS CloudWatch with Moogsoft.
Documentation is available.
Demo video: Integrate with Amazon CloudWatch ►
This video explains how to set up the Amazon CloudWatch integration in APEX AIOps Incident Management.
*Please note Moogsoft is now part of Dell's IT Operations solution called APEX AIOps, and changed its name to APEX AIOps Incident Management. The UI in this video may differ slightly but the content covered is still relevant.
In this video, we will go over how to integrate Amazon CloudWatch and send the data to Incident Management.
The instruction documentation is conveniently located right here.
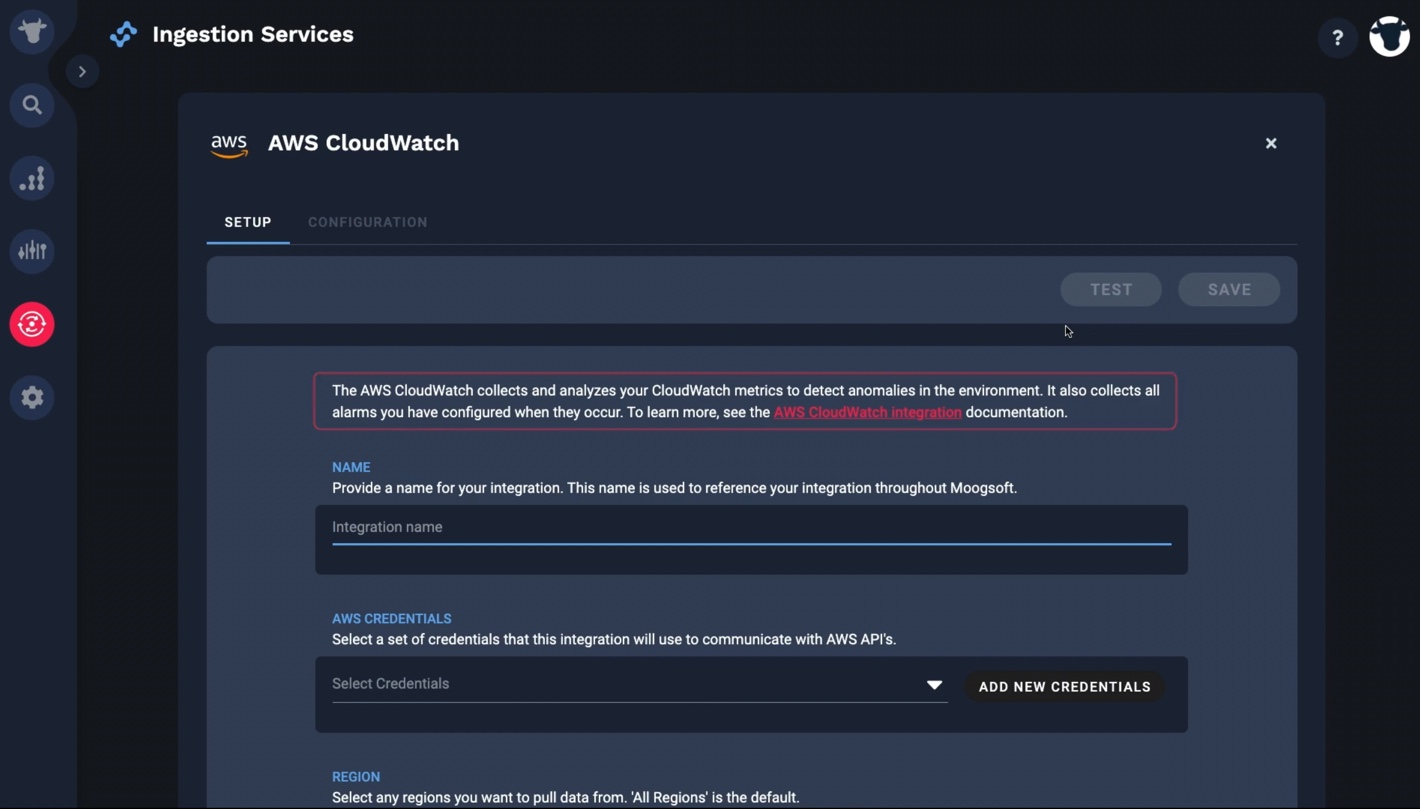
We are going to add our AWS credentials.
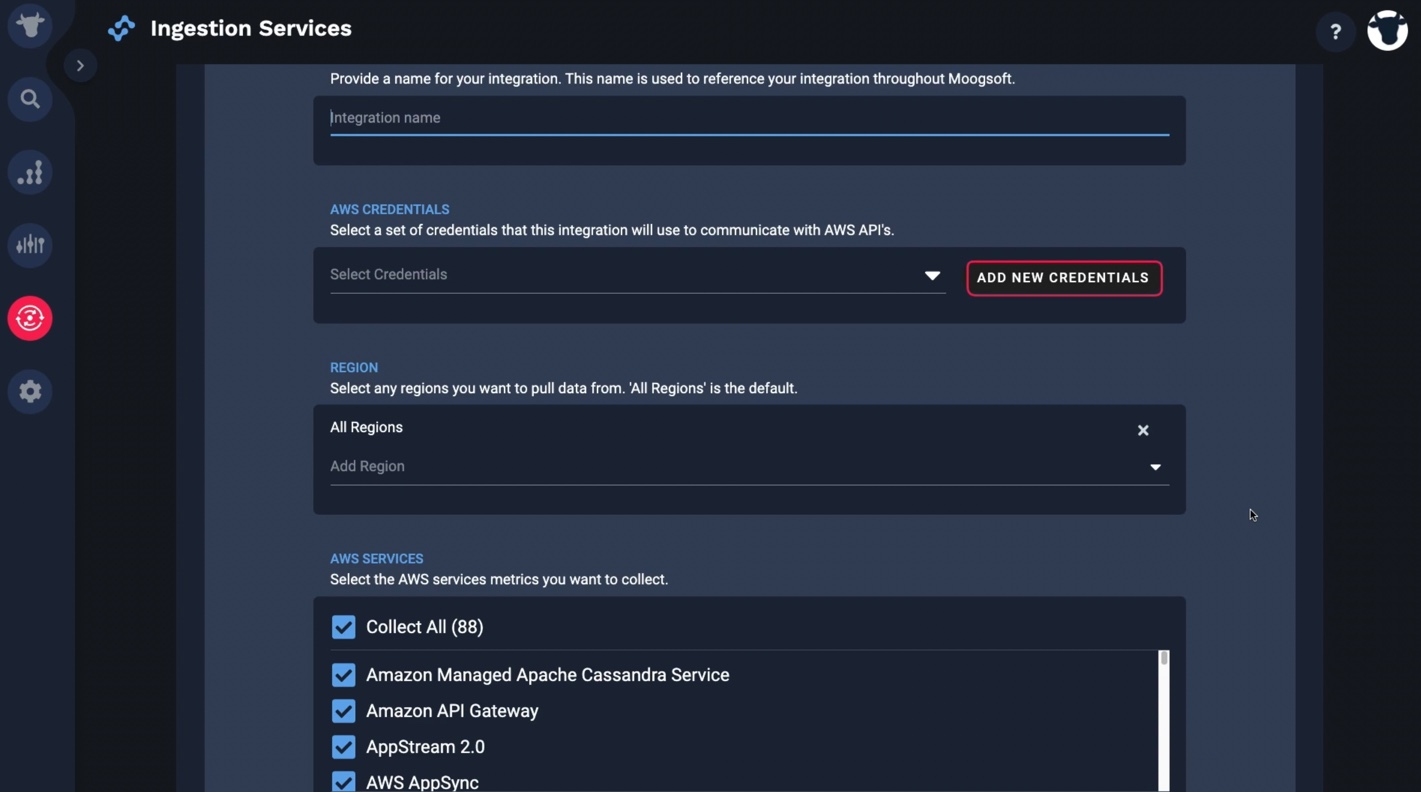
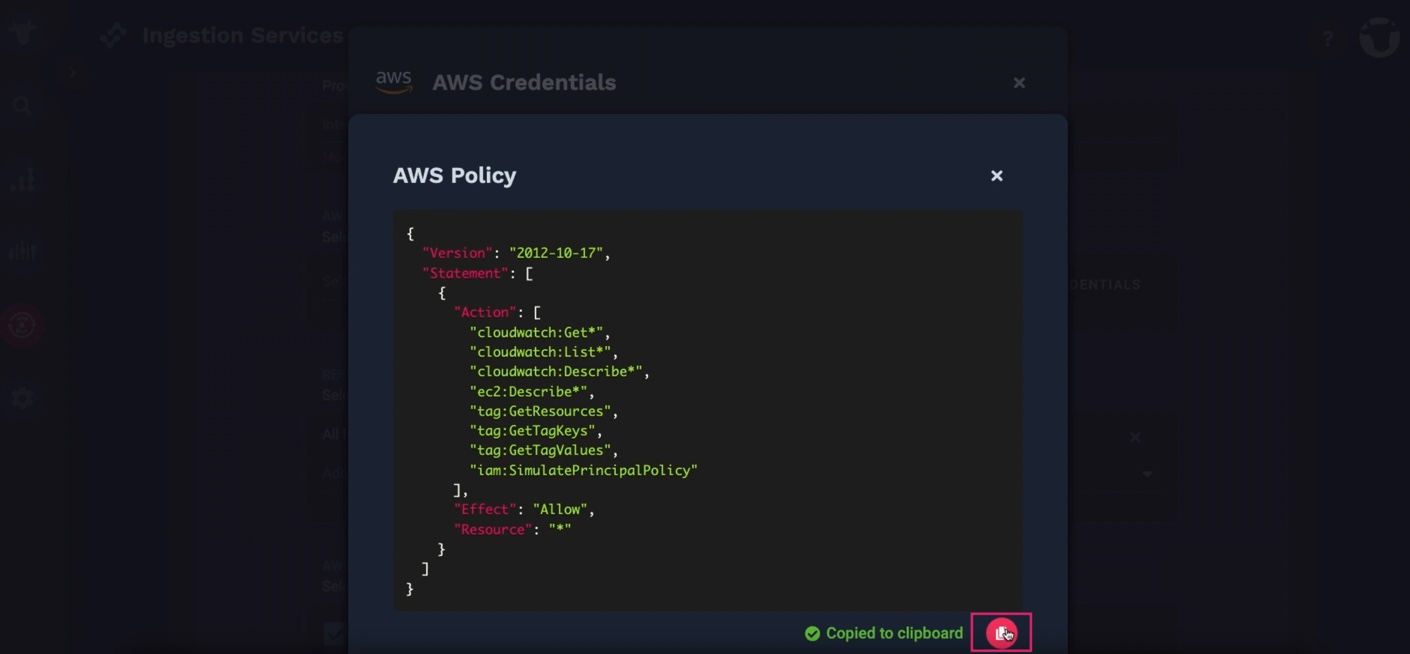
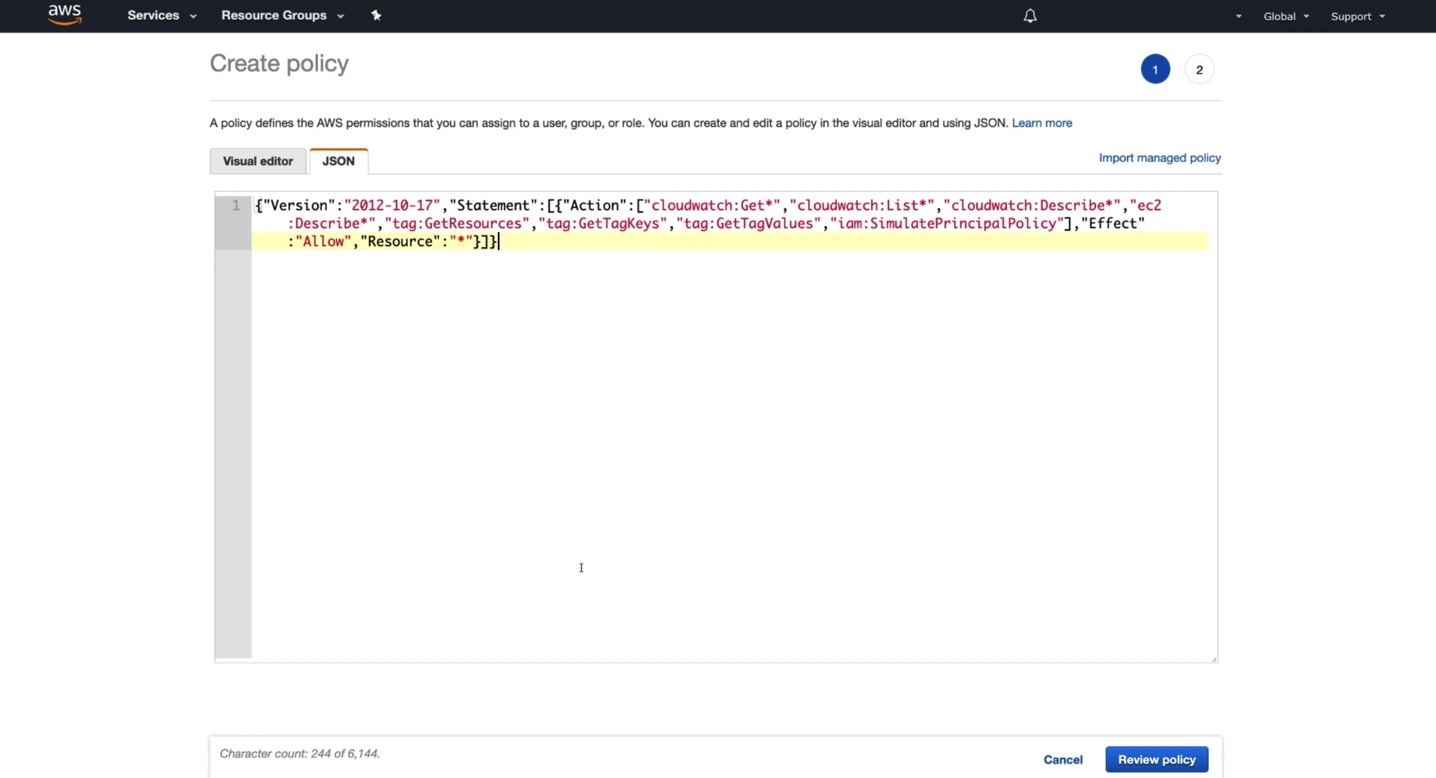
We need to create a policy and a role in AWS to complete the configuration. To do so, we need this JSON script from Incident Management.
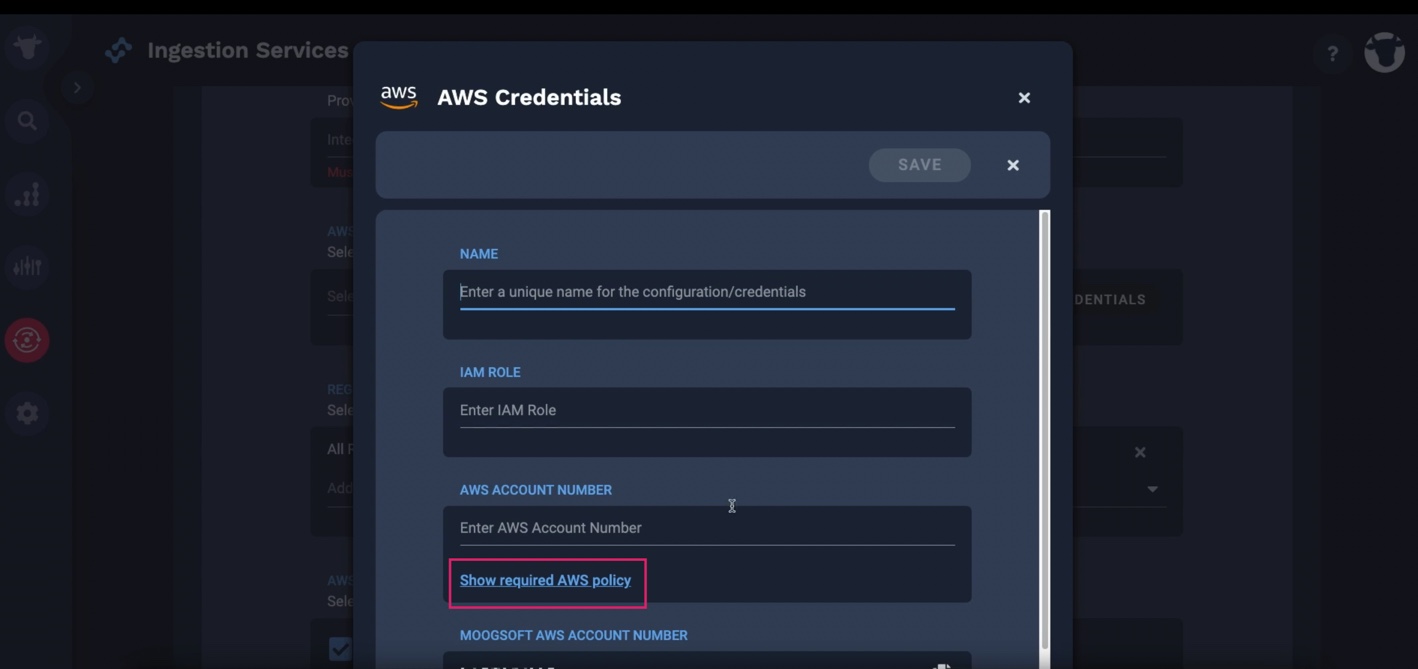
Grab this JSON script.
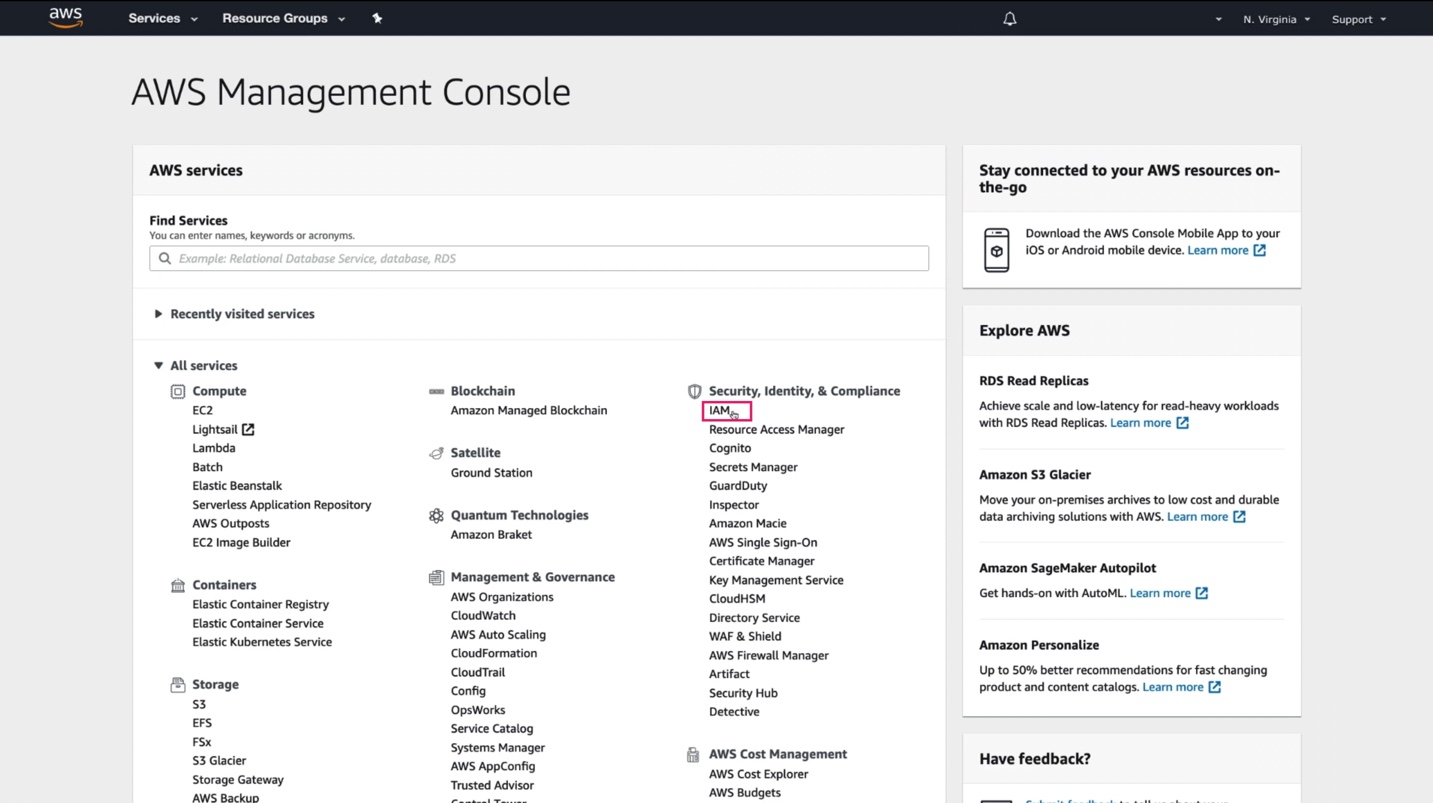
And now we are going to AWS.
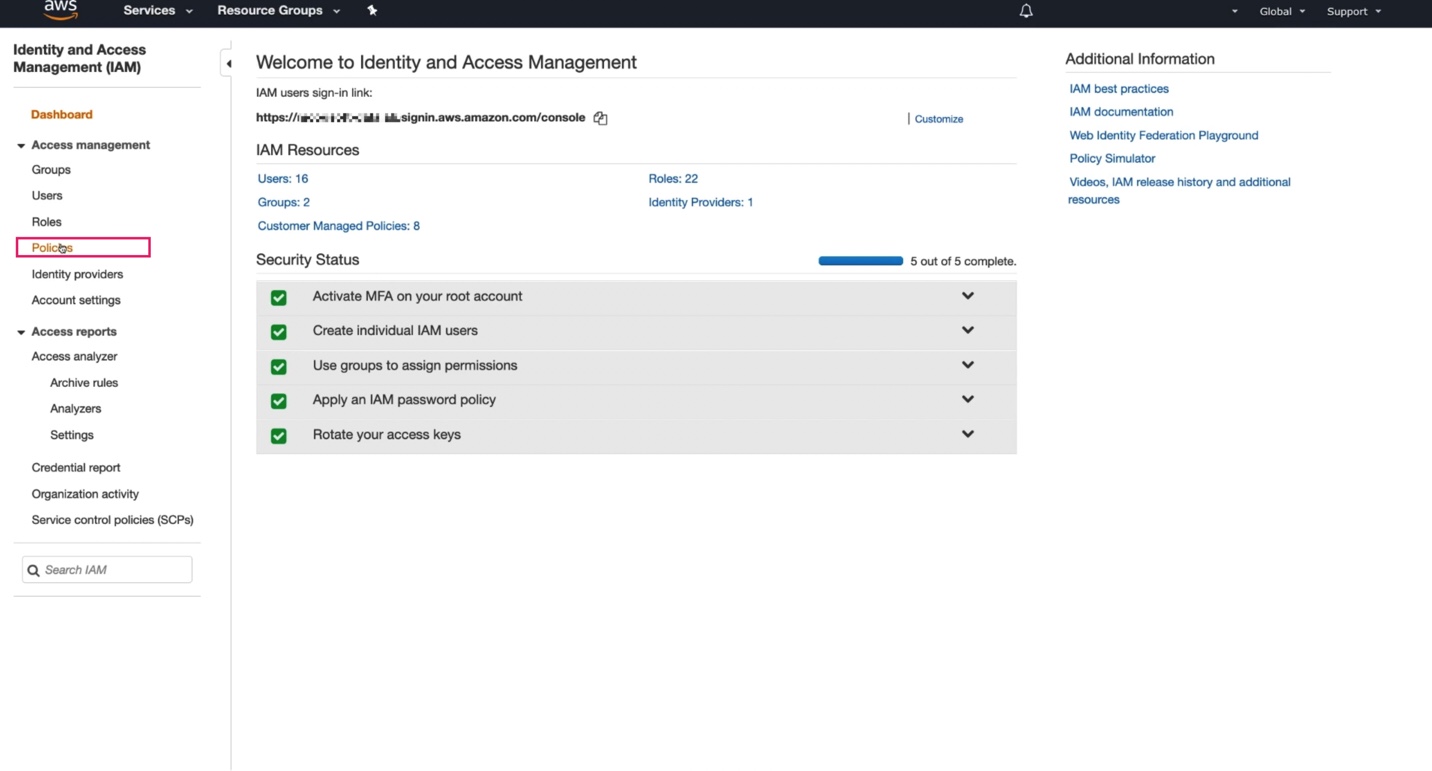
Navigate to the policy section.
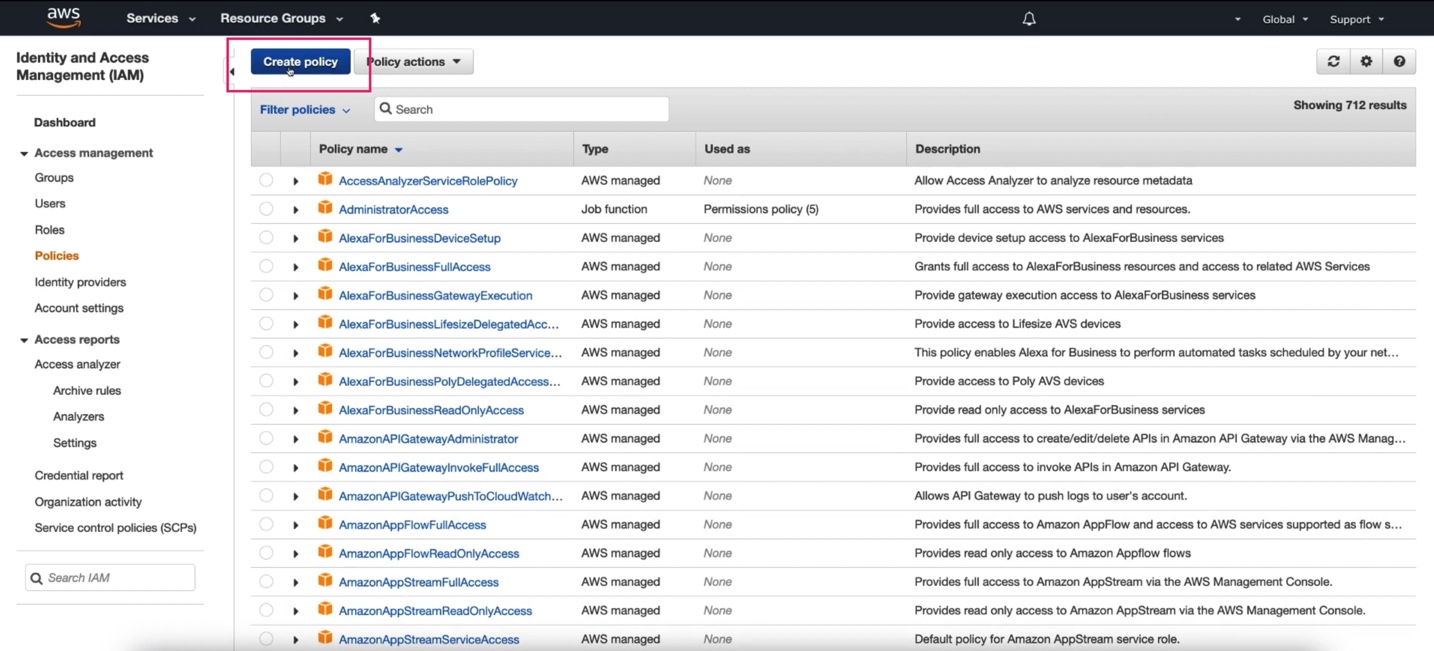
Paste the JSON script we grabbed from Incident Management...
...and provide a meaningful name.
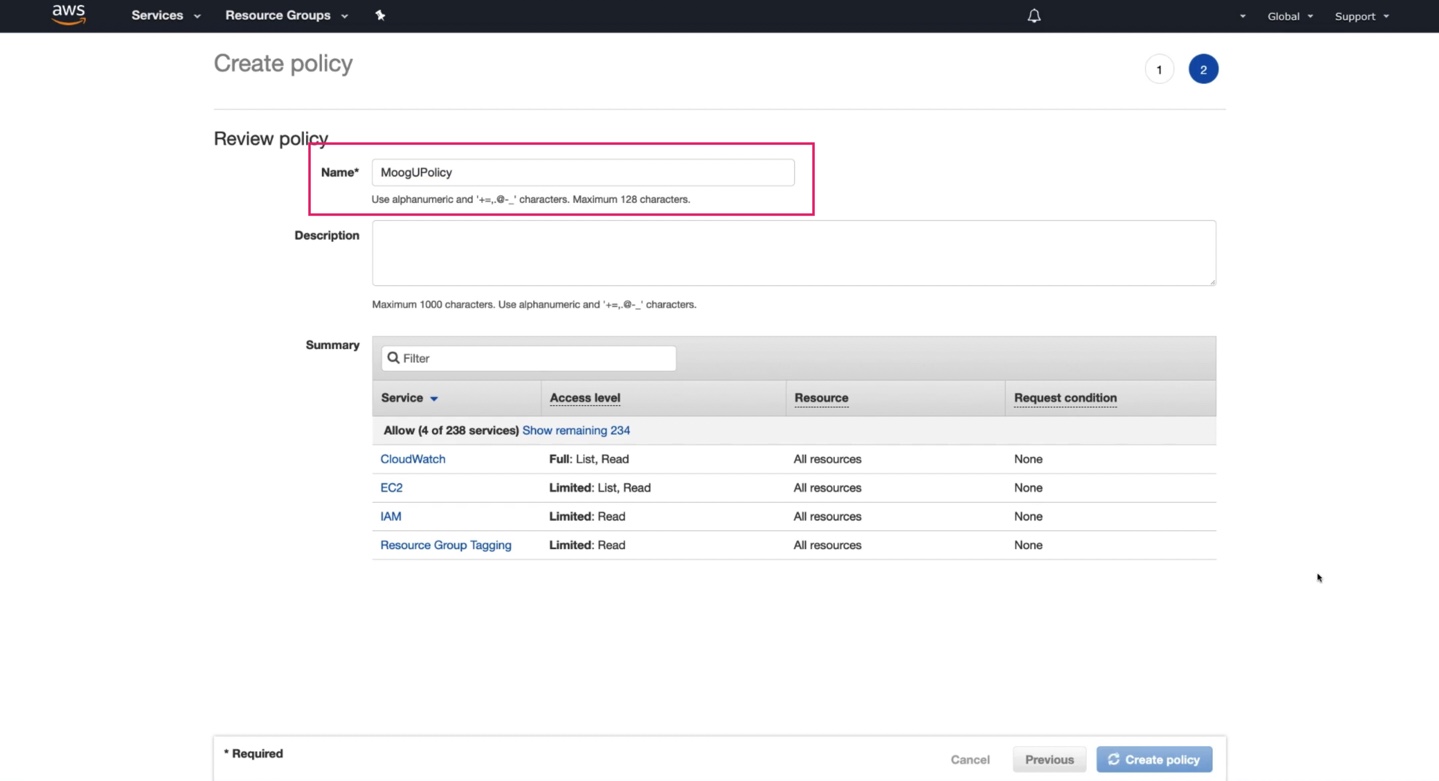
Now we got the policy. Let's create the role now.
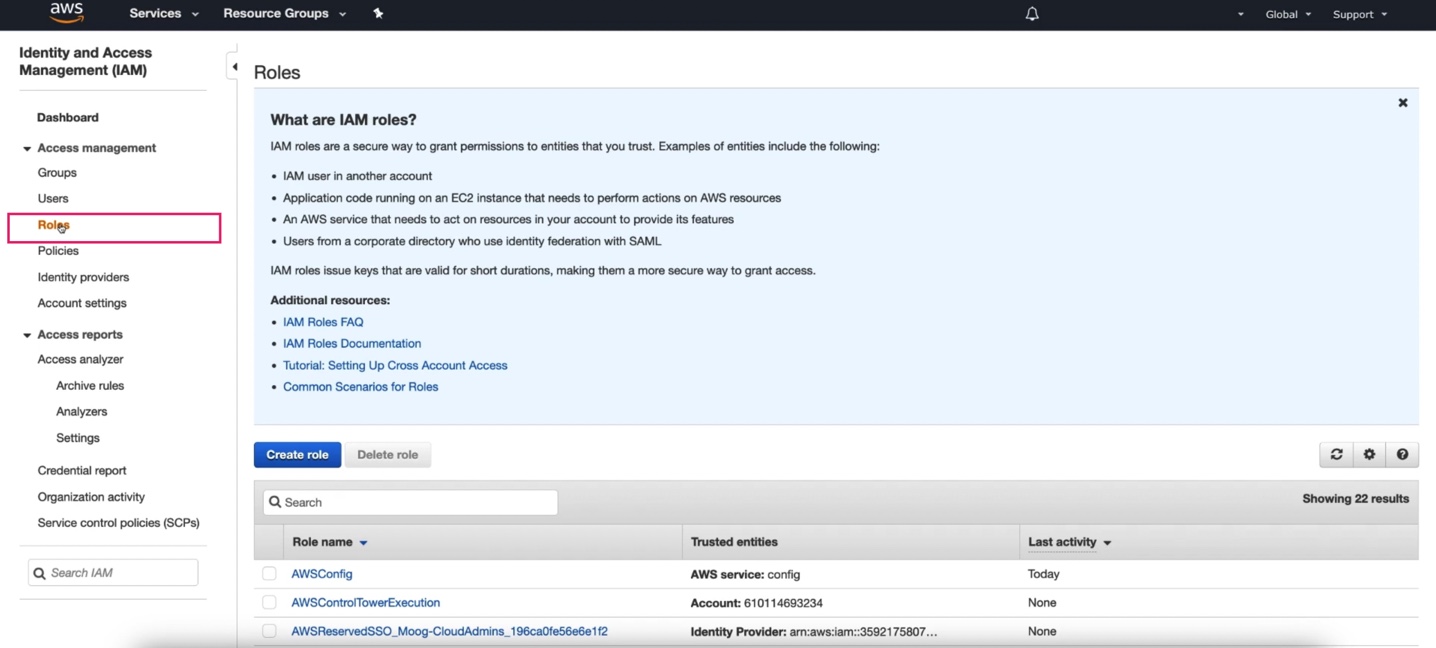
"Another AWS Account" is what we need here.
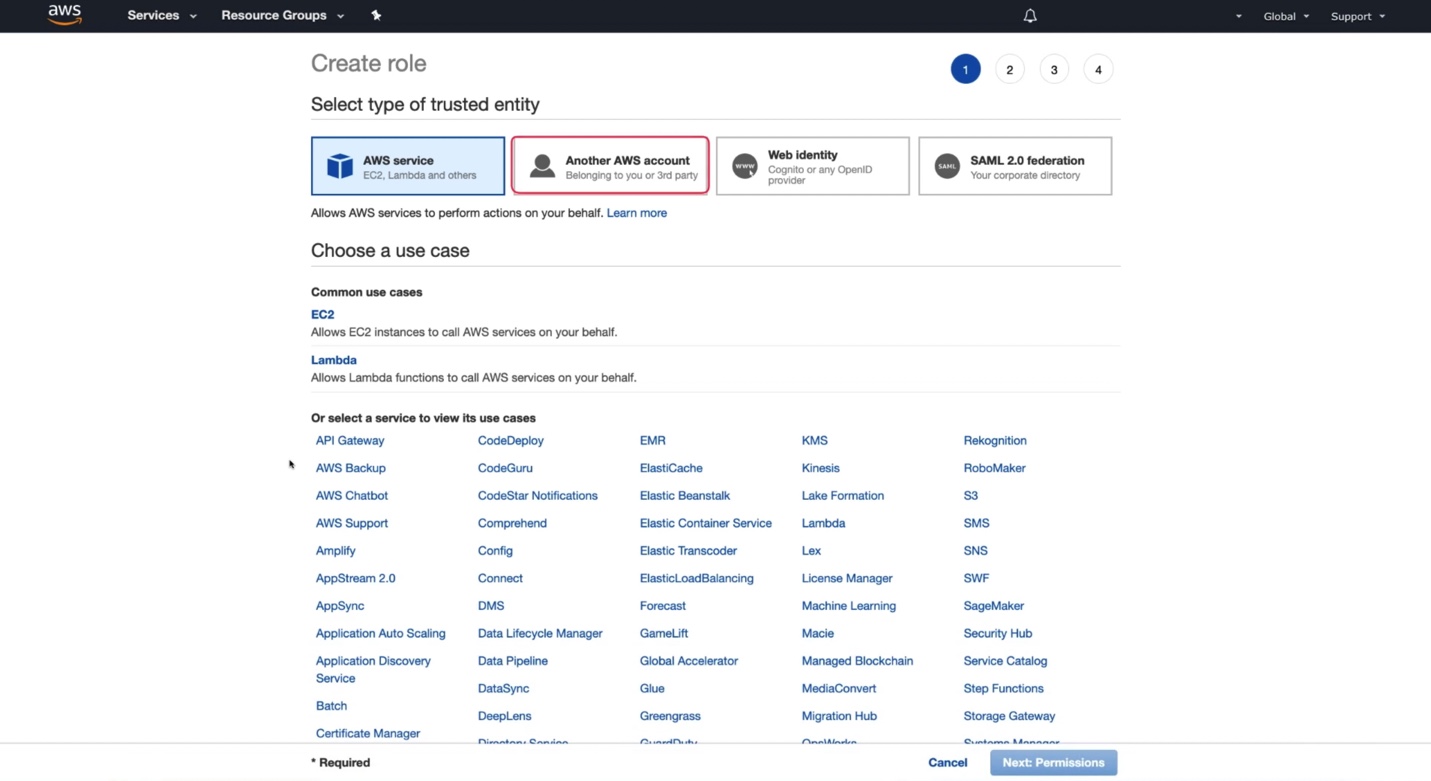
We need to provide the APEX AIOps Incident Management AWS account number here.
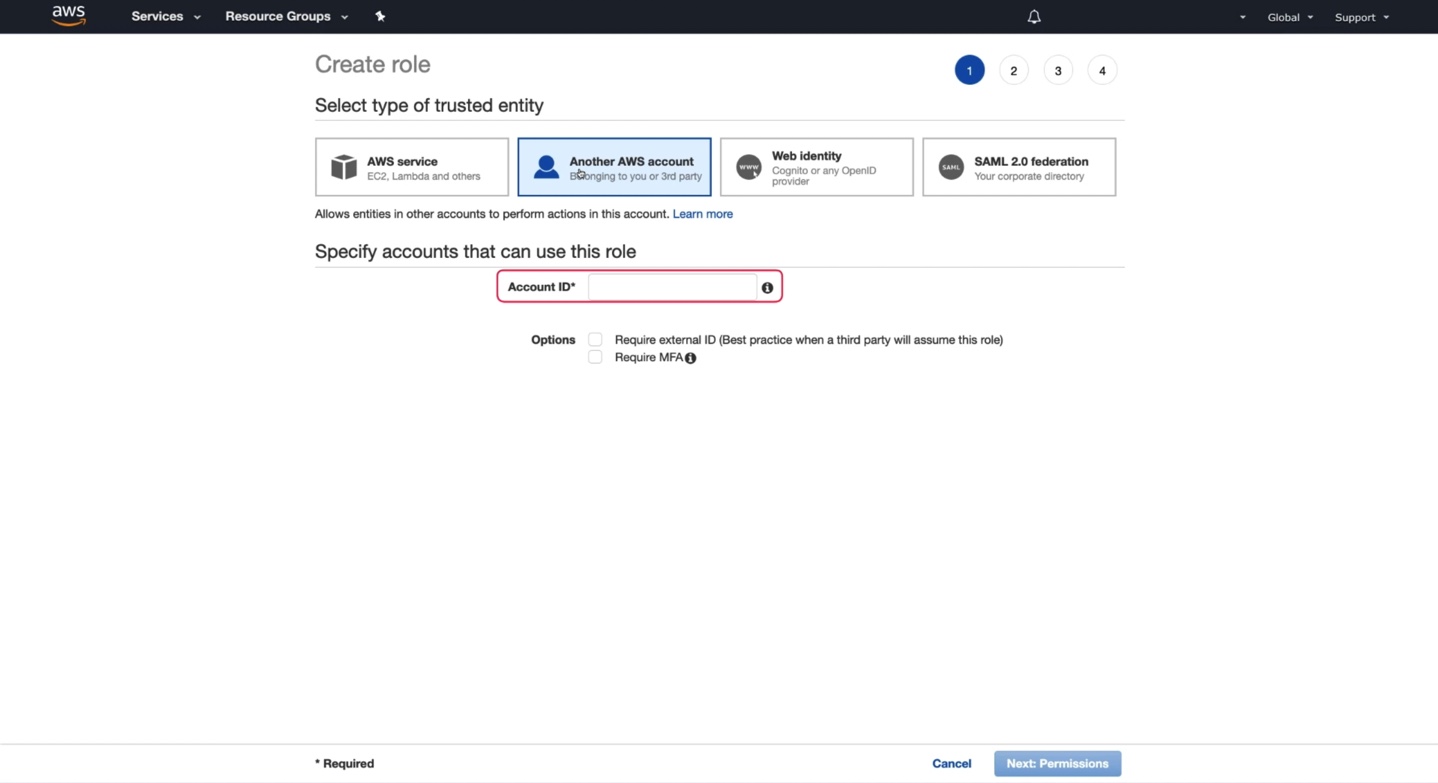
Let's go back to Incident Management. Copy this...
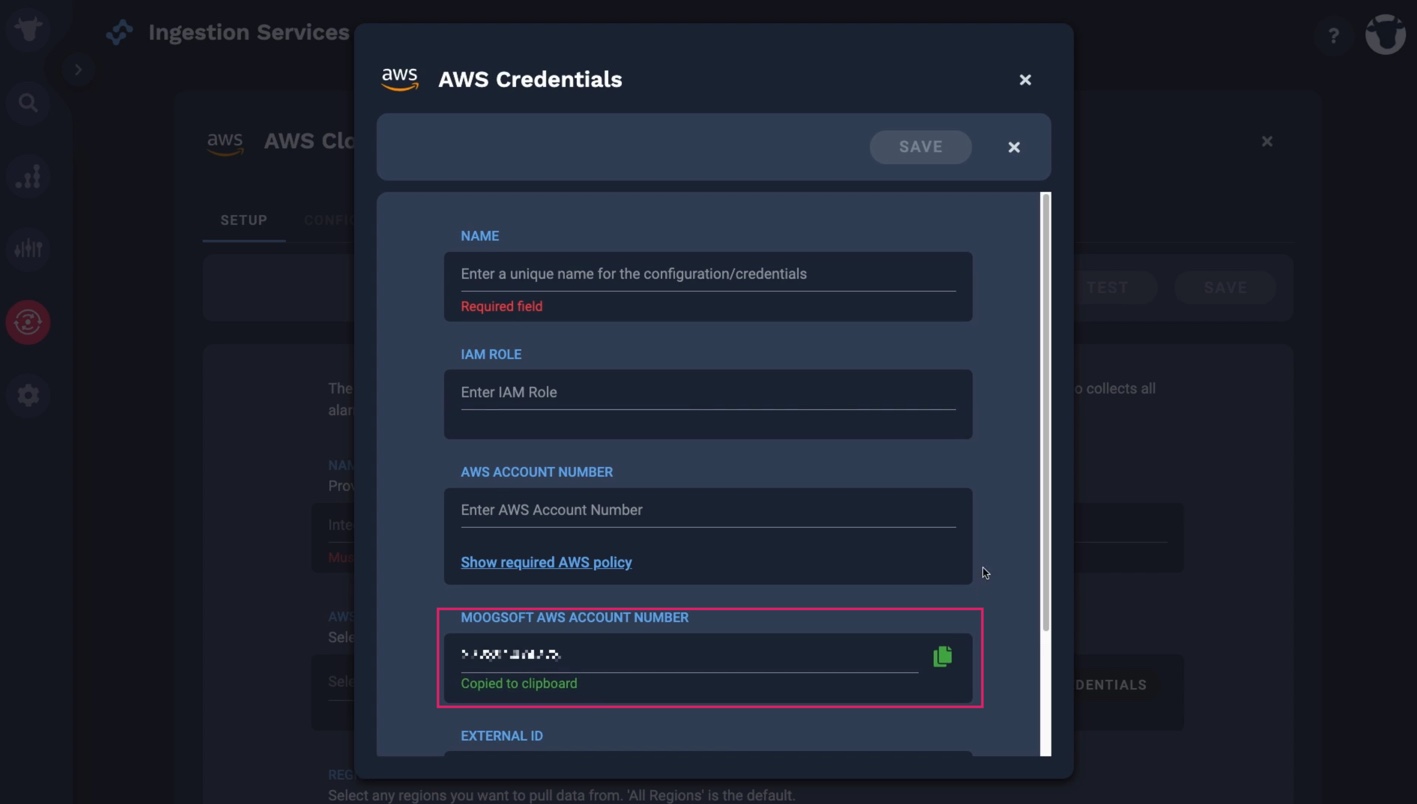
And paste it here.
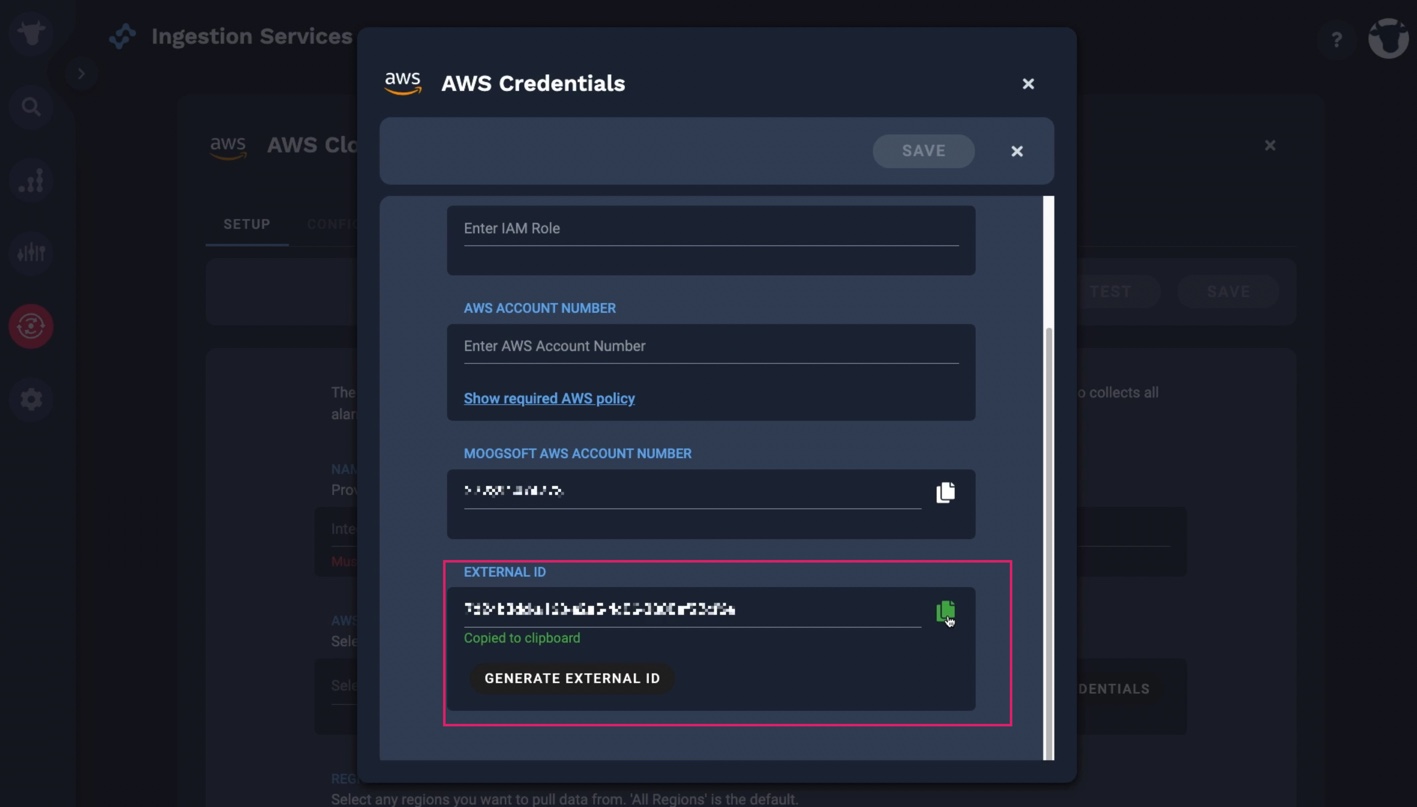
Next, check "Require External ID". We need to grab it from Incident Management. Here it is.
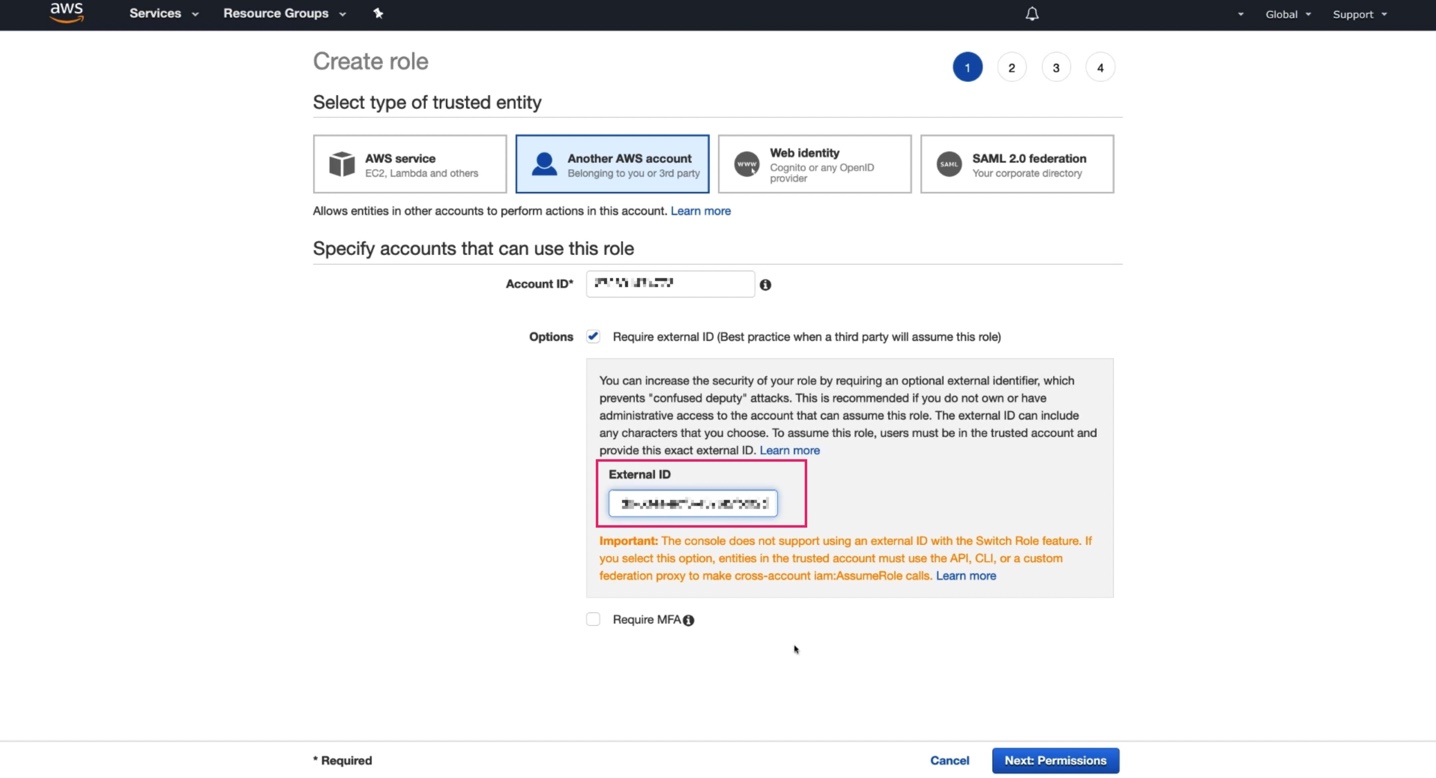
To this role we are creating, we need to associate the policy that we just created. Let me search by the name I gave that policy.
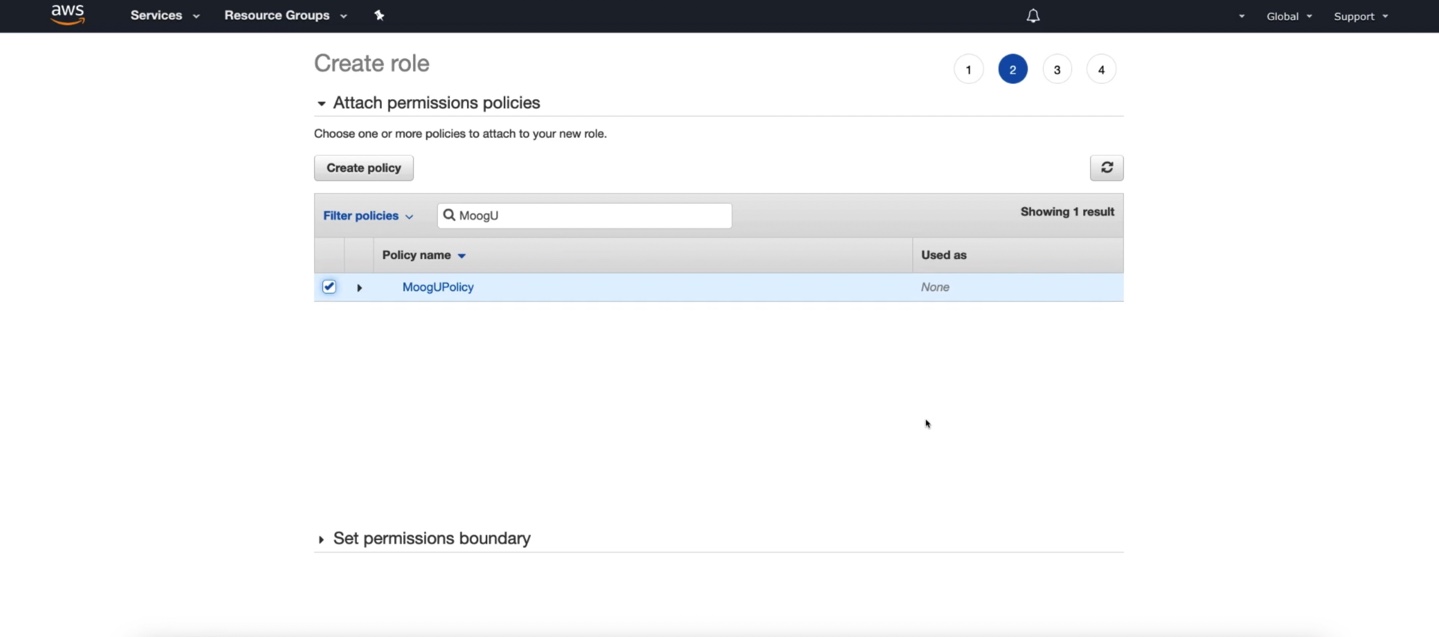
Lastly, provide a name for the role.
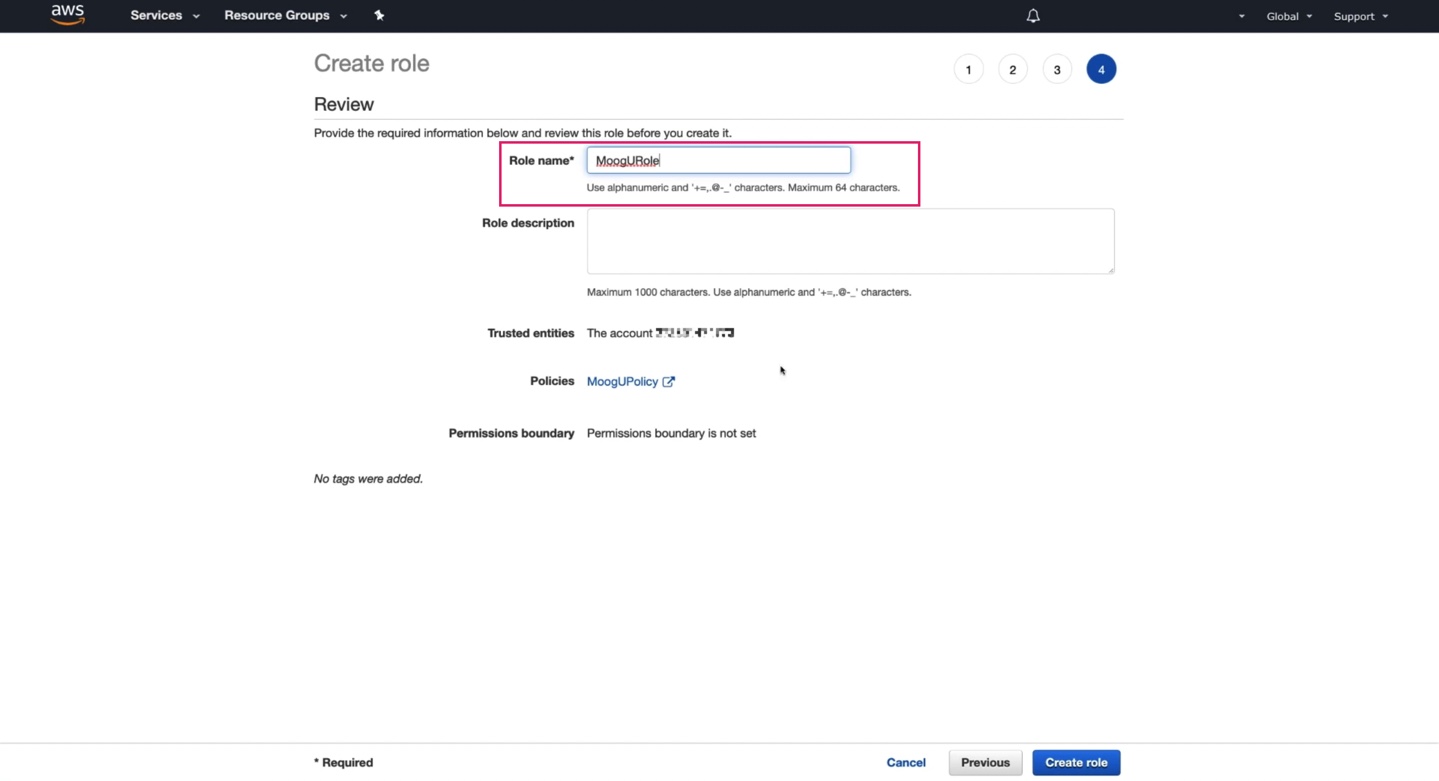
And now we have the role created.
Let's go back to Incident Management and plug in the new role information. Here's the name of the role, and here's the AWS account number.
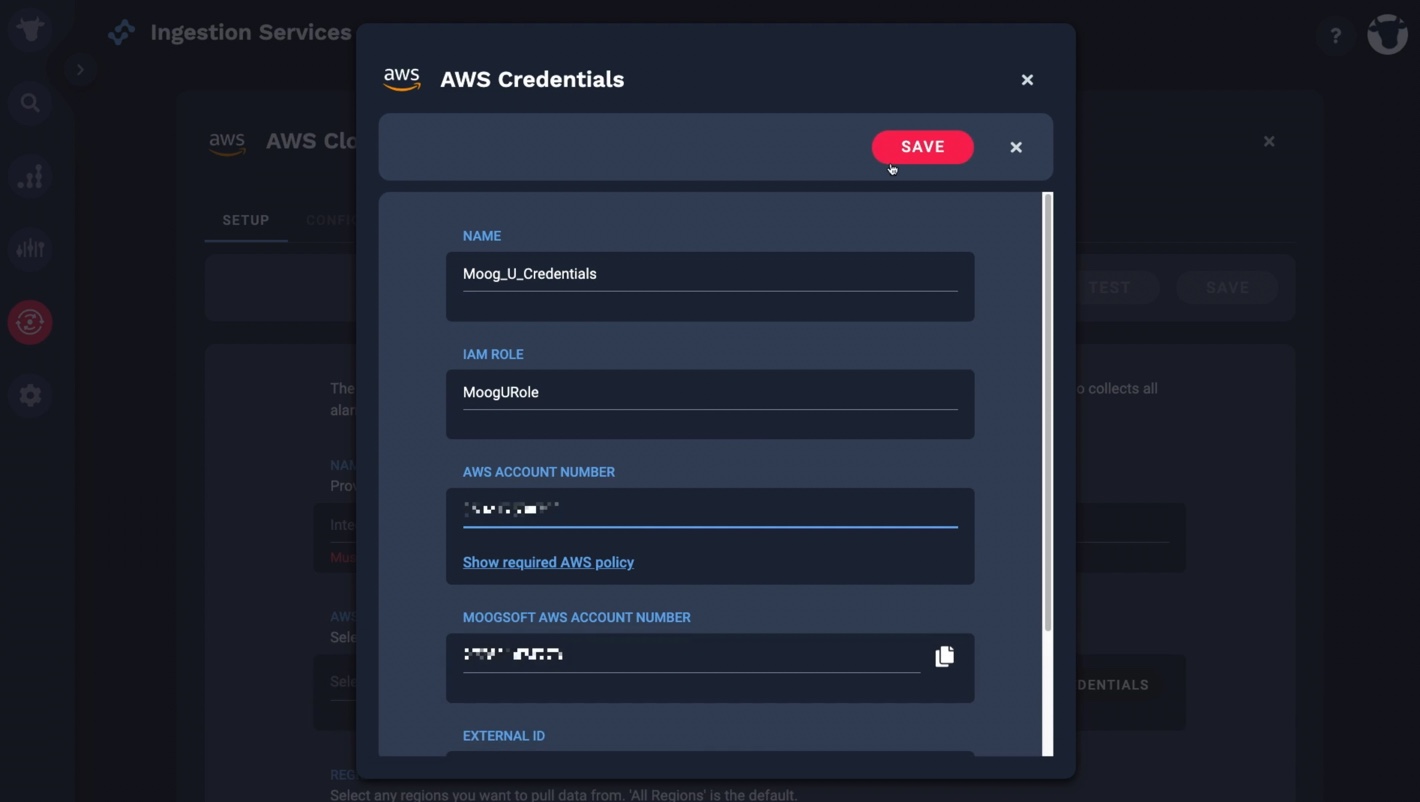
And the new credentials are now available for use.
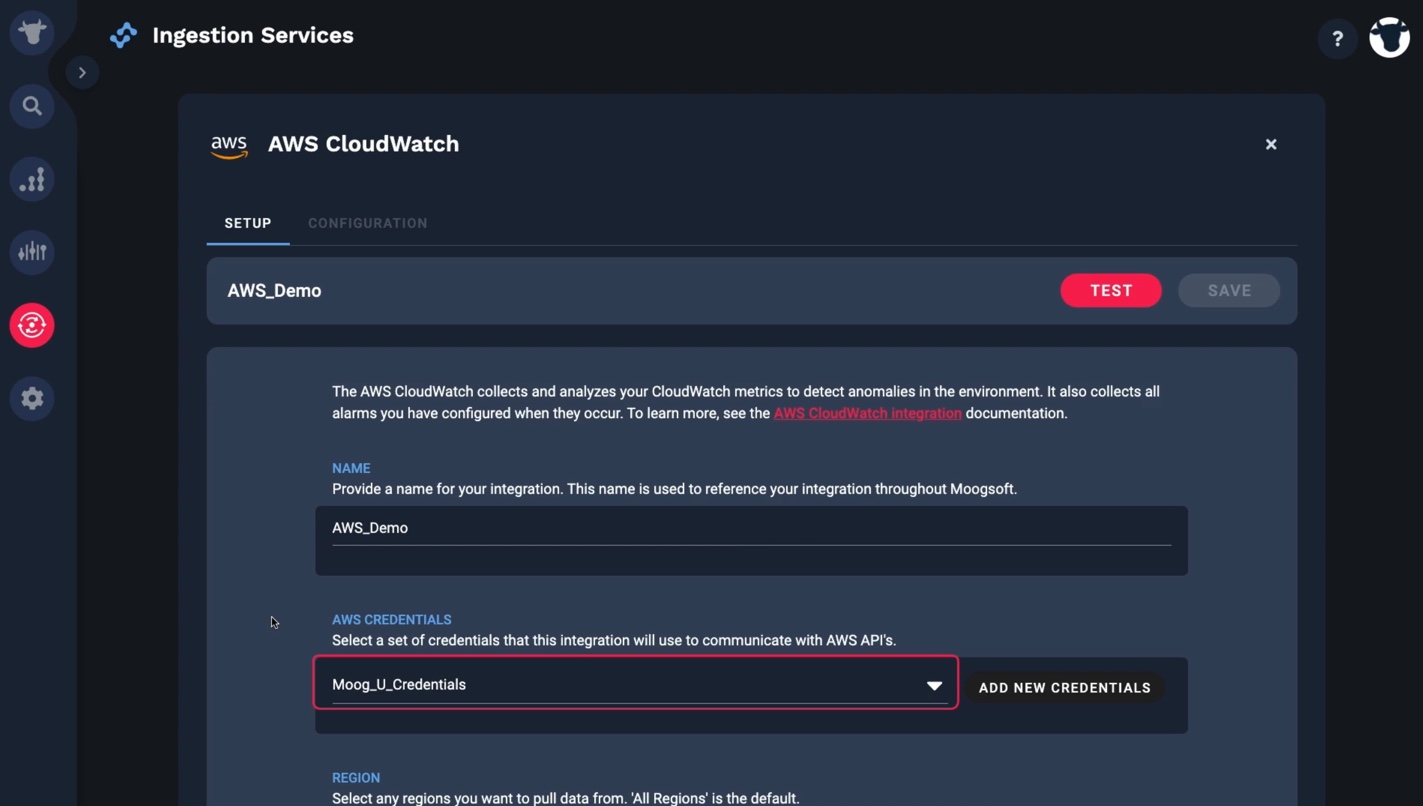
Select a region, and test.
It works! Now, the data from Cloudwatch will start to flow into this instance of Incident Management.
Thanks for watching!
BASIC | 8 MIN
Lean how to use the CYOI feature to configure a custom integration. The video covers:
When to use the custom integration option
Ingest data in JSON format into Moogsoft
Map data from your monitoring software to Moogsoft event fields
Set up and test a deduplication key to reduce operational noise
Documentation is available.
Demo video: Create a custom integration ►
*Please note Moogsoft is now part of Dell's IT Operations solution called APEX AIOps, and changed its name to APEX AIOps Incident Management. The UI in this video may differ slightly but the content covered is still relevant.
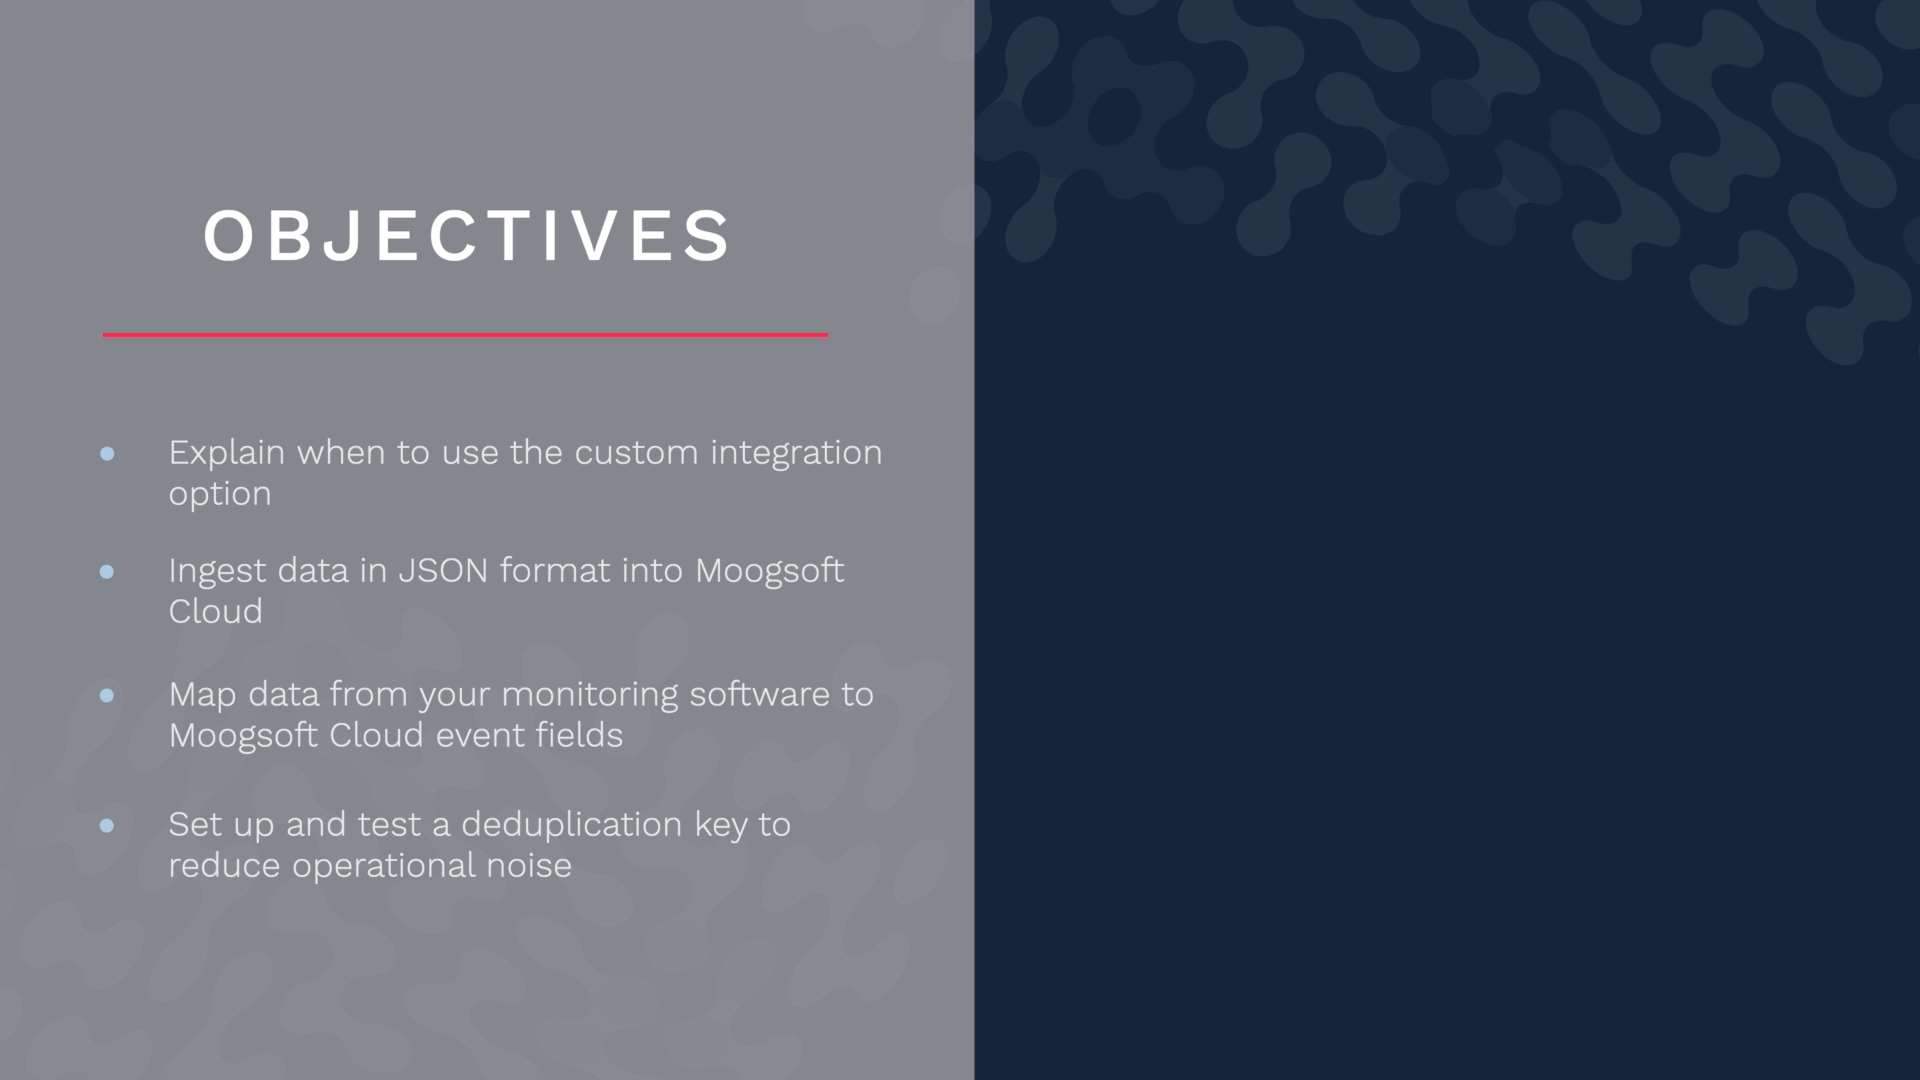
After watching this video, you will be able to configure a custom integration to bring data from your monitoring source into Incident Management. You will be able to identify when to choose this over other integration options, ingest data in JSON format into Incident Management, map data from your monitoring software to Incident Management event fields, and set up and test a deduplication key to reduce operational noise.
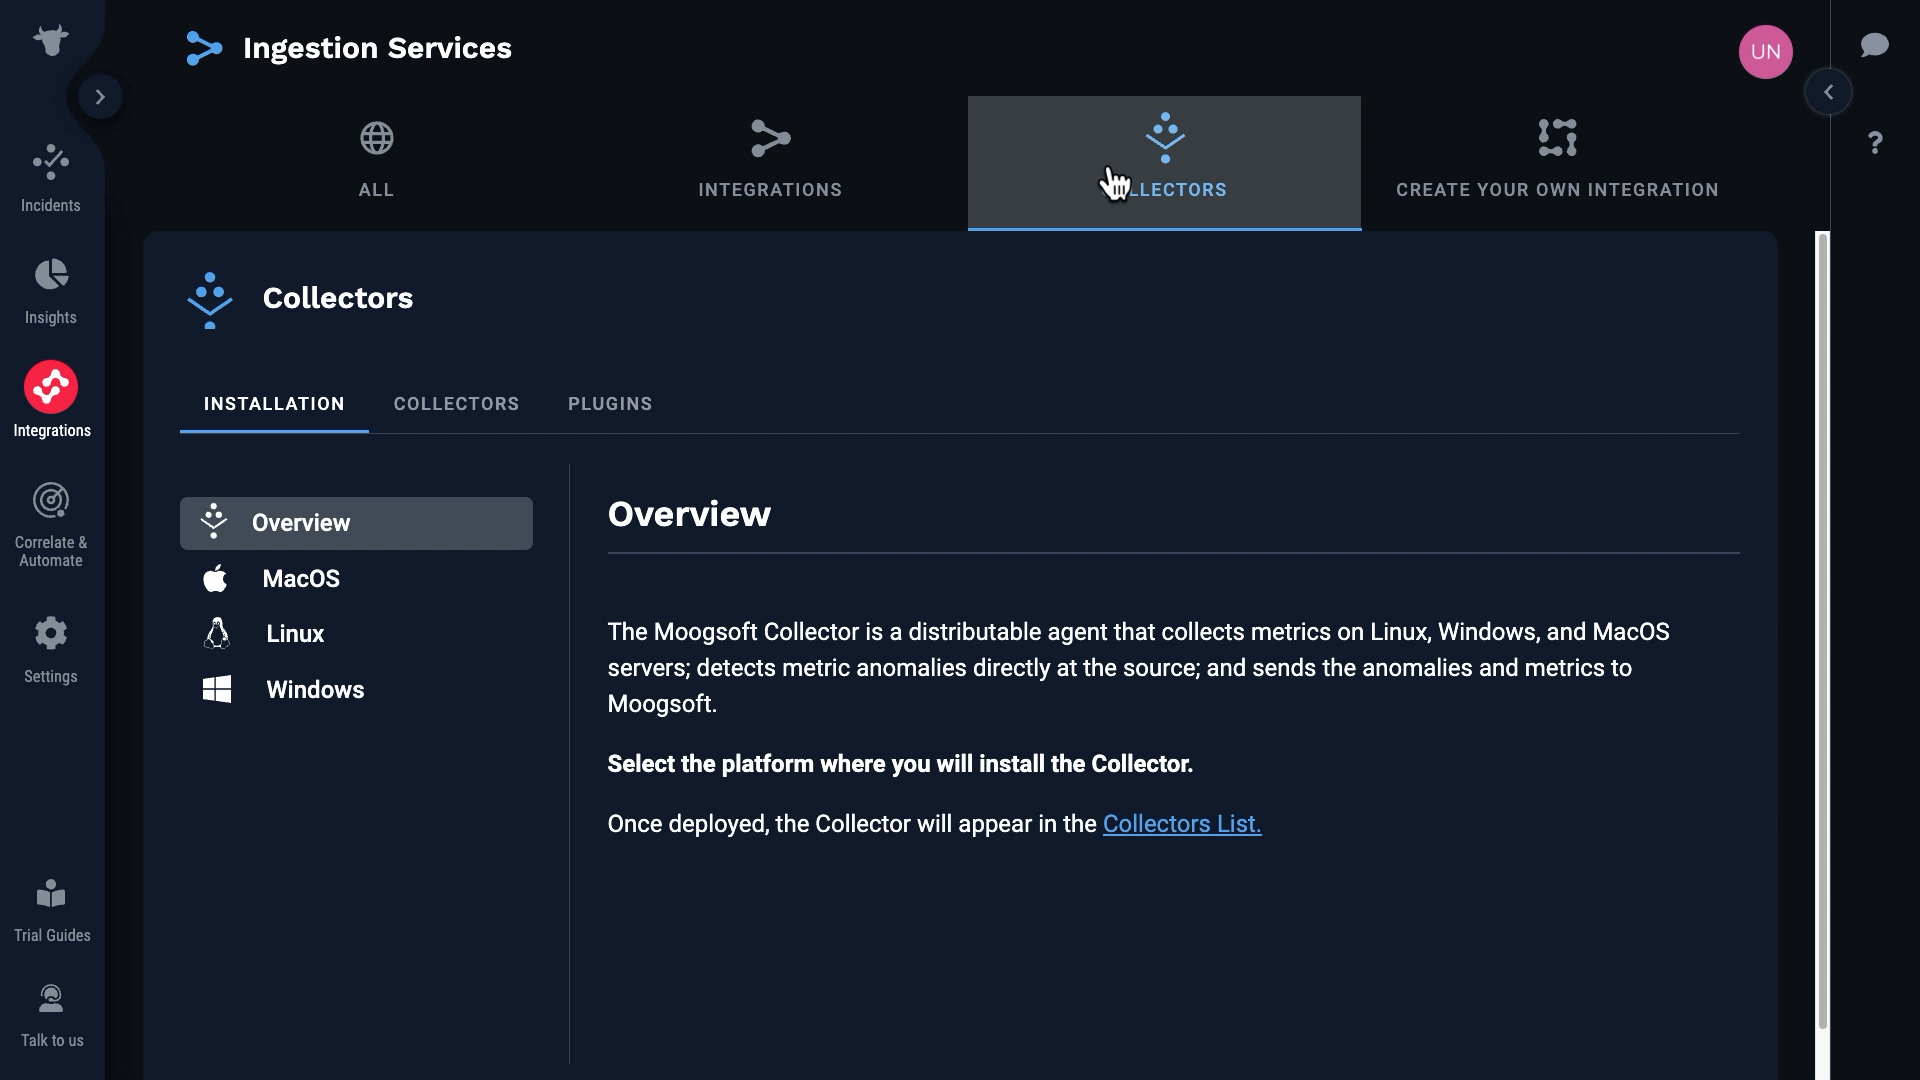
Incident Management offers a few different ways to ingest source data. You can install a data collector to the system you want to monitor...
...or integrate with specific monitoring tools.
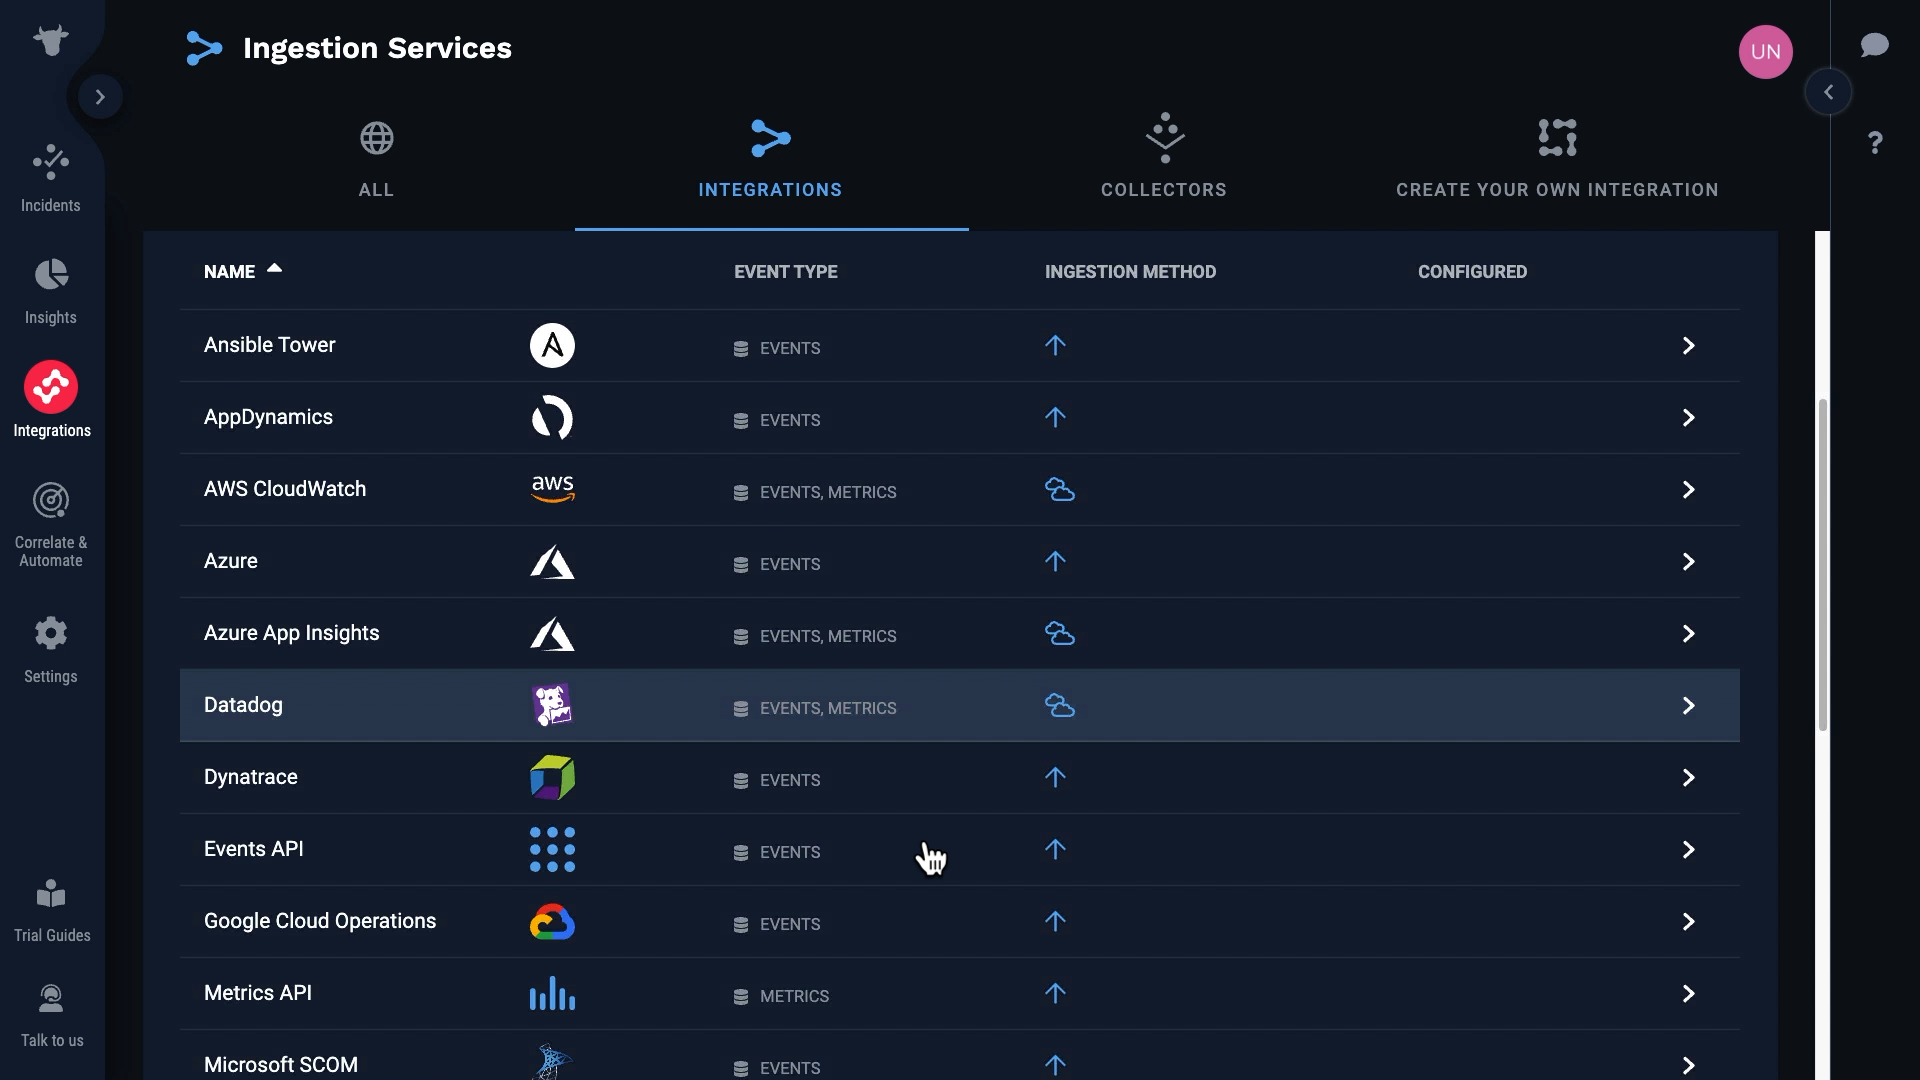
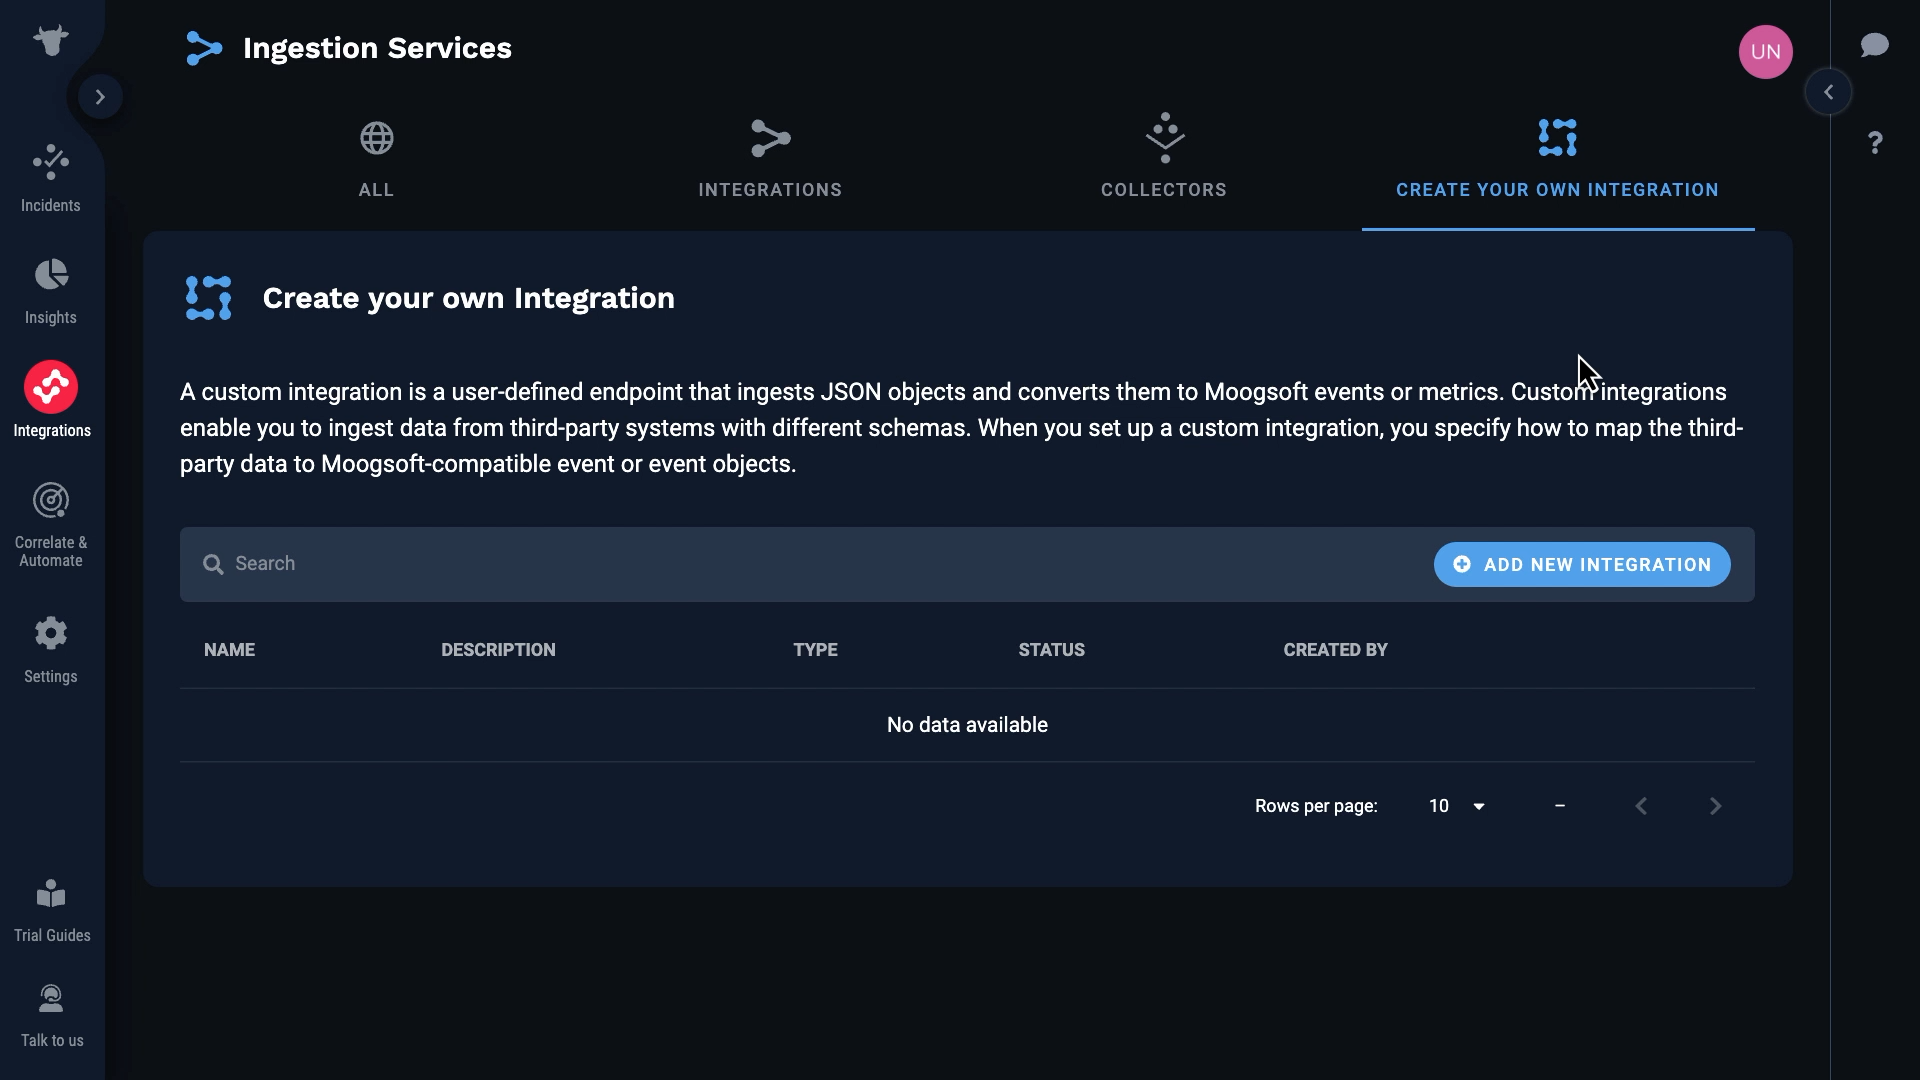
Or you can build your own custom integration. You should choose a custom integration when there is no collector for your environment, and there is no specific integration available for your monitoring tool.
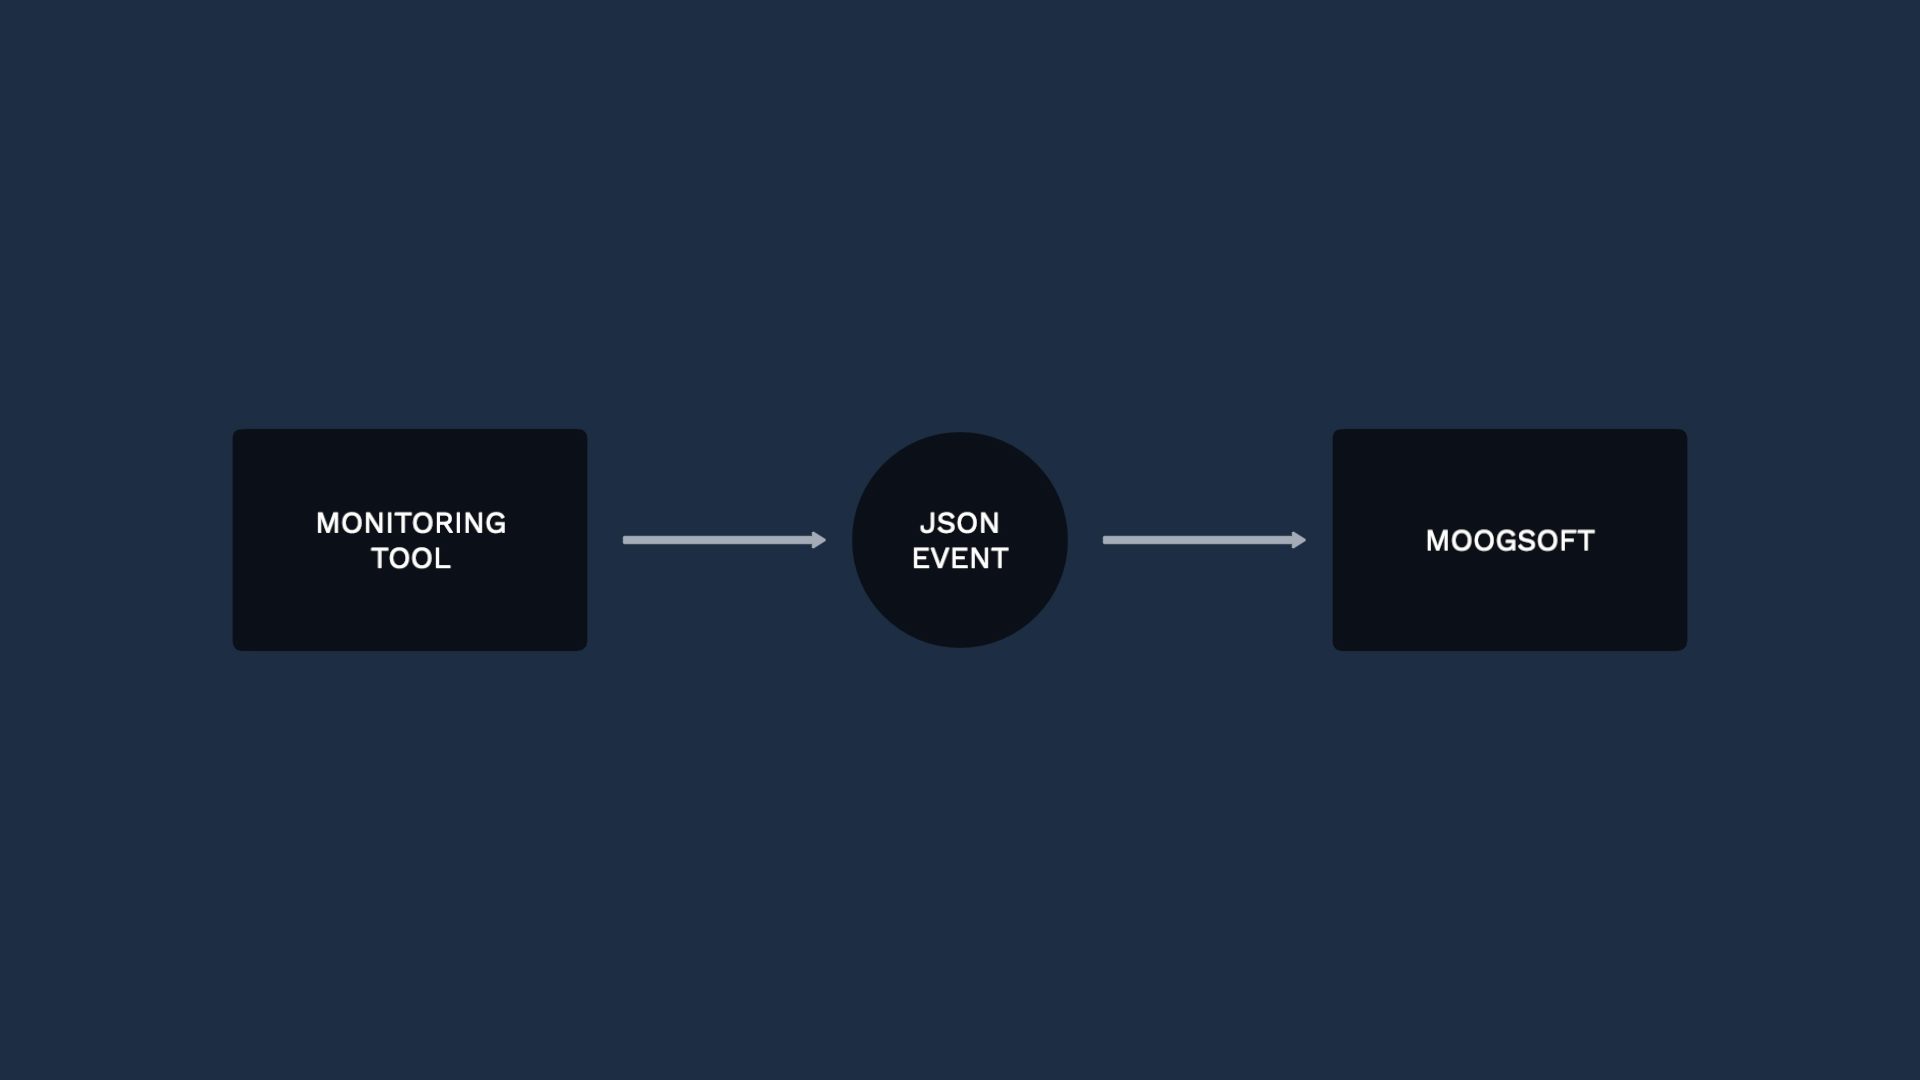
Creating your own integration has several benefits. First, you are not limited to particular monitoring tools. You can set up a custom integration with any monitoring source that can send data in JSON format.
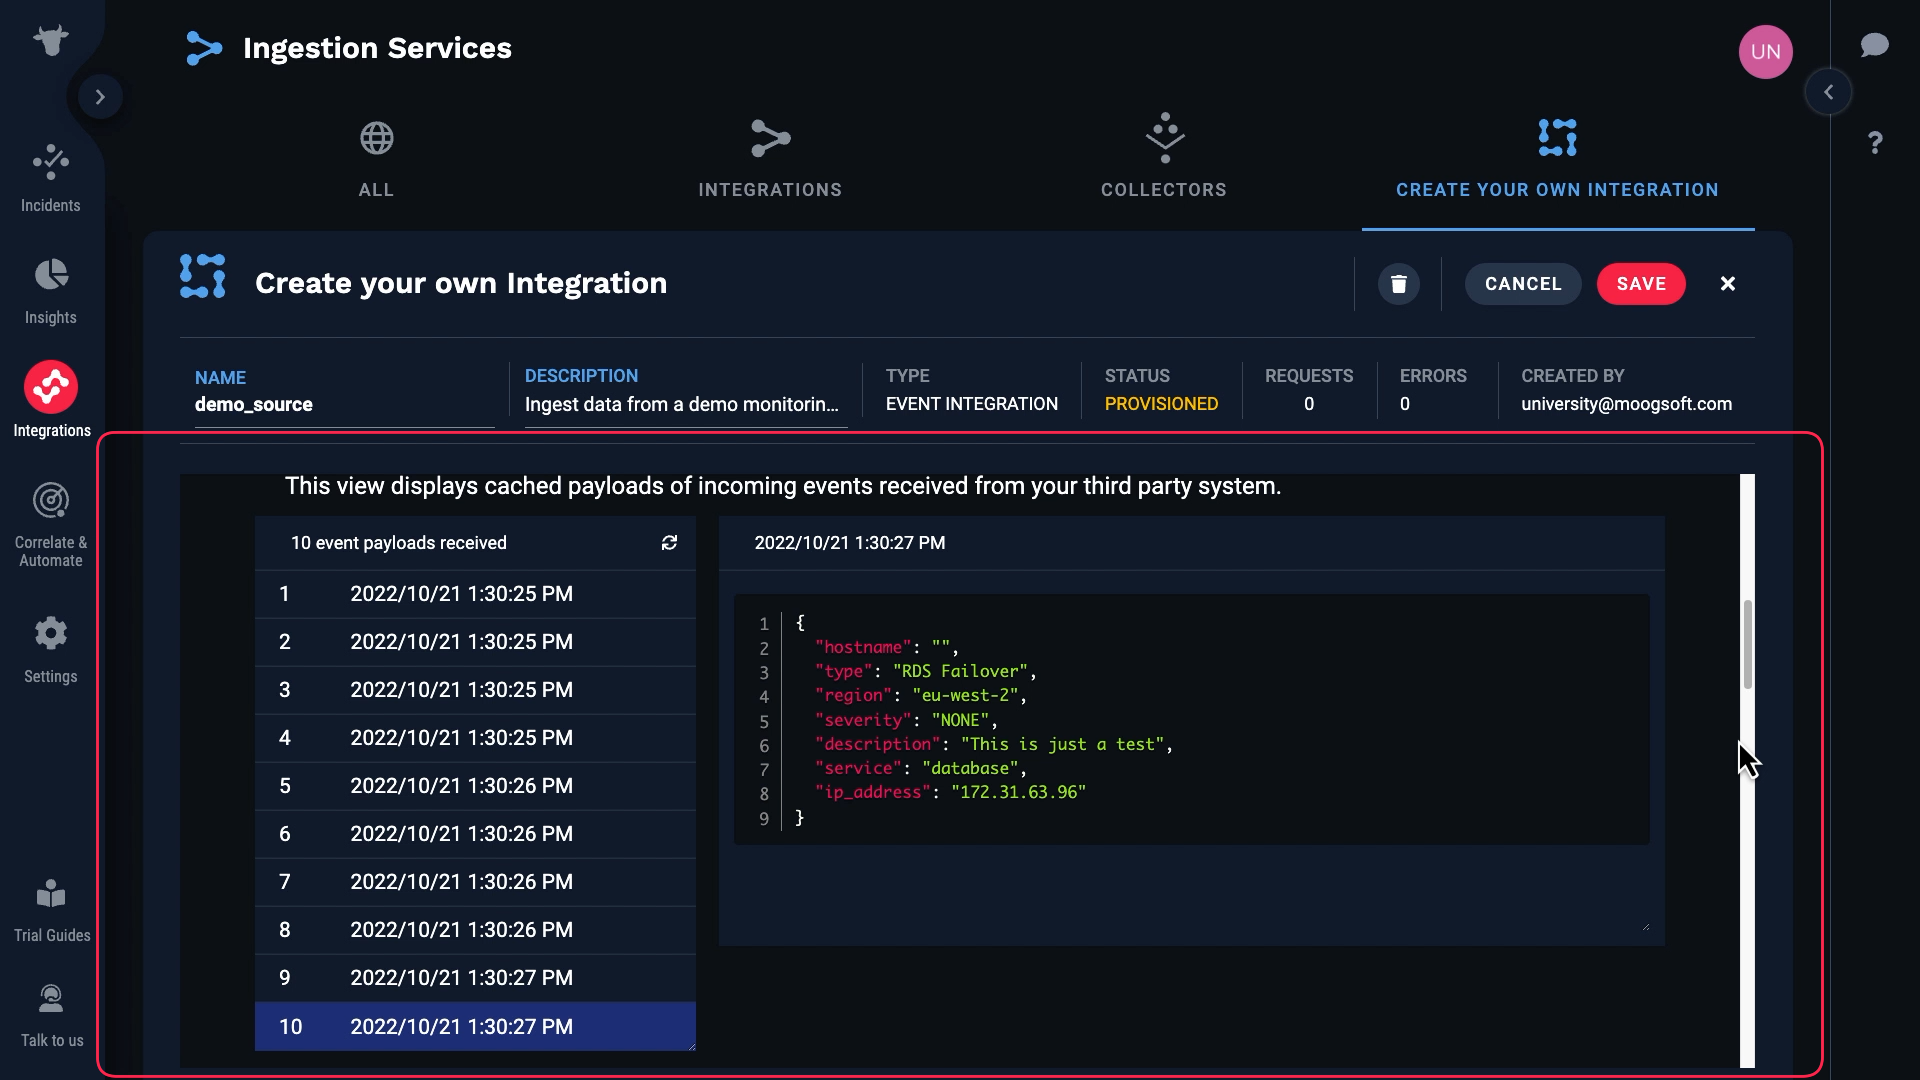
Second, you will use real data to design and test your integration. The Create Your Own Integration feature makes it easy to inspect source data before you map it.
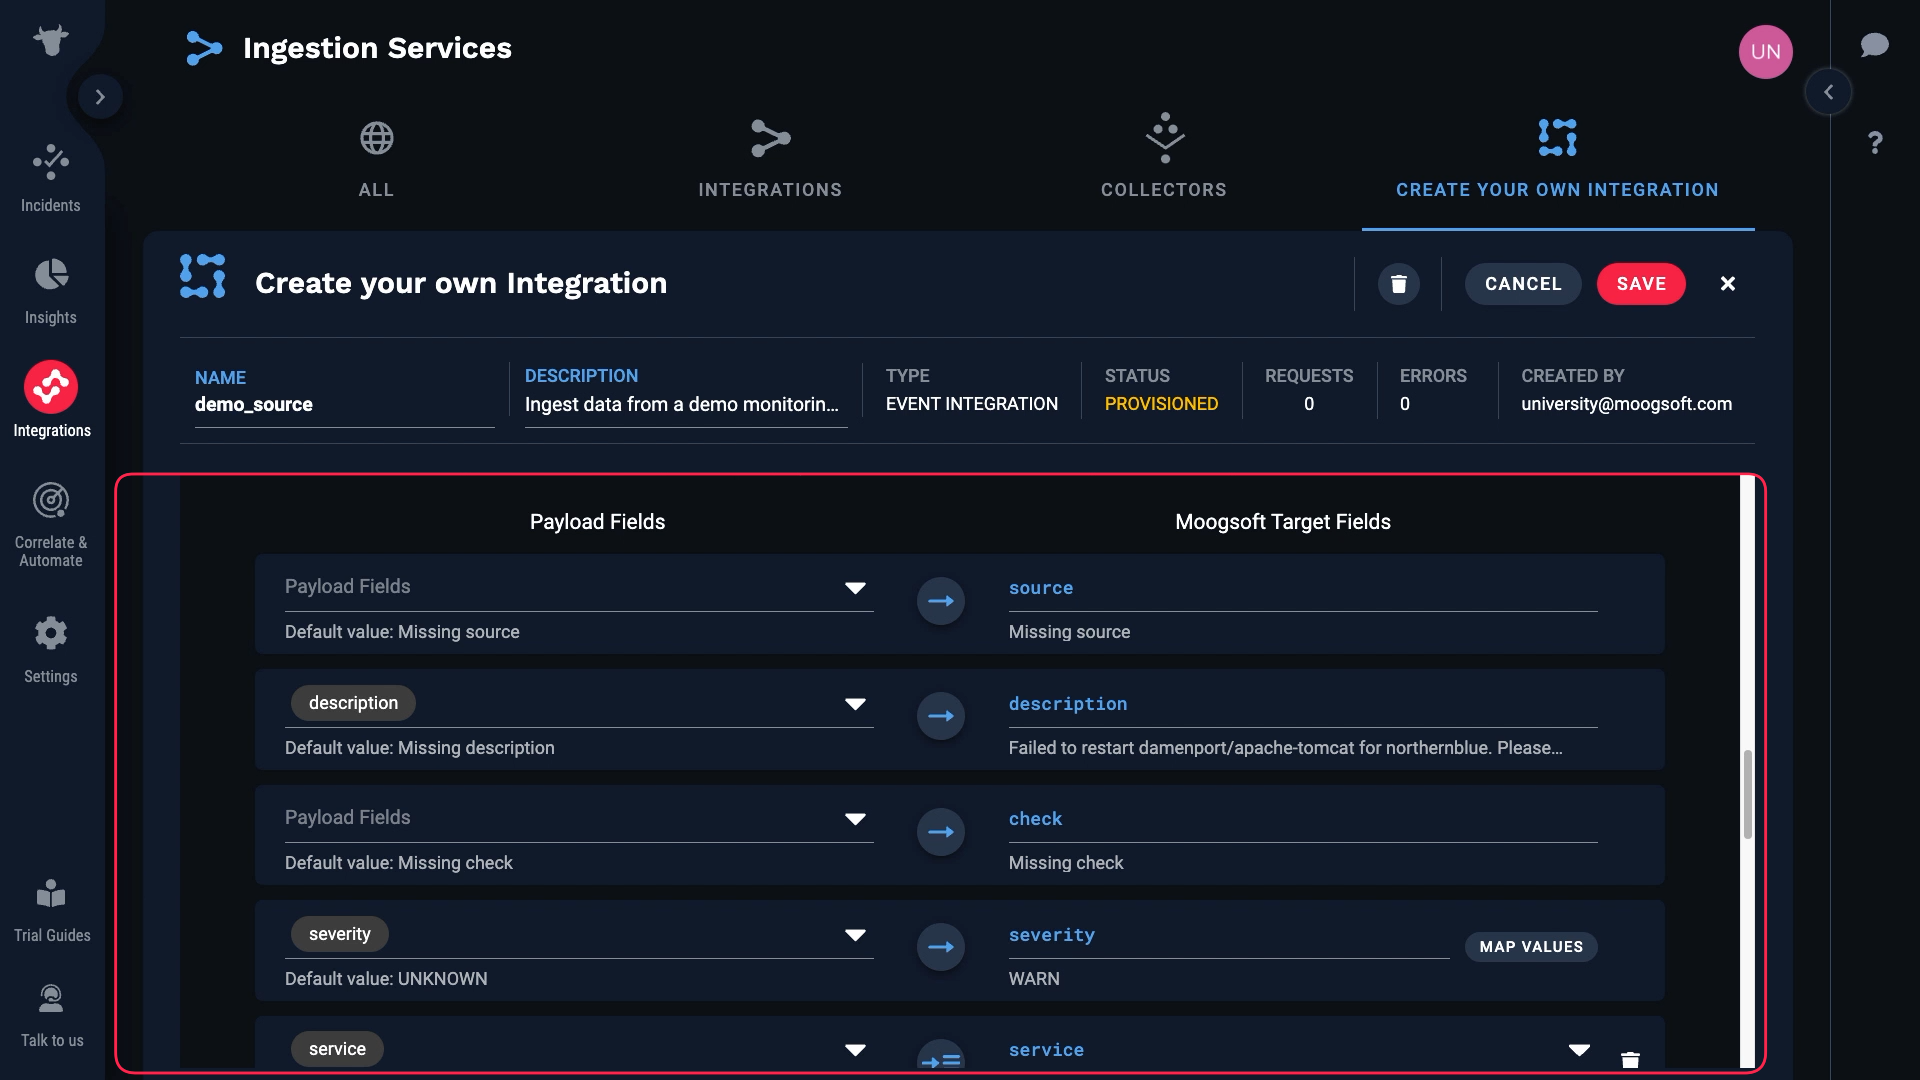
And finally, creating a custom integration is simple. When you configure a webhook in a monitoring tool, you usually have to write code to modify the outgoing data payload. The Create Your Own Integration feature does all the mapping right in the Incident Management user interface, with no code.
After you have ingested data using a custom integration, you can transform and enrich it using the Incident Management Workflow Engine. Still without writing any code.
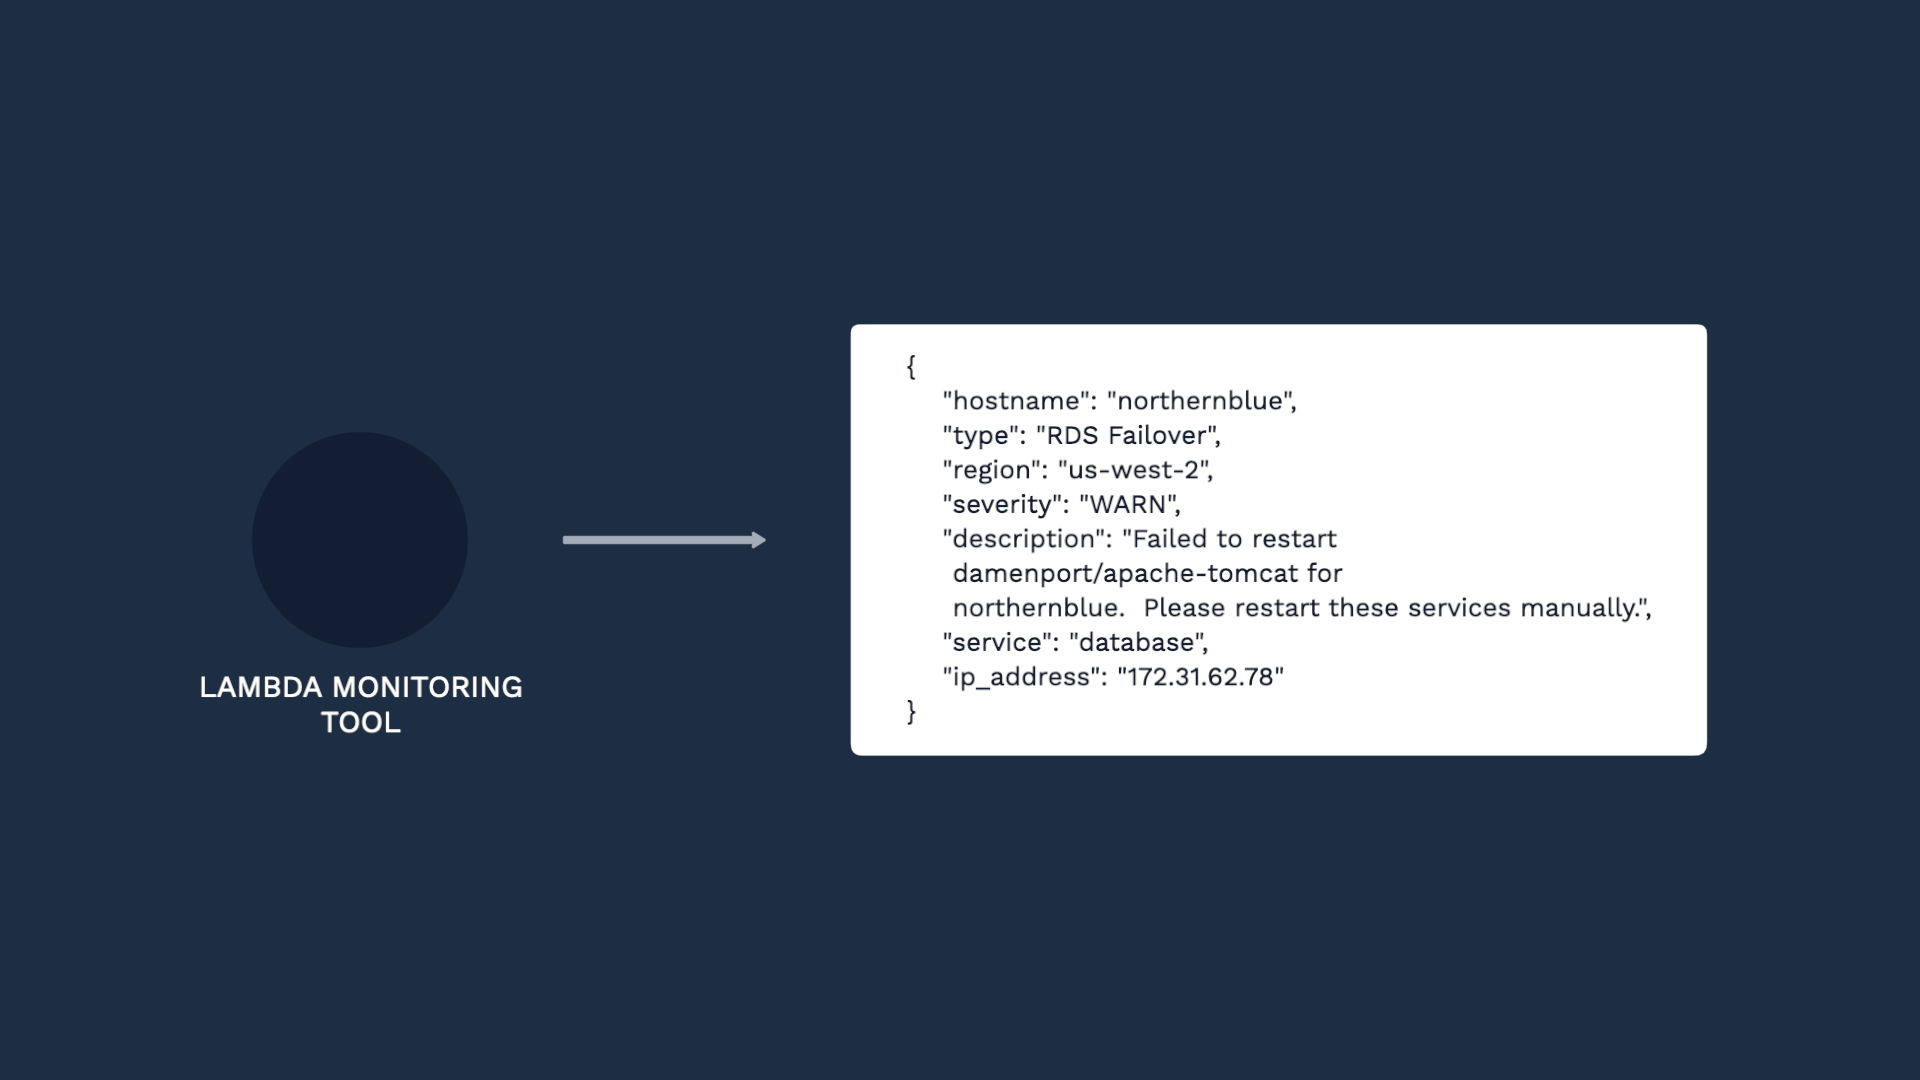
Let’s step through setting up a custom integration together. Let’s say we have source data in JSON format that’s structured like this:
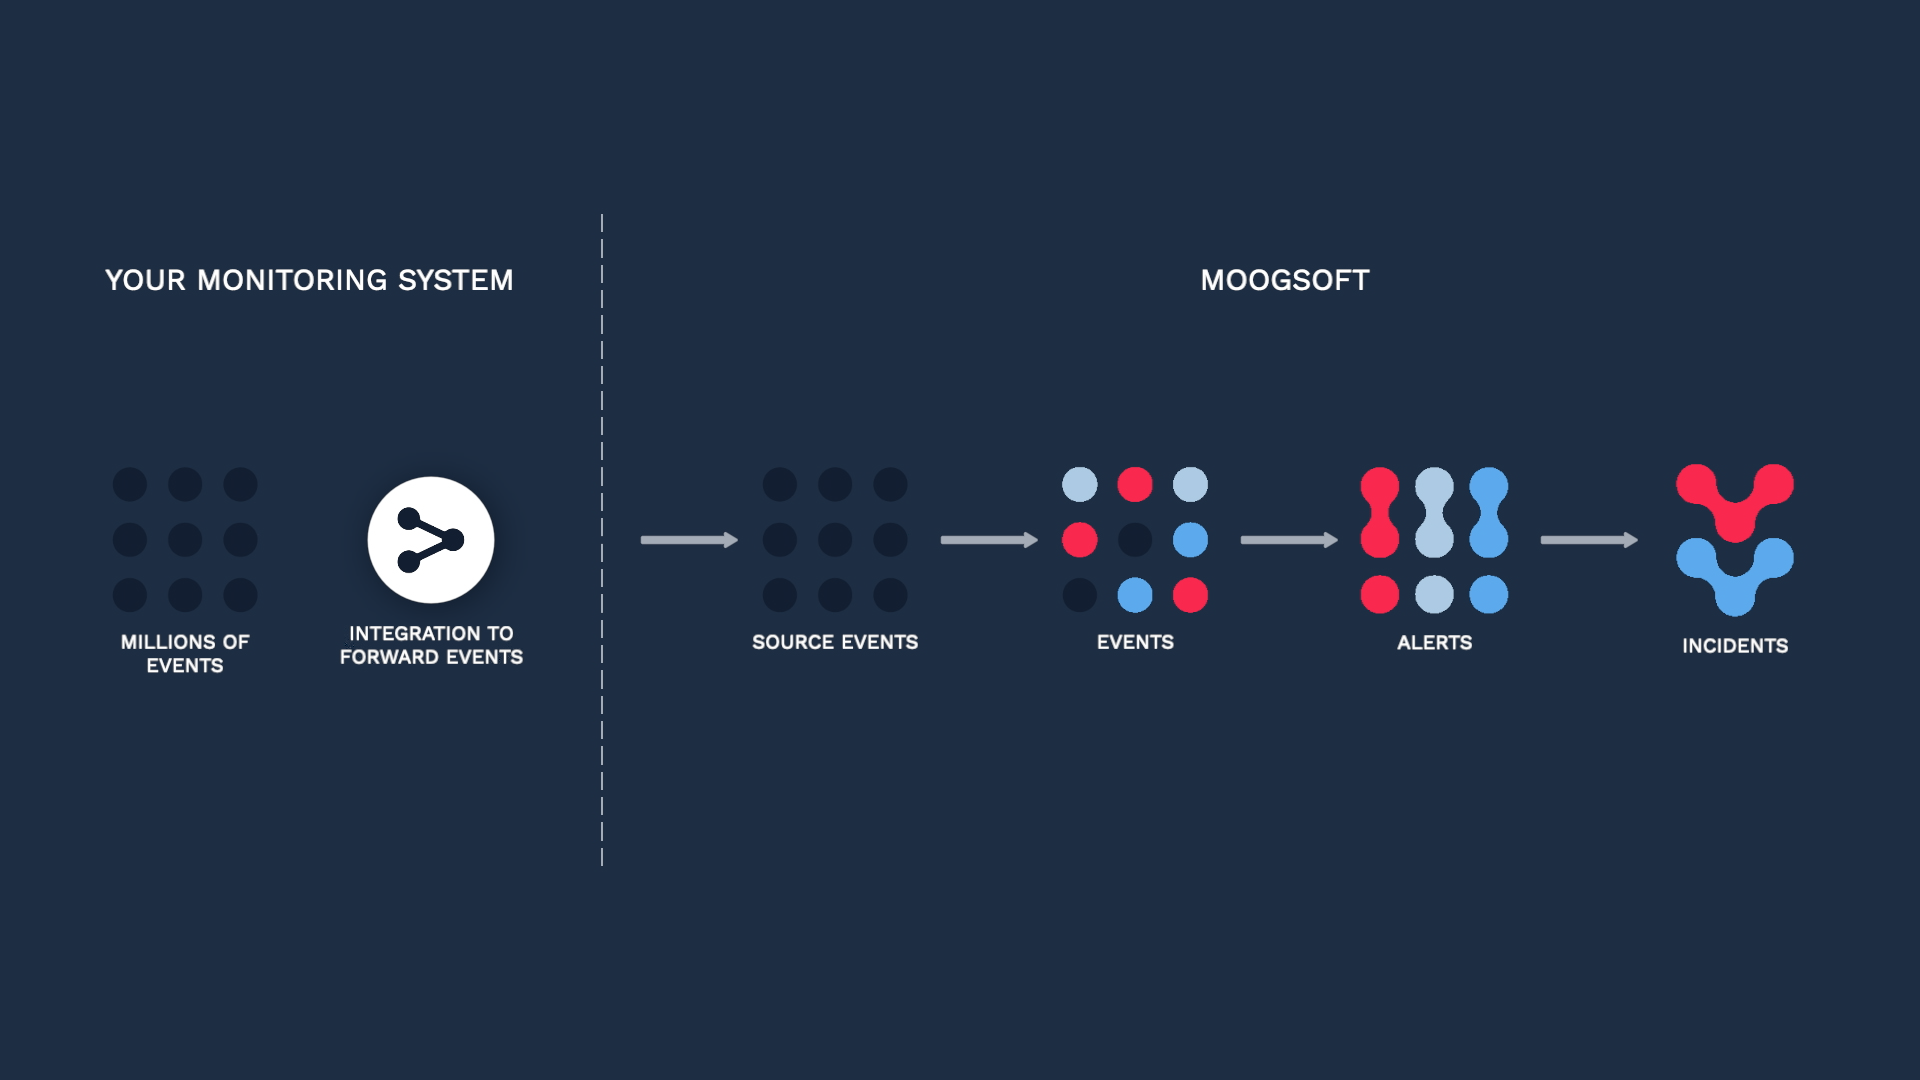
We want to ingest the events so we can deduplicate and correlate them in Incident Management.
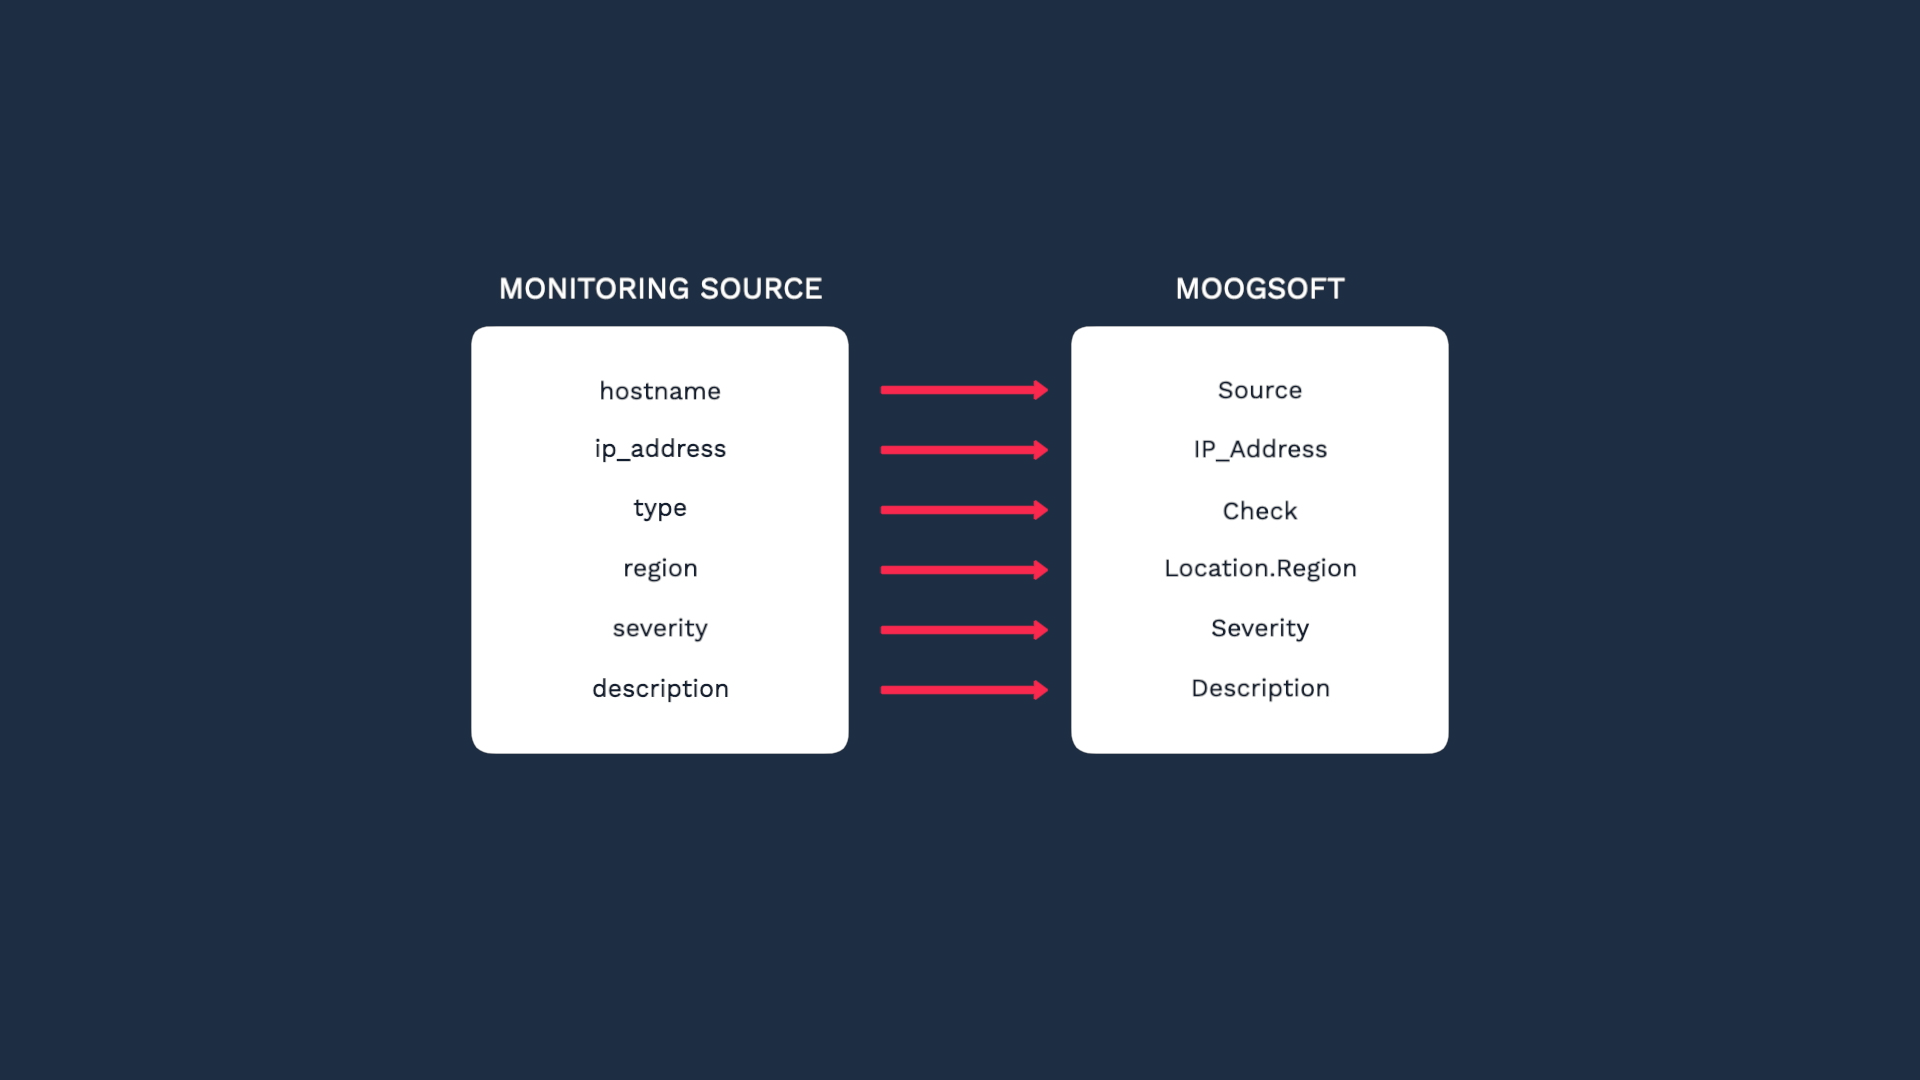
And we need to map them to the Incident Management event fields.
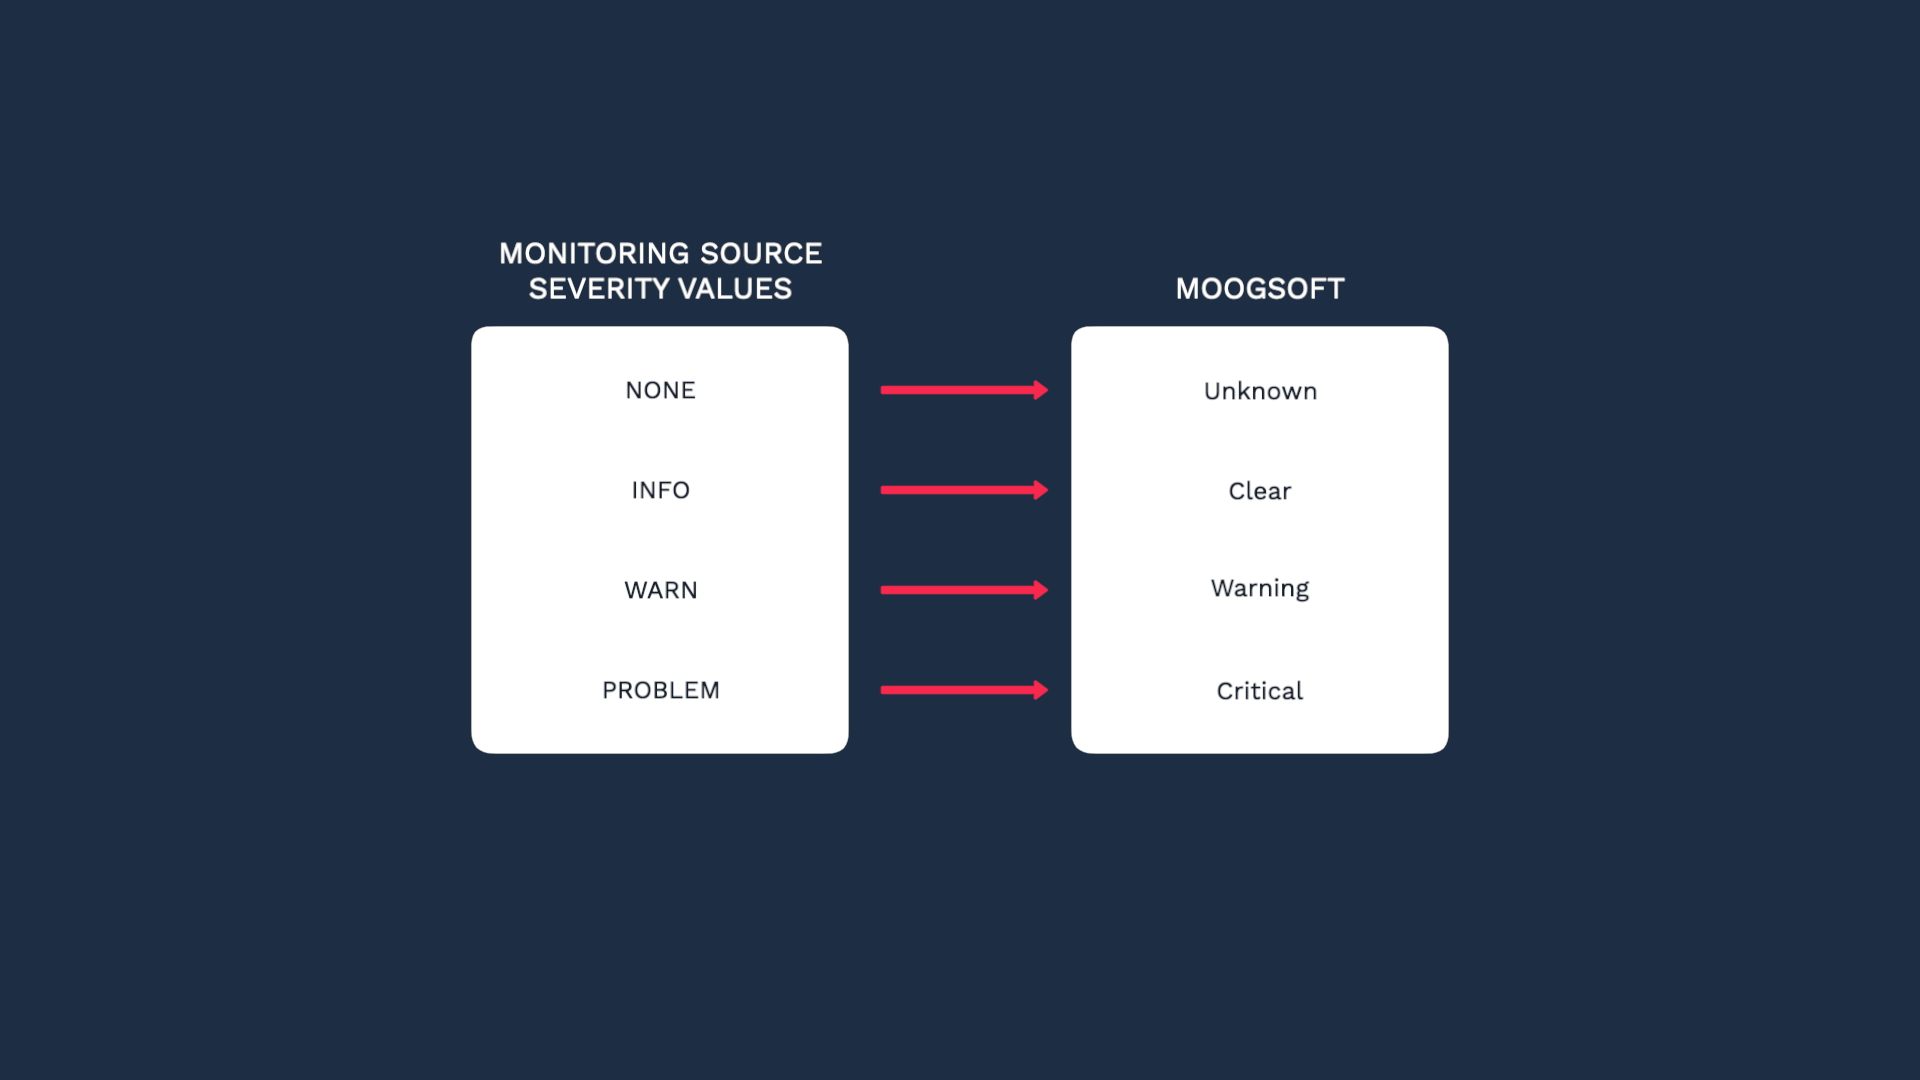
We also want to map the values for severity. Our source events only have four severity levels: NONE, INFO, WARN, and PROBLEM. We want to map these values to Incident Management severity levels like this.
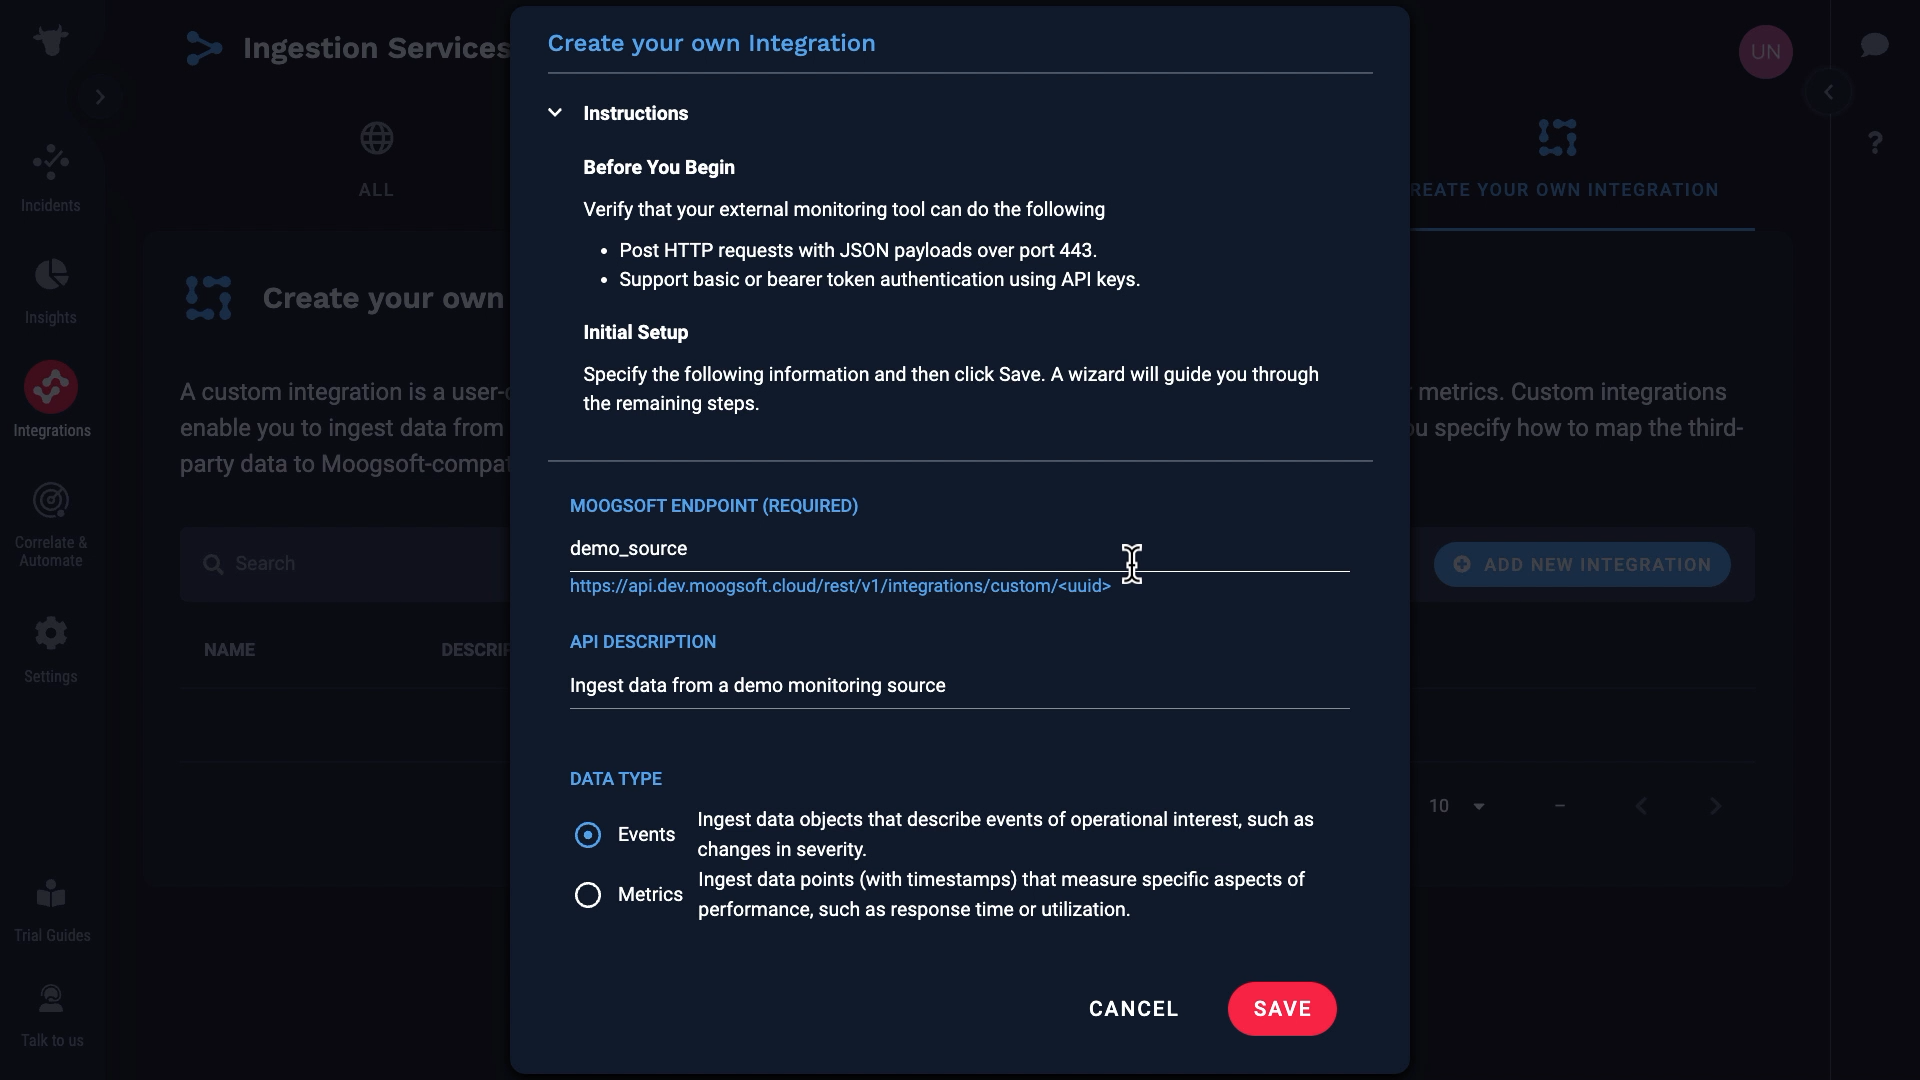
This is where you can set up a custom data ingestion. We are going to set up a new integration. Our source data in this example events, but note that we support metrics also.
We just created a custom endpoint for our integration.
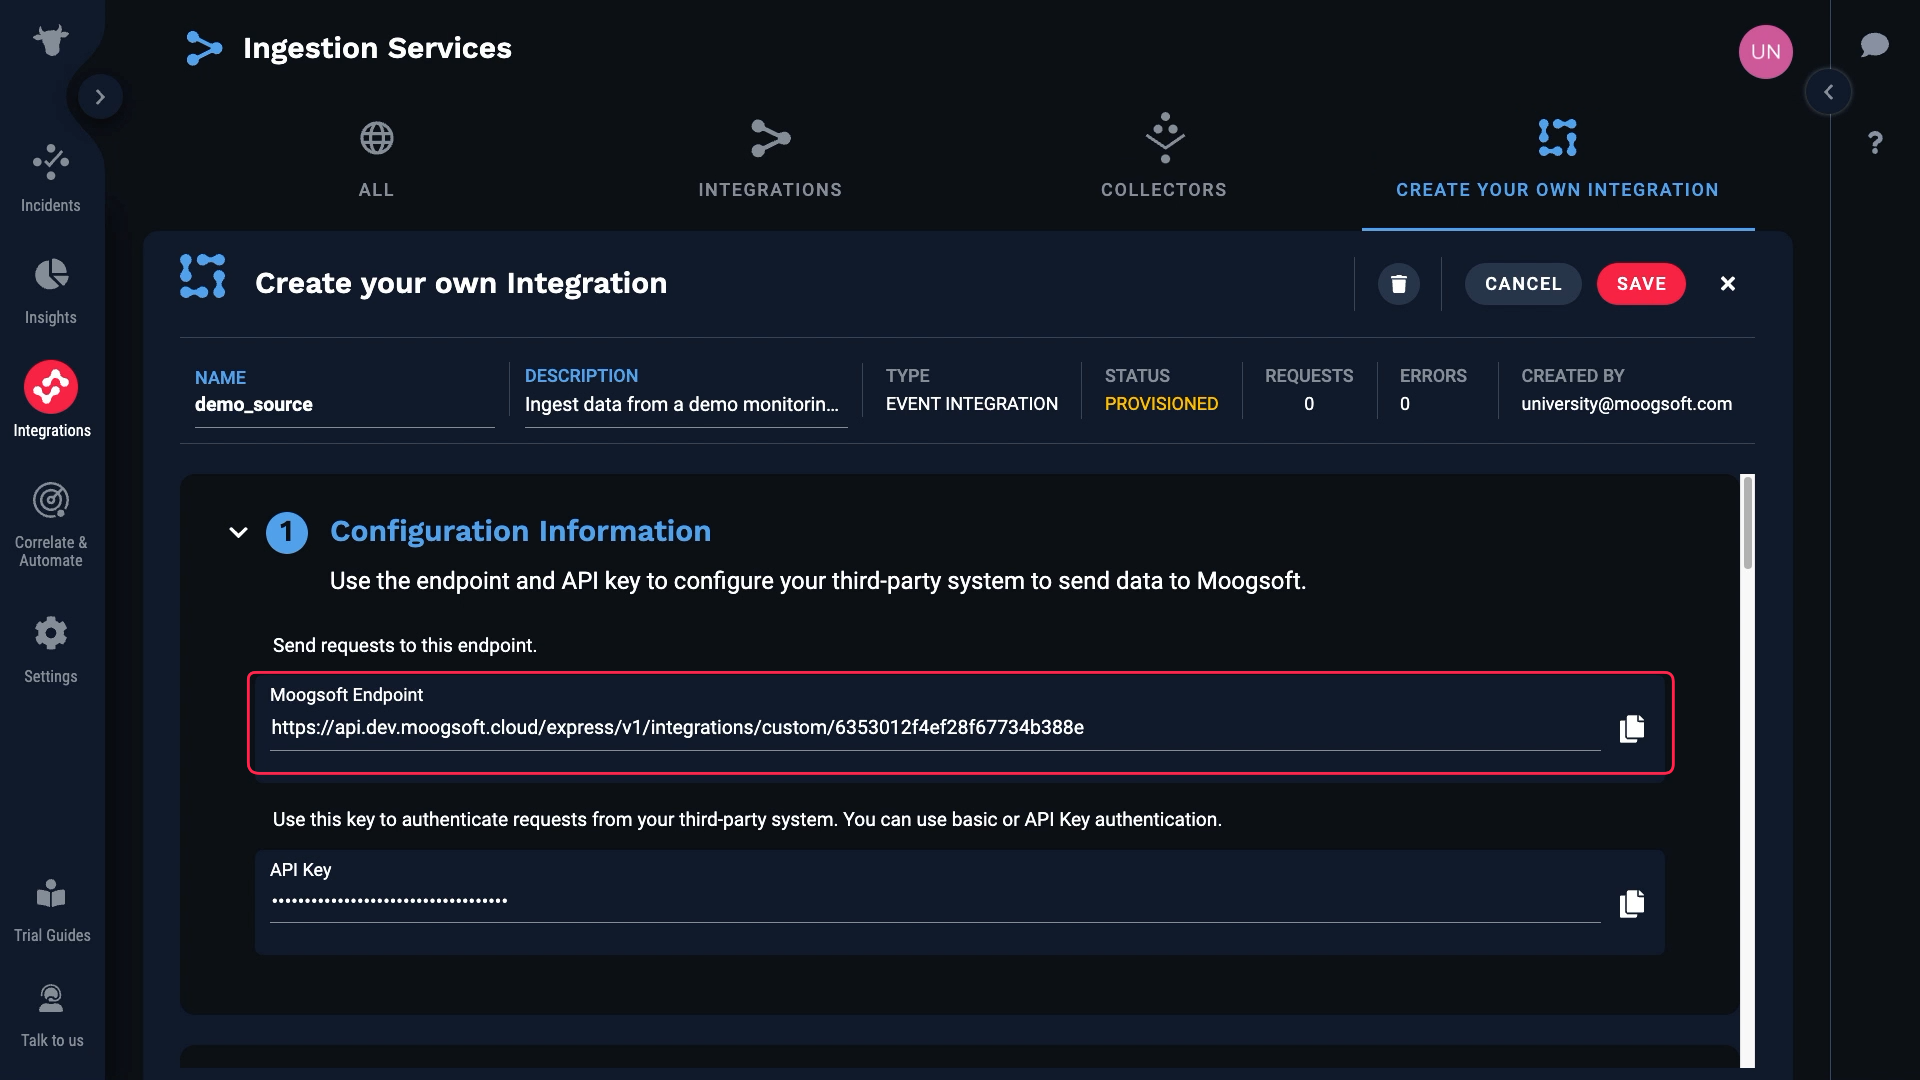
Grab that, and the API Key for our Incident Management instance which is found here.
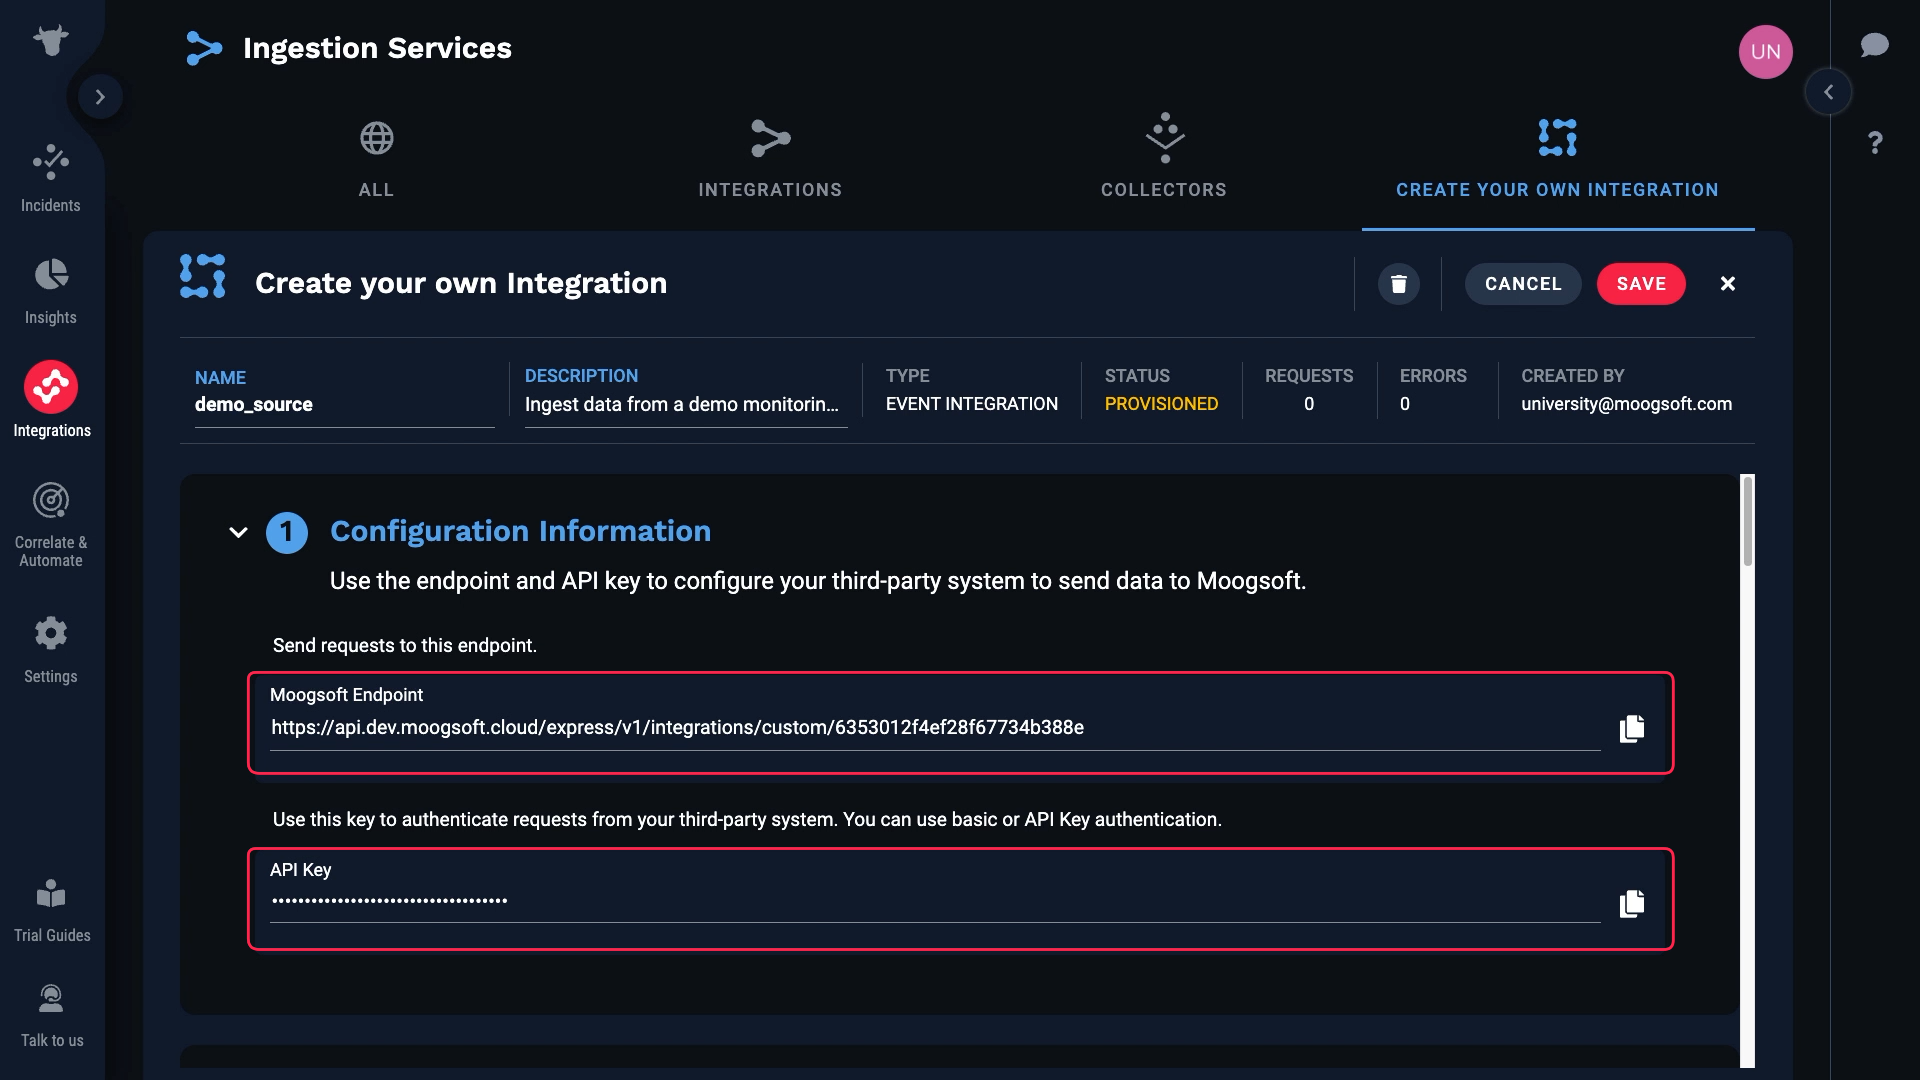
We’ve input those values in the source system. And now, Incident Management is receiving raw data from our source. Note that up to 10 of the most recent events are cached. You can click the reload button to refresh the list of data payloads.
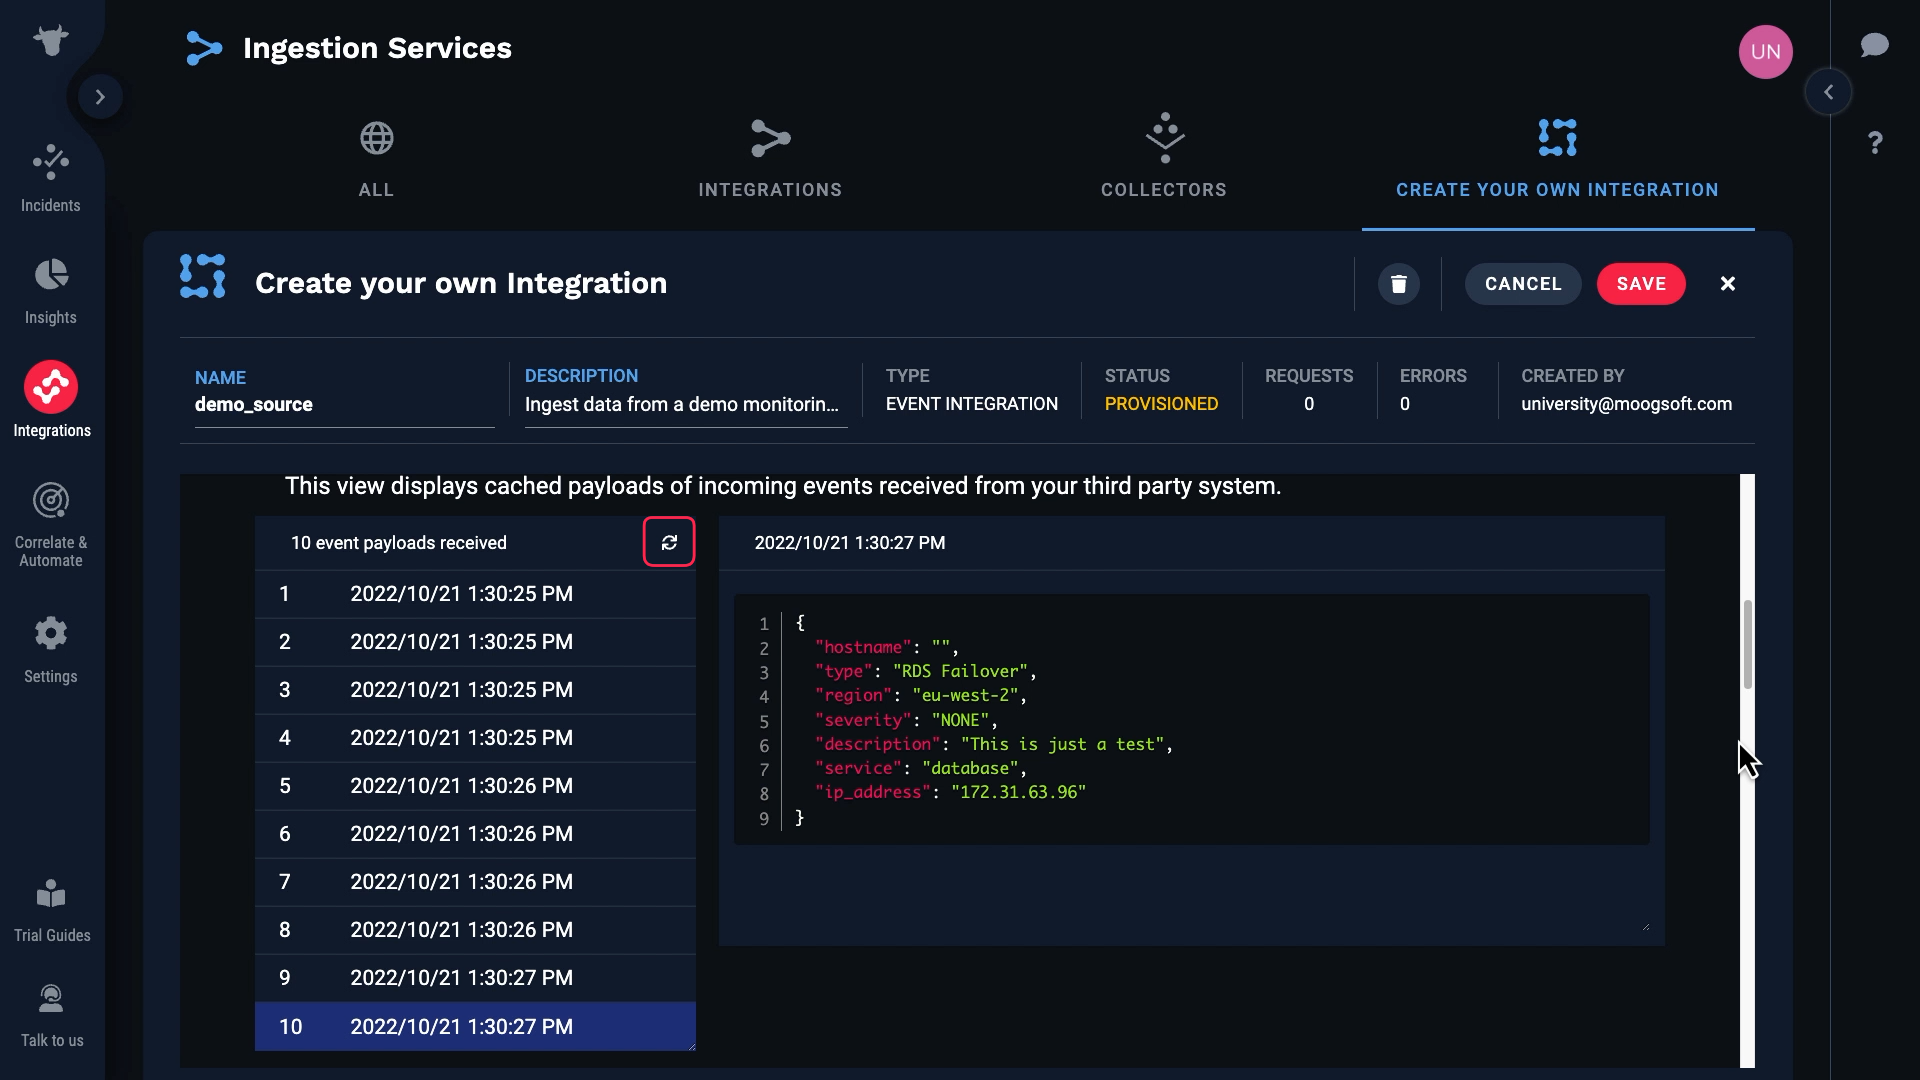
We can examine the data for each event here.
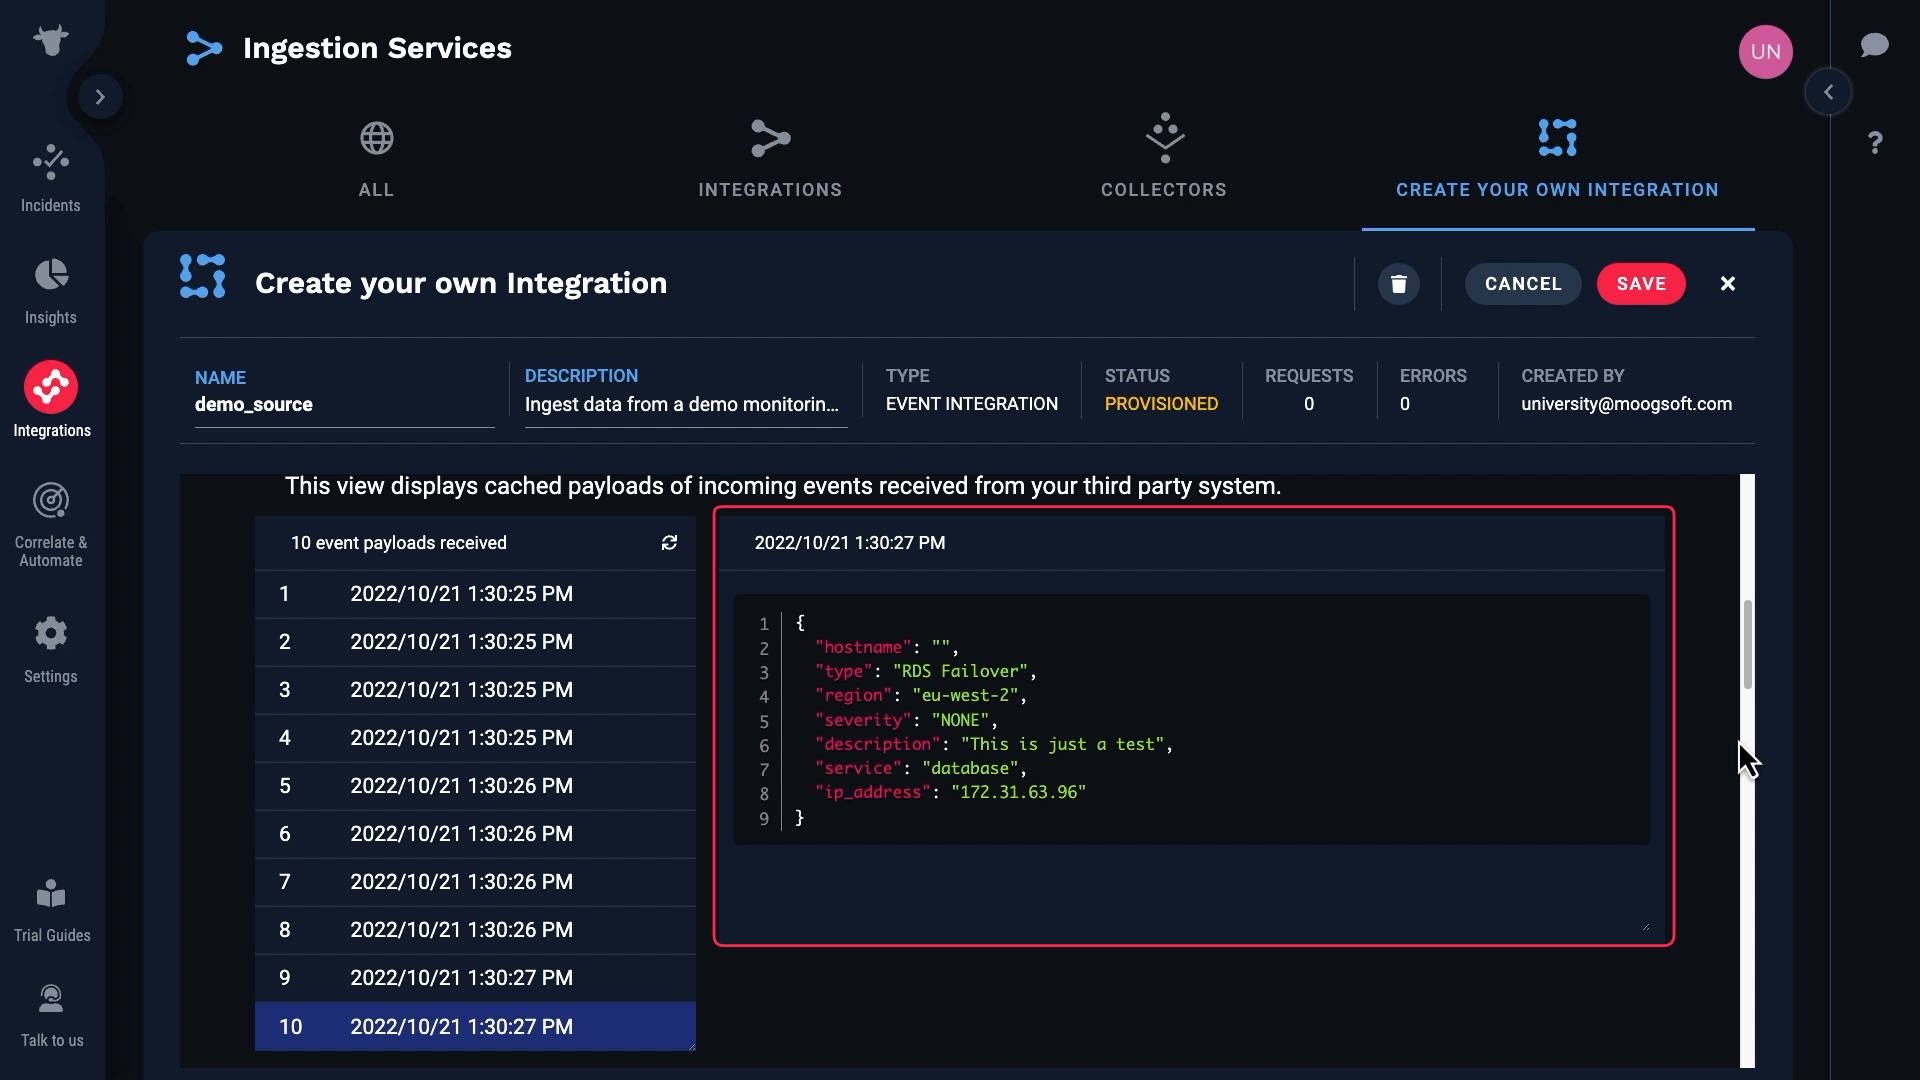
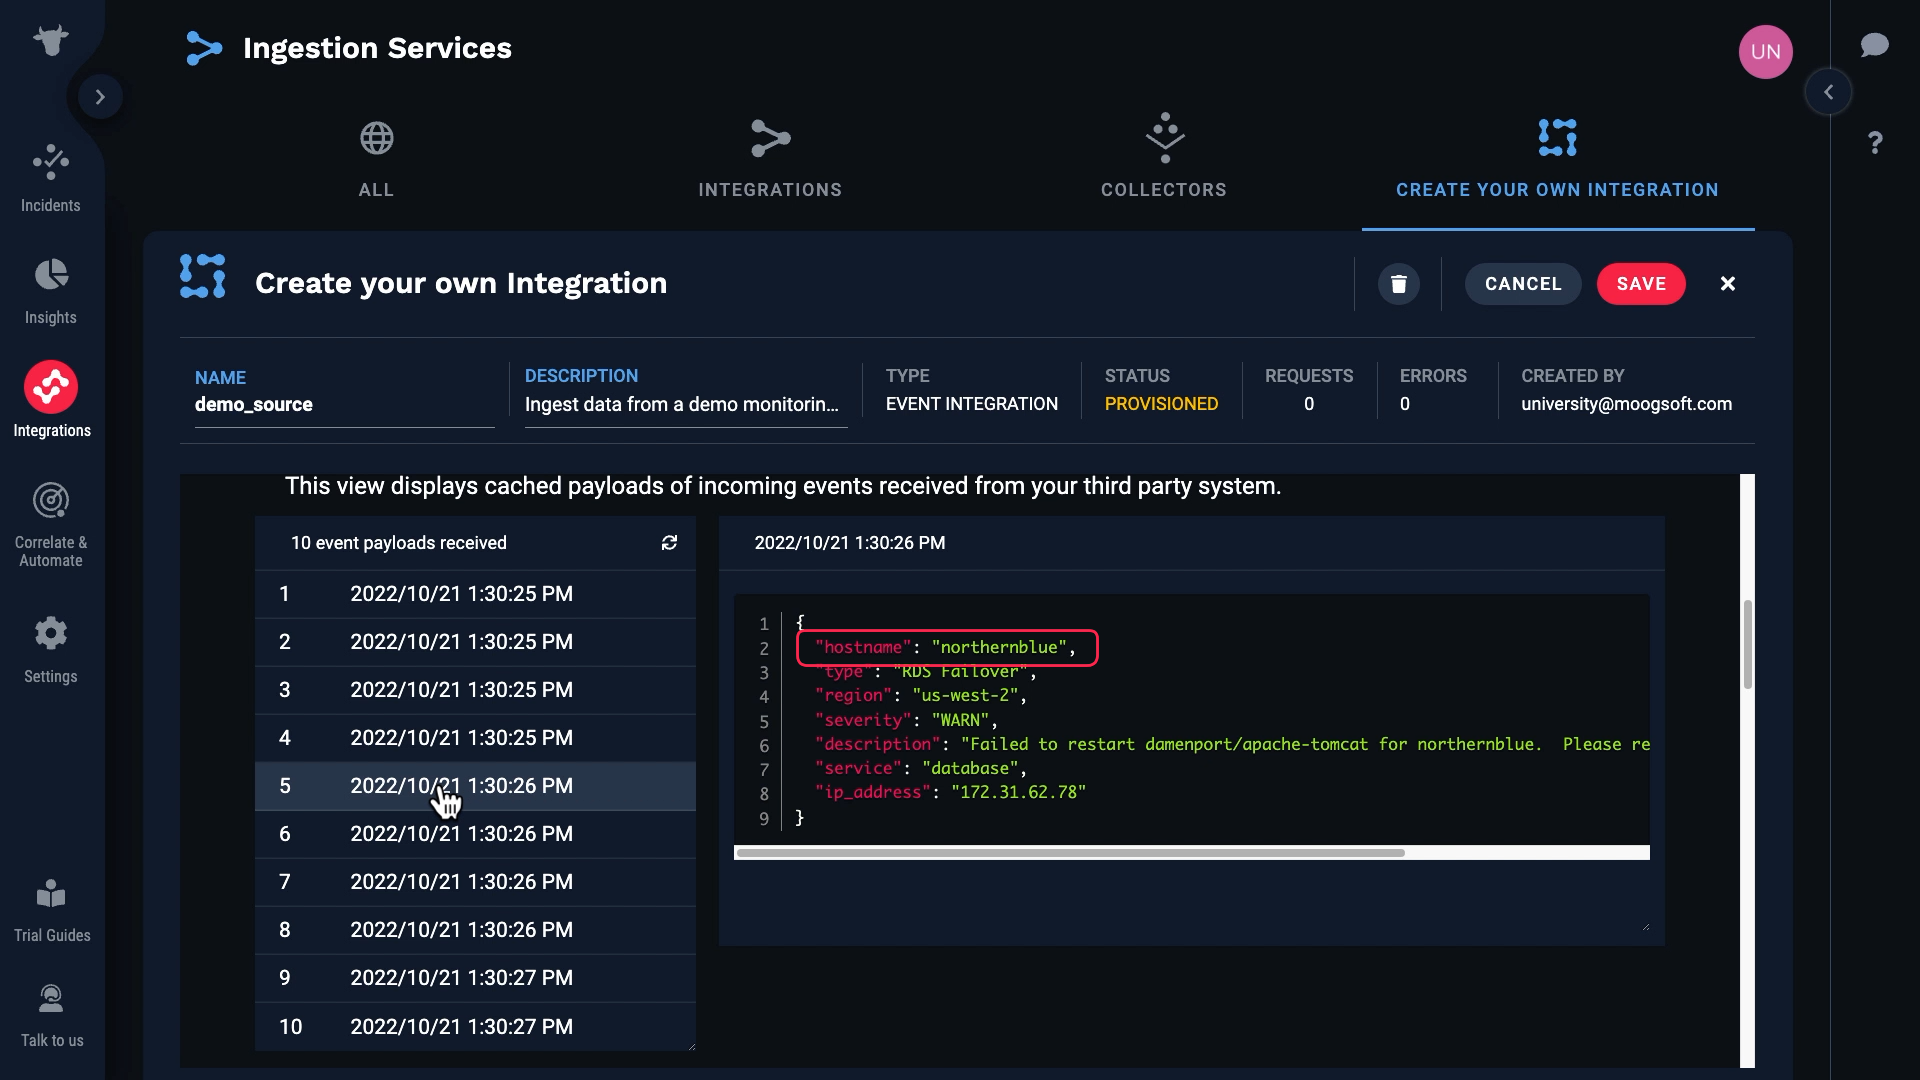
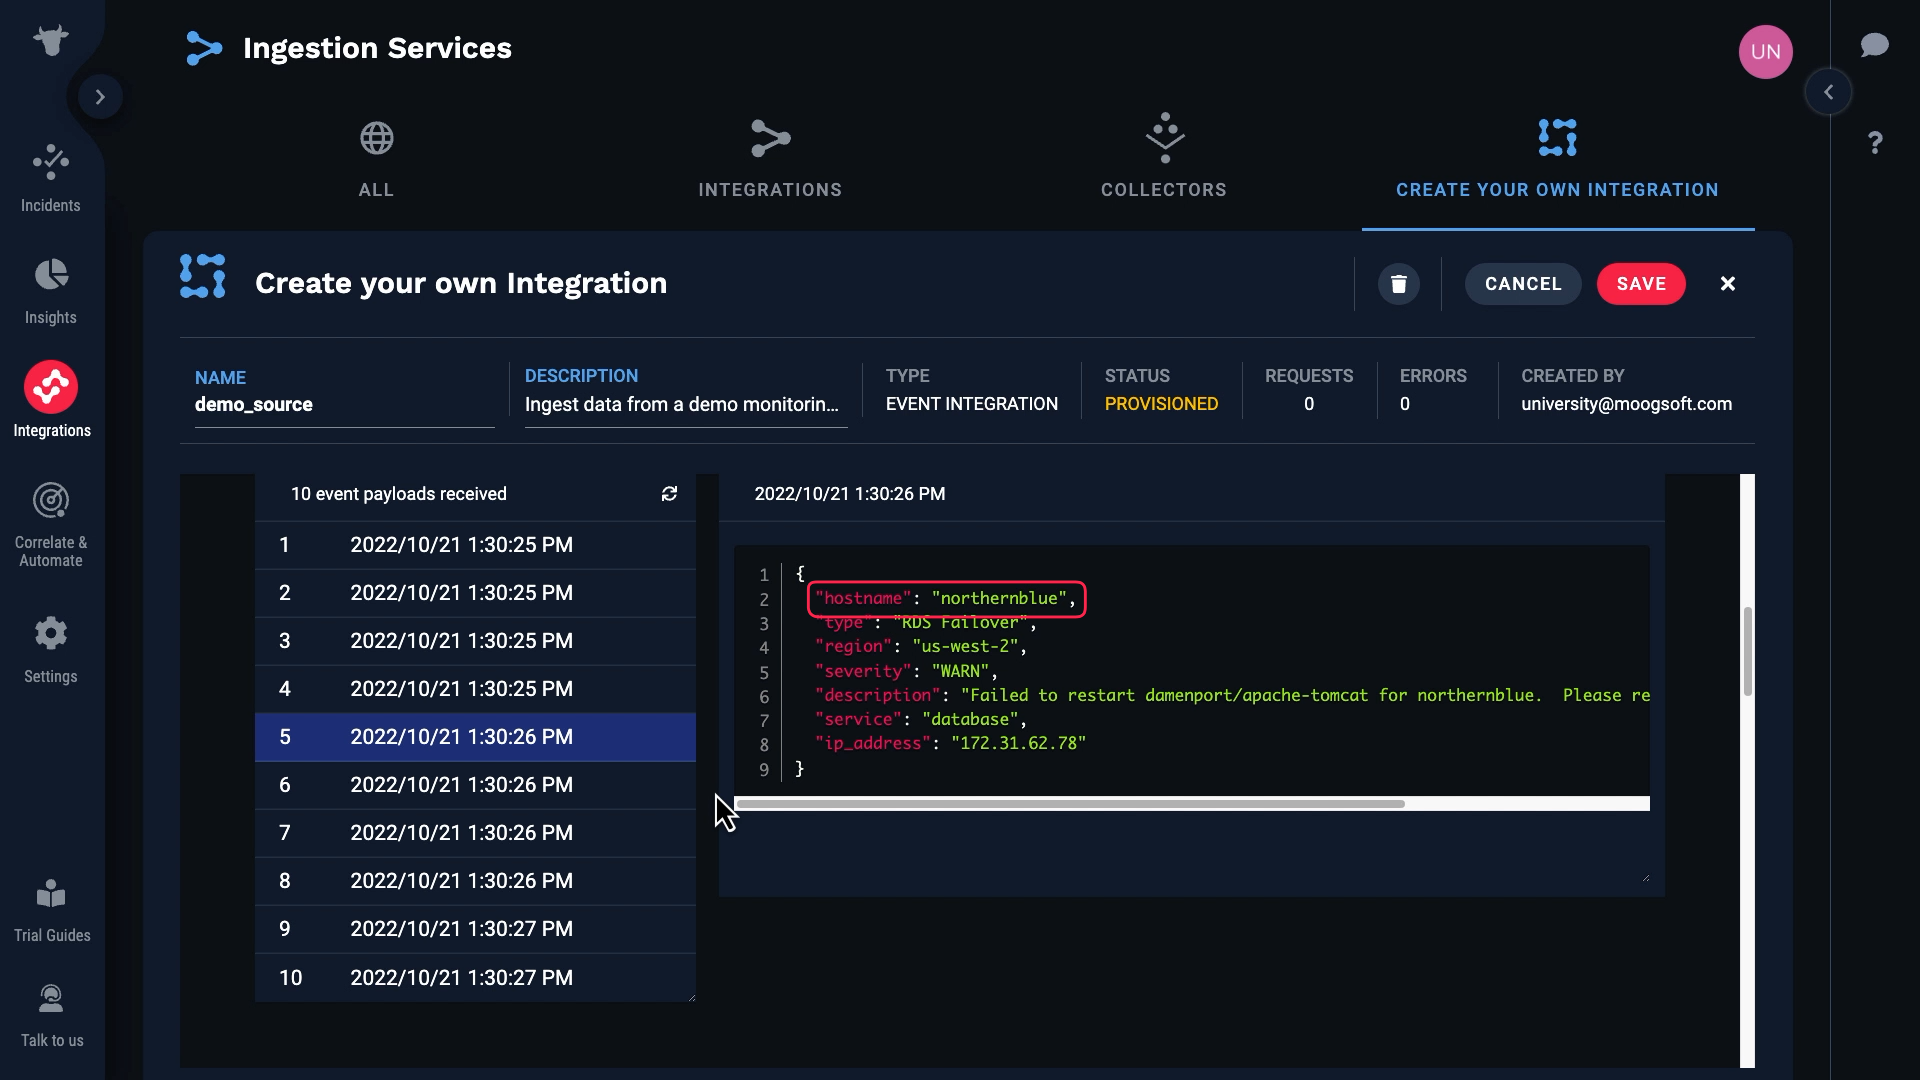
Note that some of these events have blank hostnames, and for some the hostnames are populated.
Let’s see how the payload and target fields line up. Incident Management automatically matched the obvious ones.
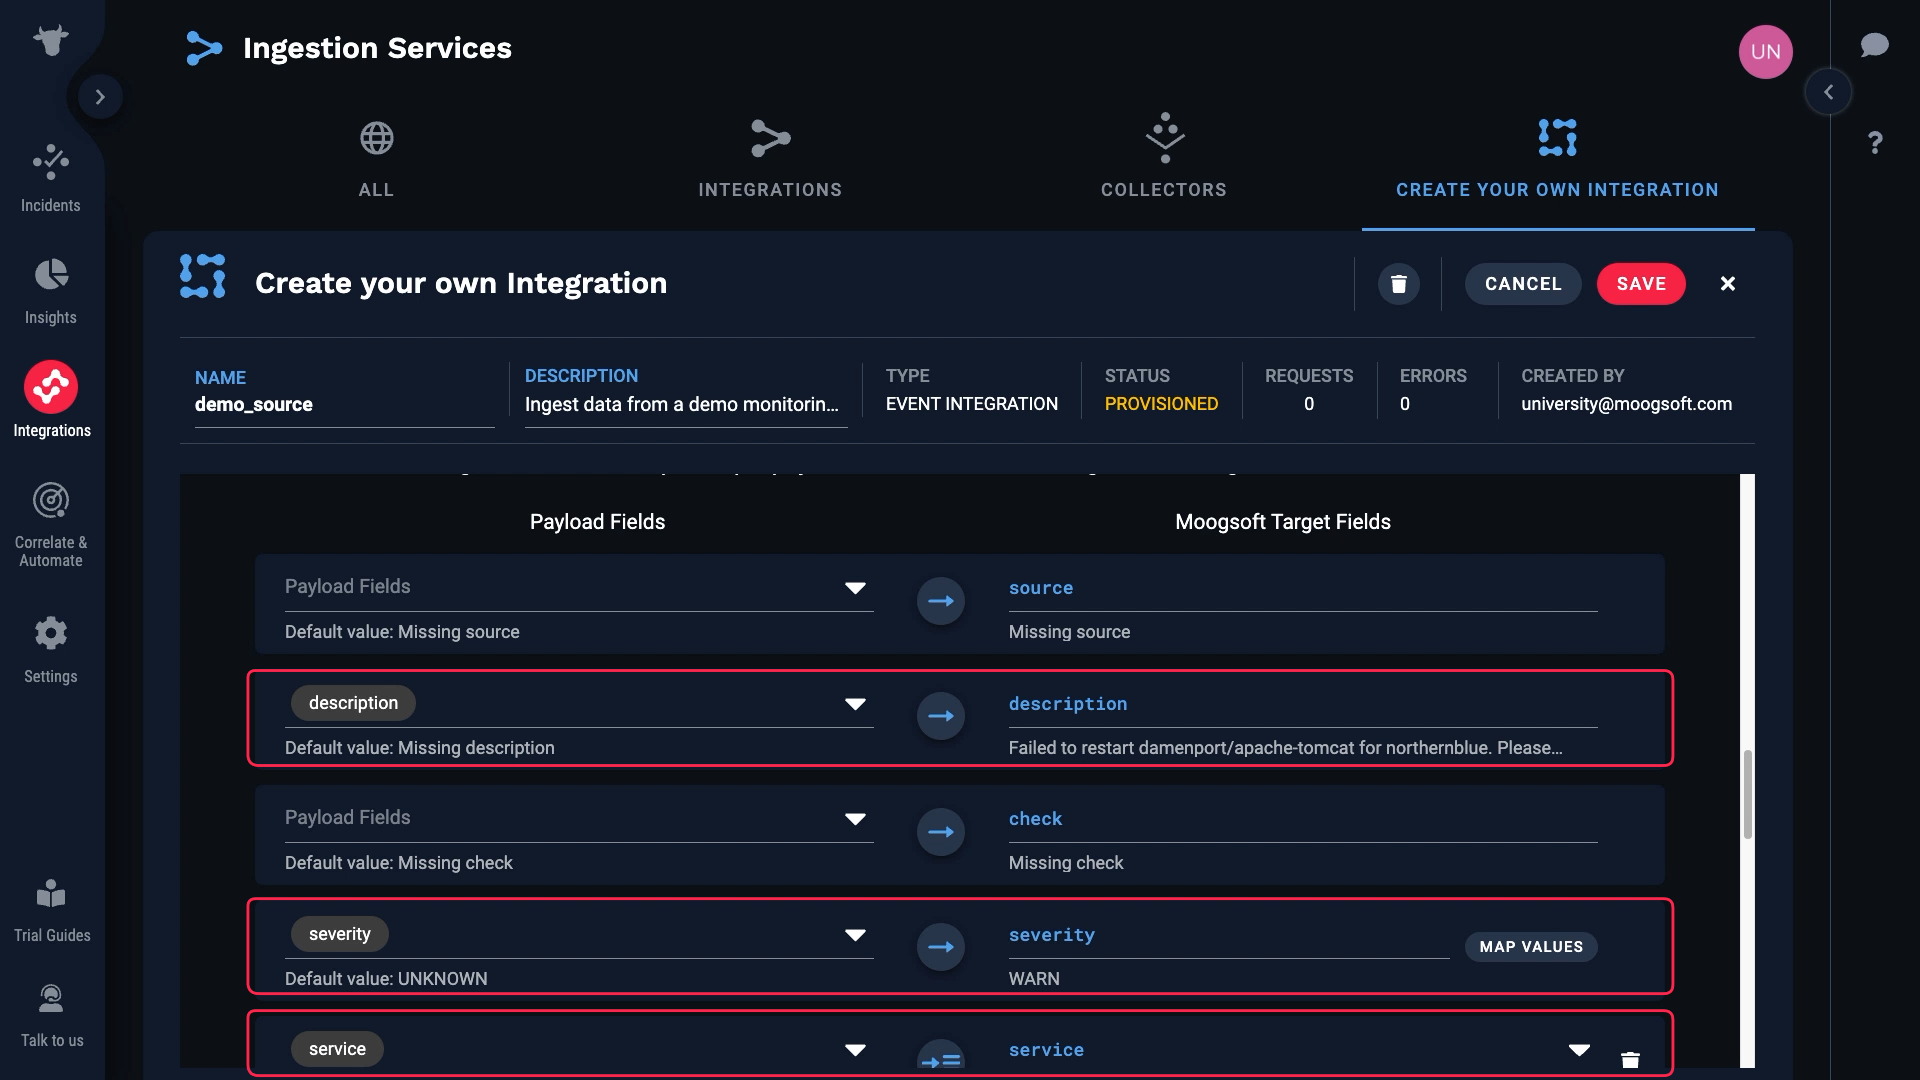
We don’t have a value for source, which is a required field. So we need to map something to that field.
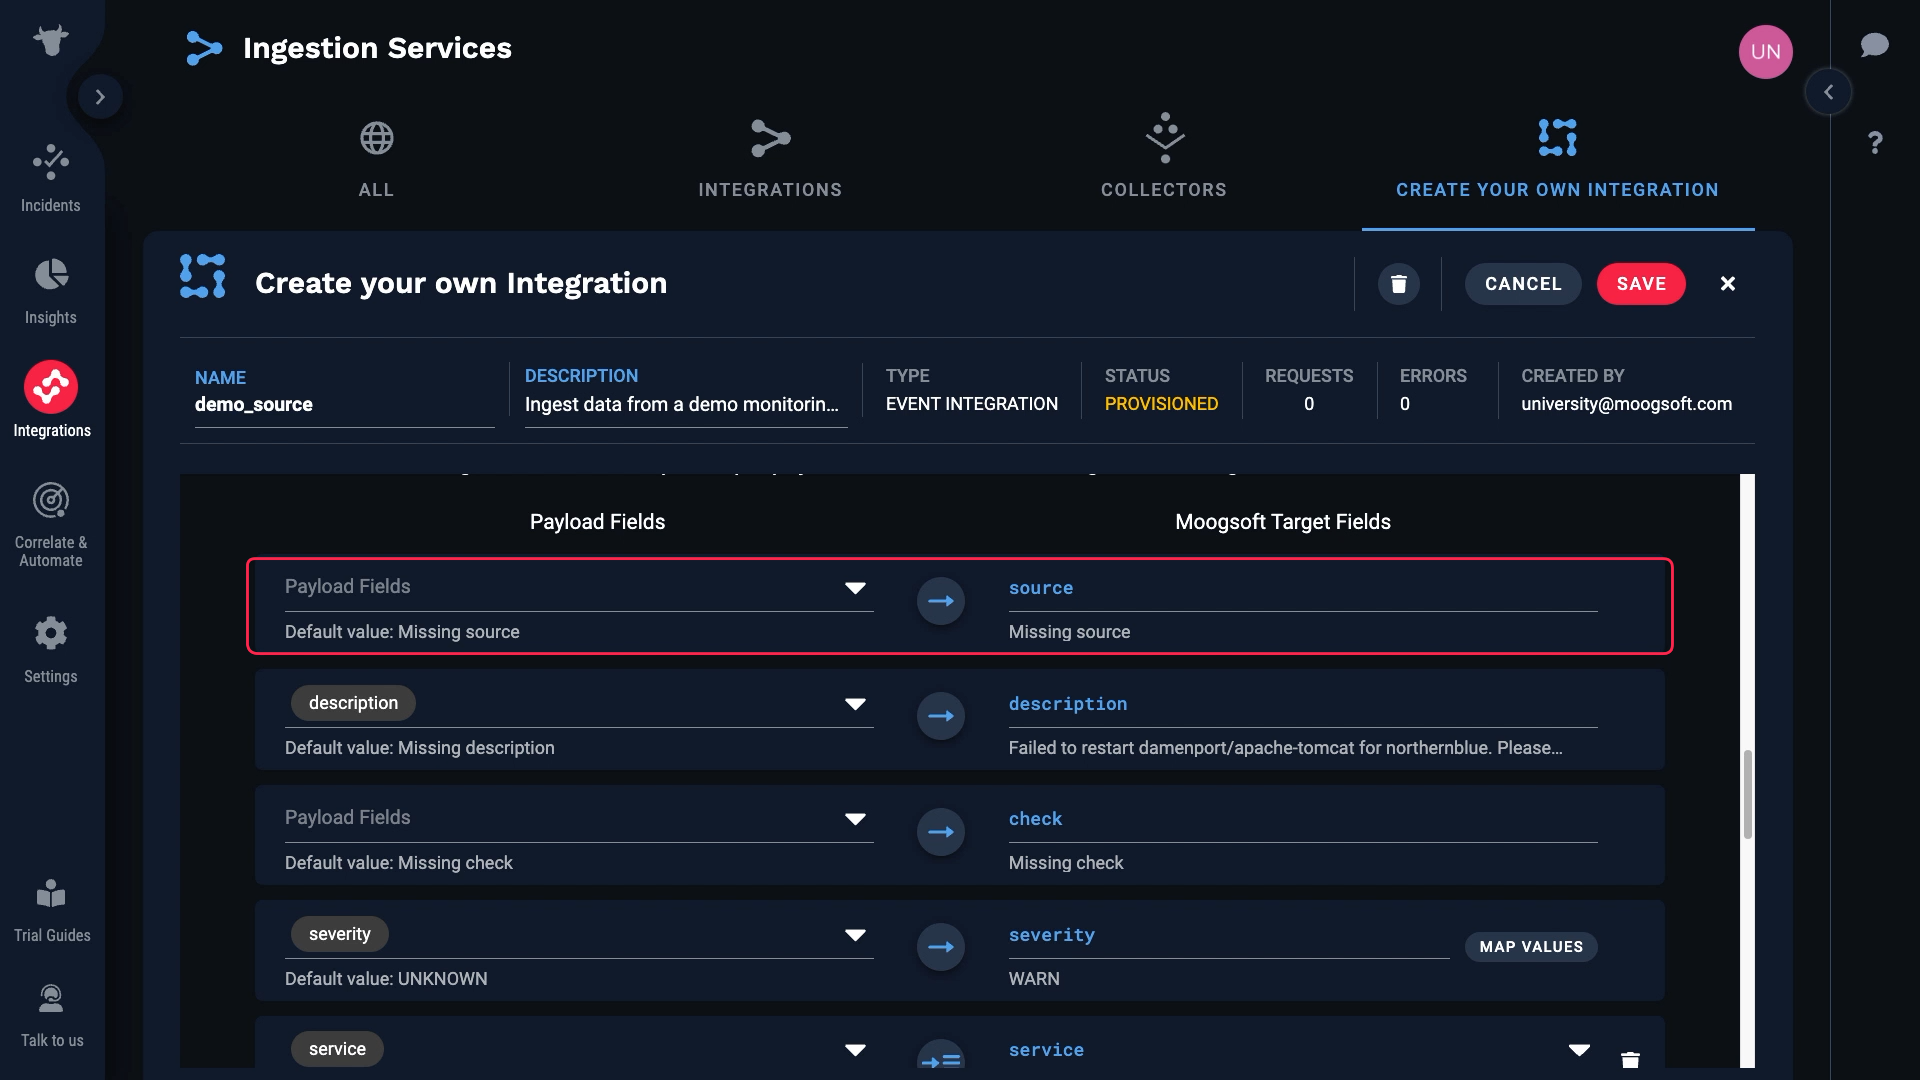
Let’s look at the data again. We want to map hostname to source, but we know it’s blank in some cases, and required fields can’t be blank.
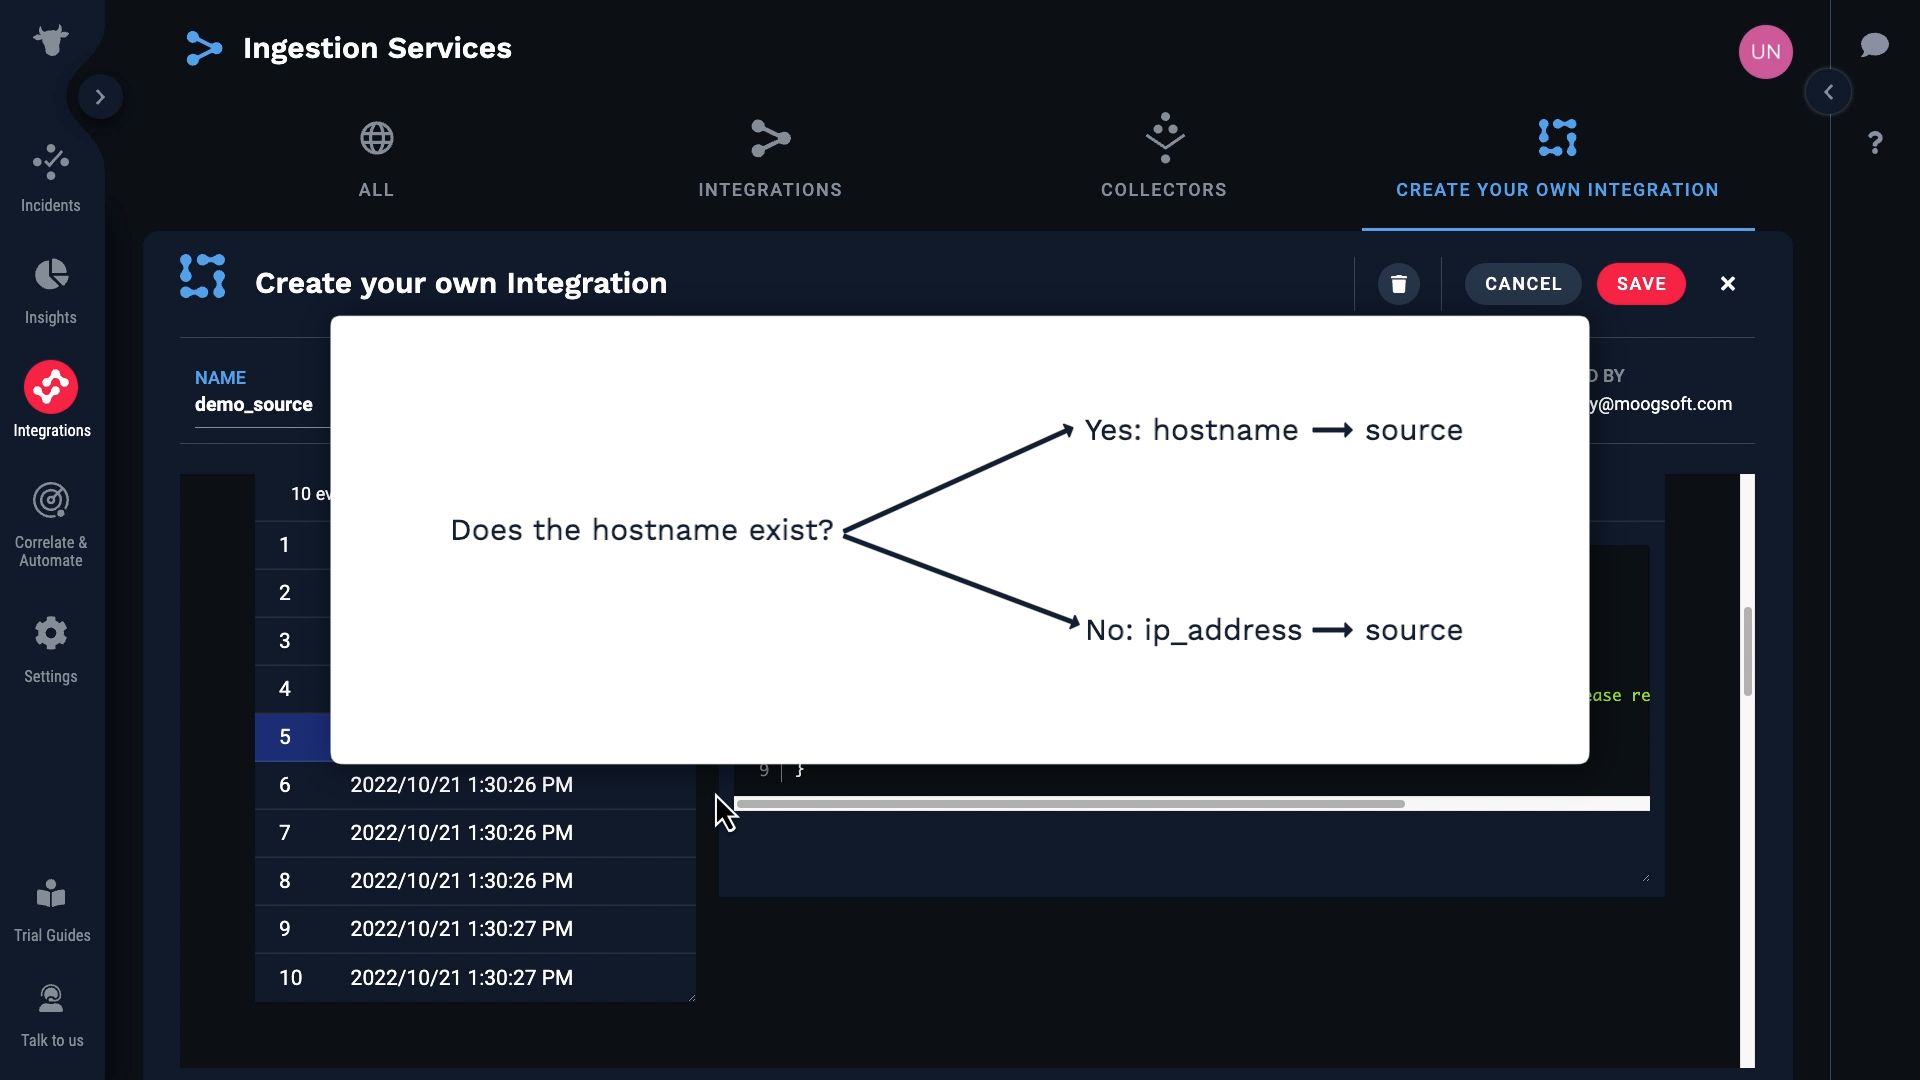
Let’s do this. We’ll map hostname to source if it exists, and if not we’ll use ip_address.
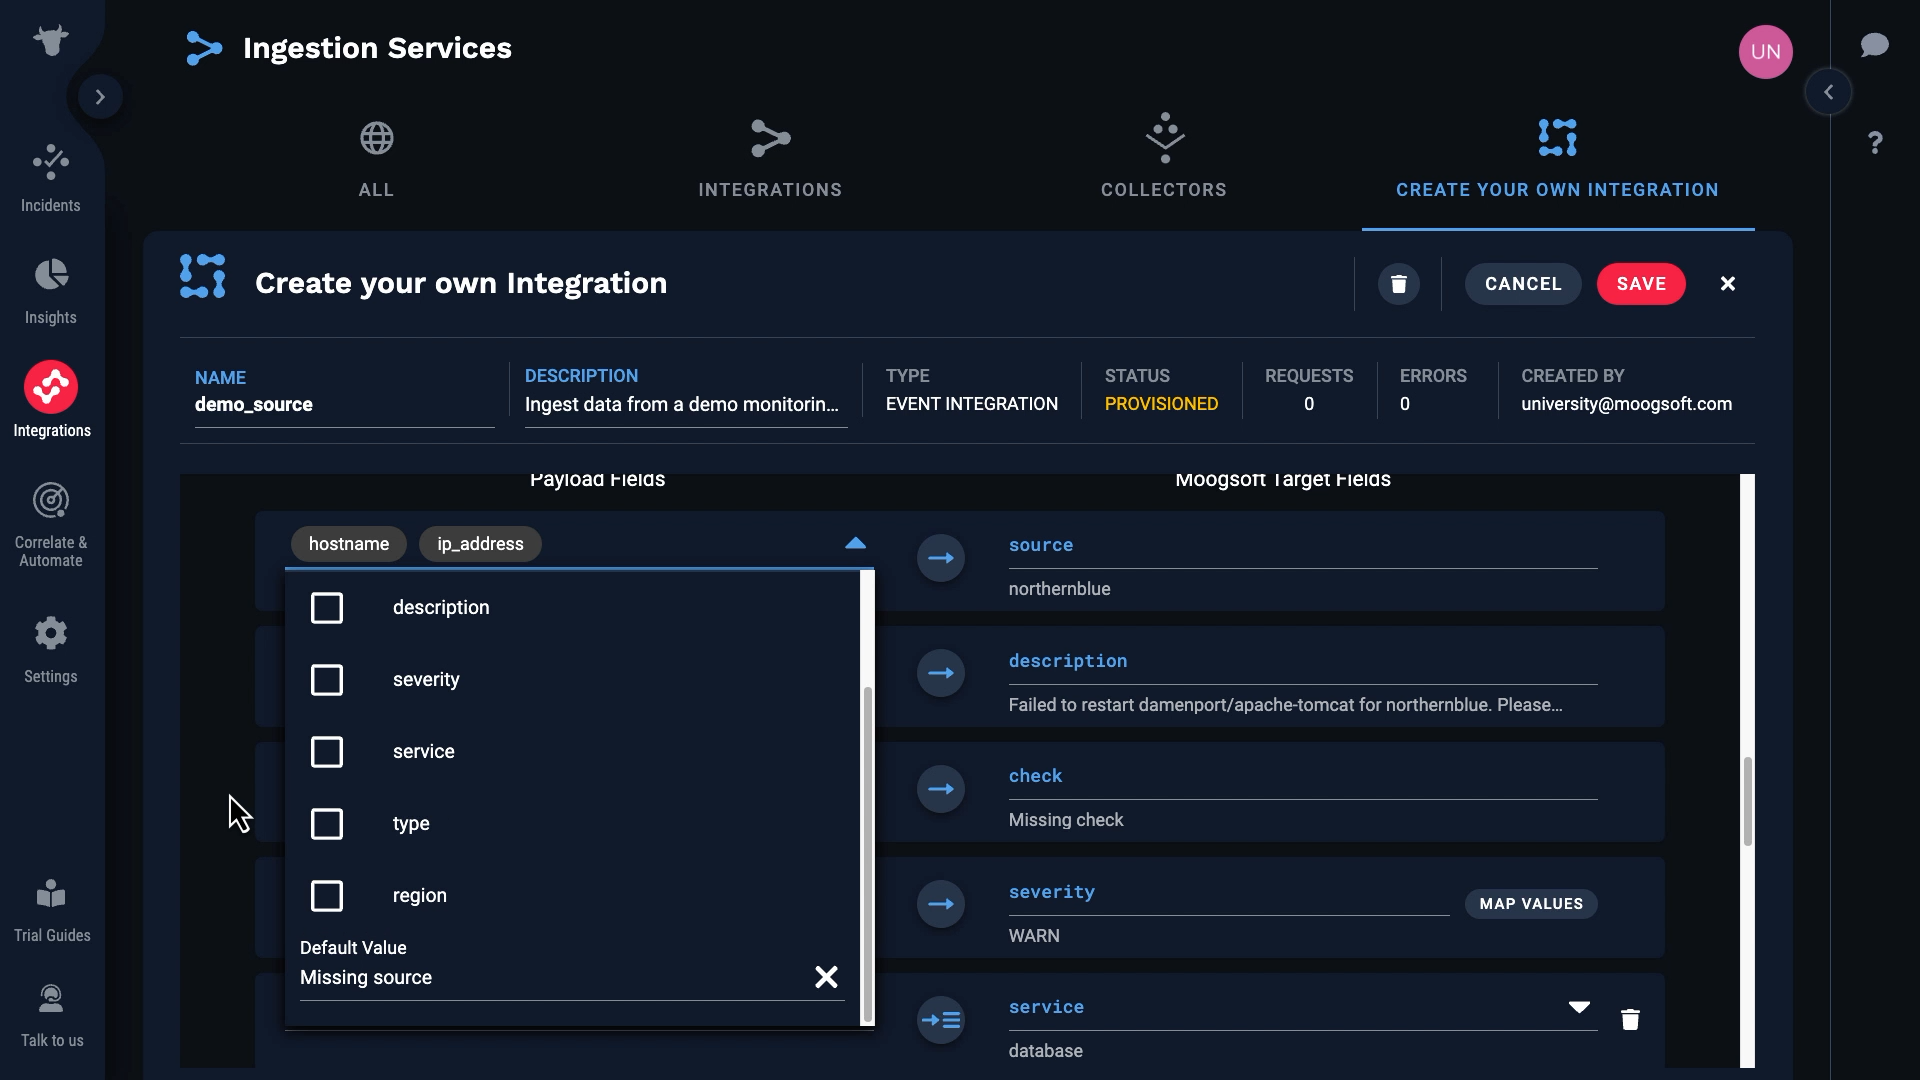
We’ll map hostname to source first. Then we’ll add a second mapping, and map ip_address. Incident Management will use the first mapping if a value exists and is valid. Otherwise, it will move on and use the next mapping.
This defines the condition that generates the event.
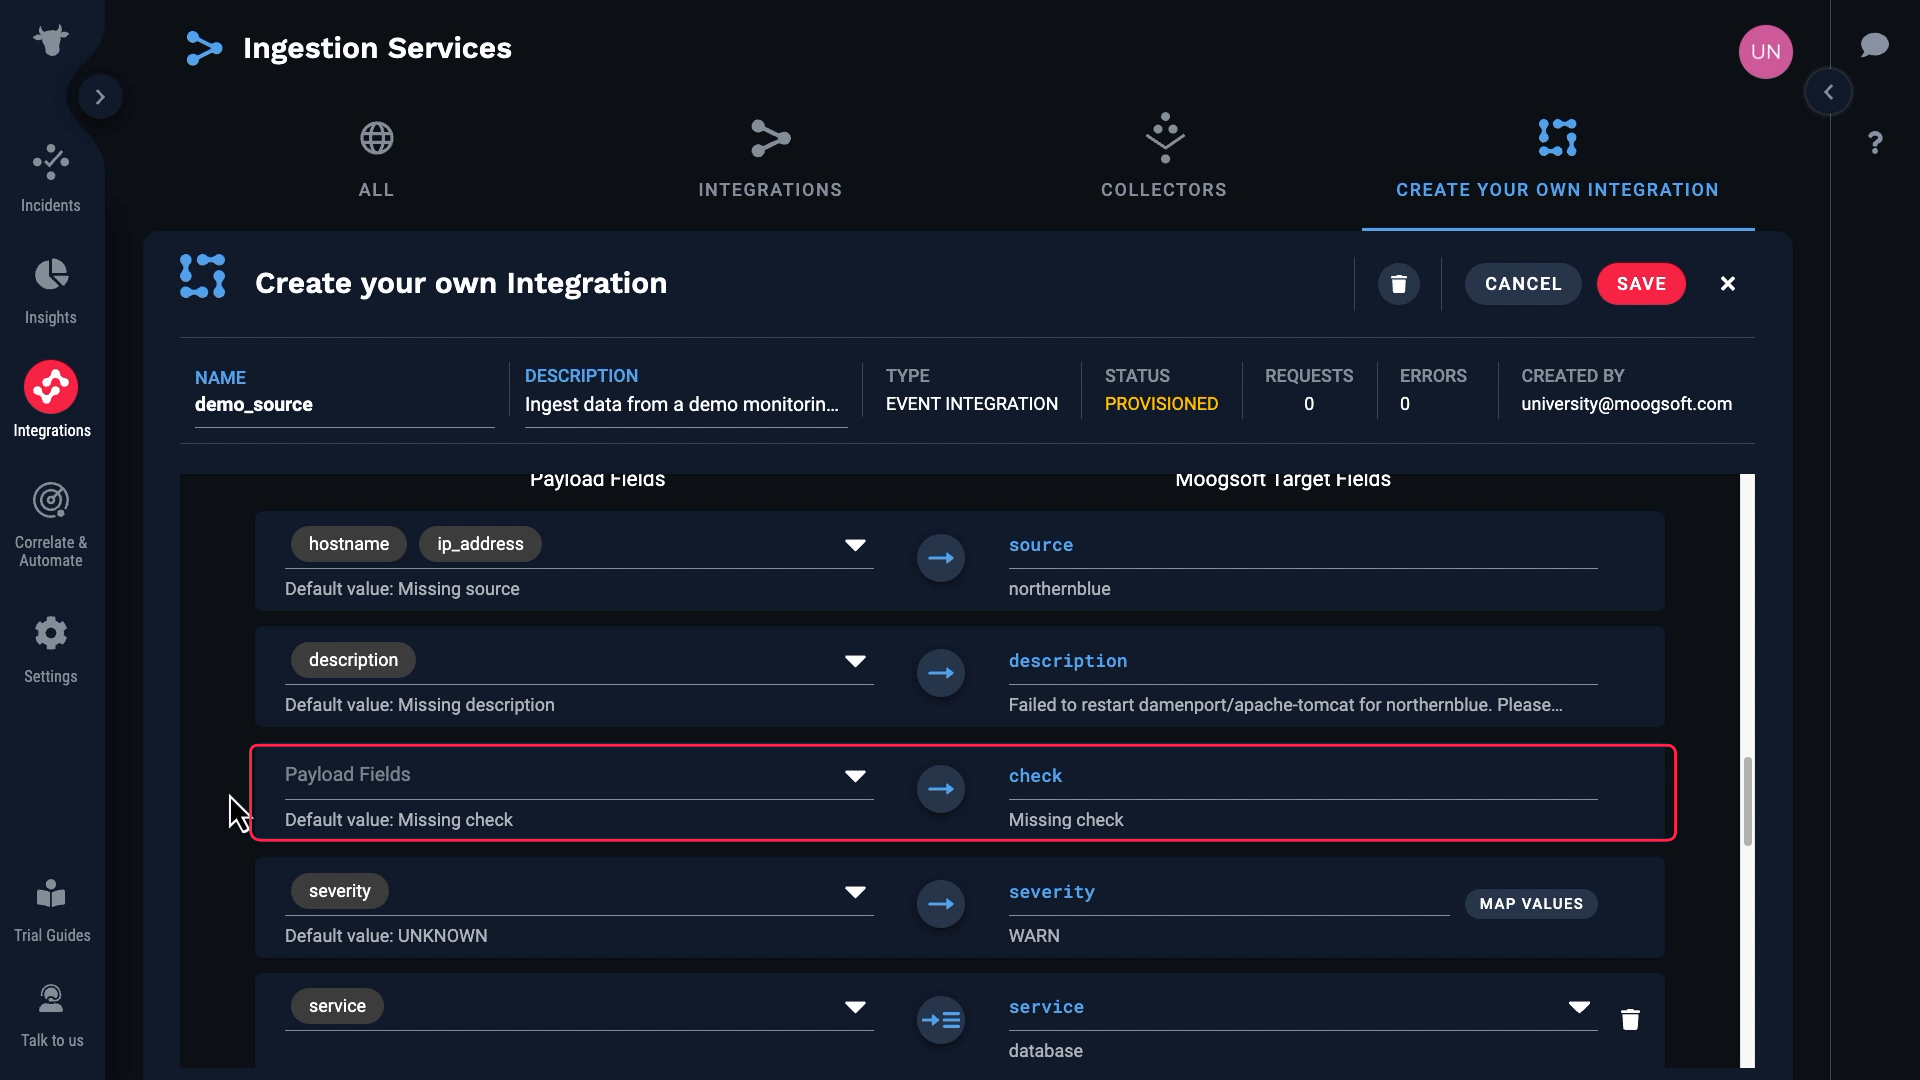
We’ll map the Type field to check.
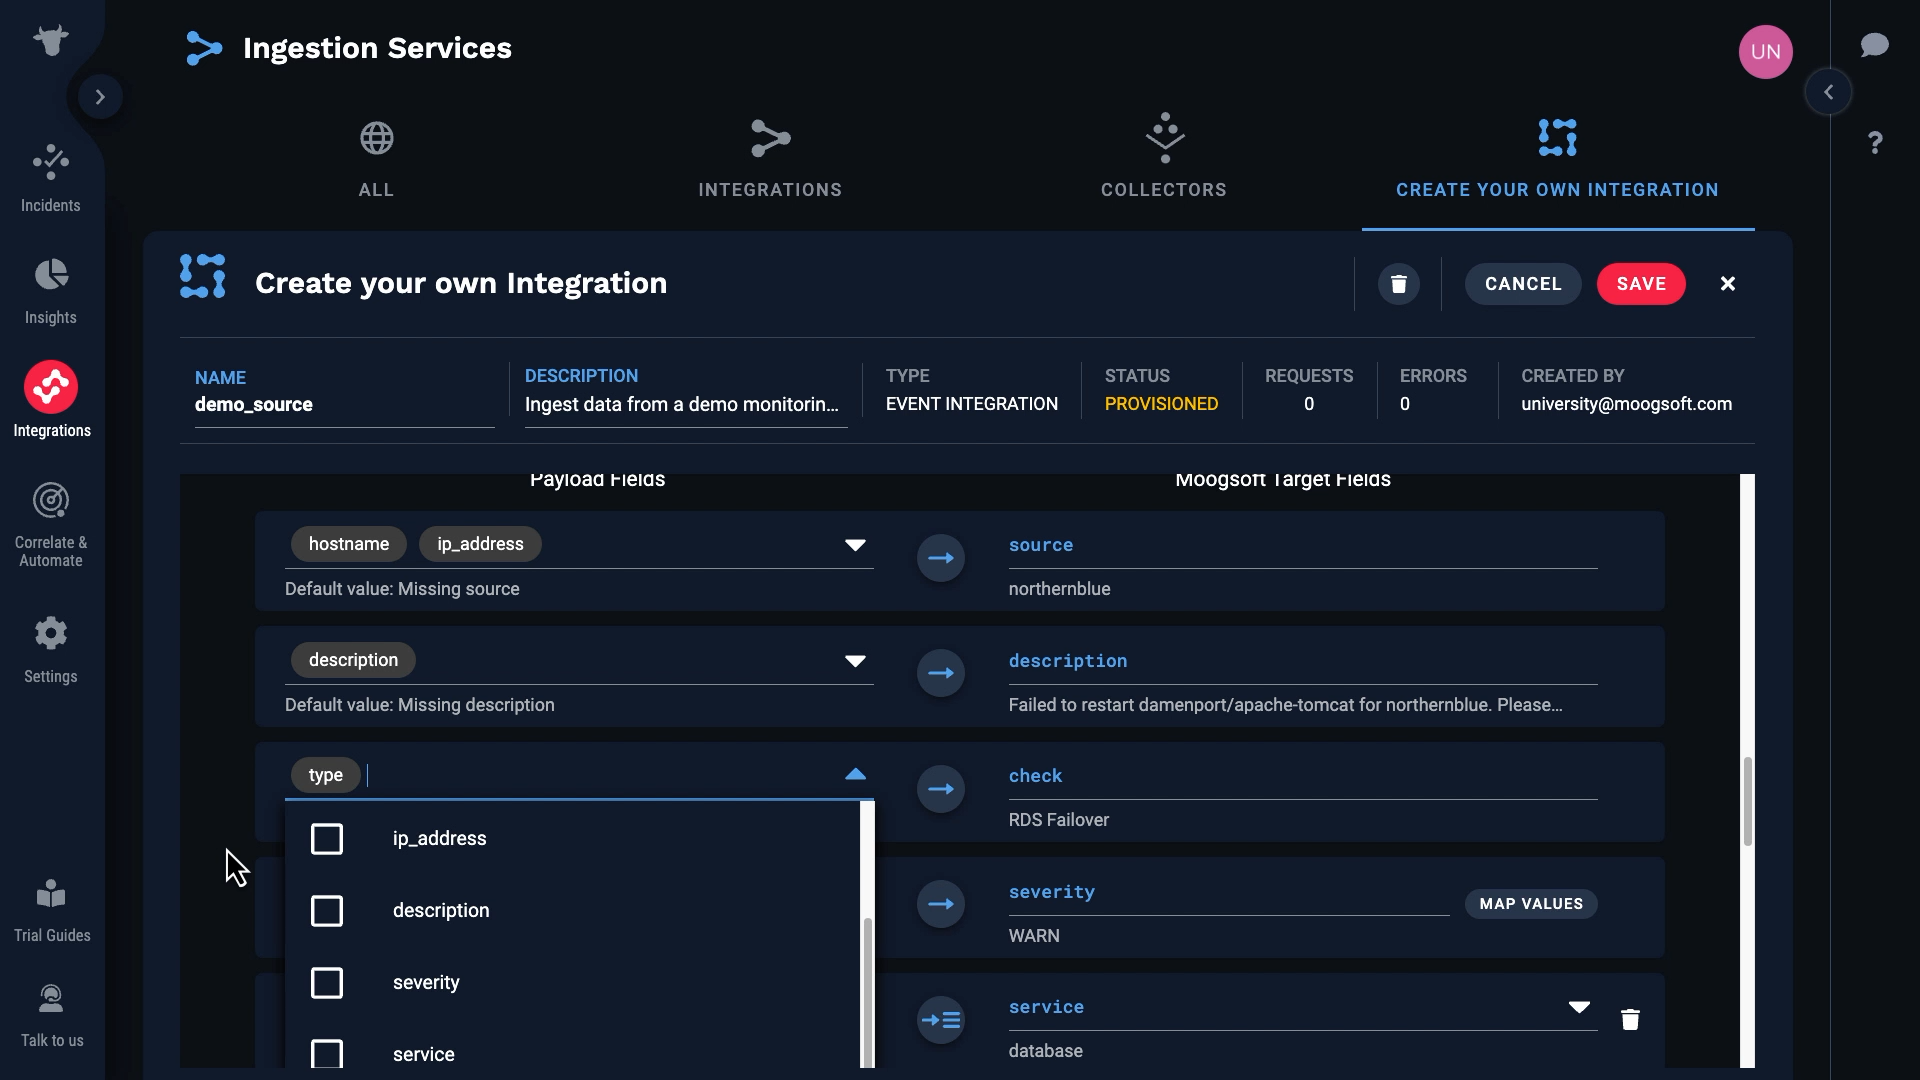
Next let’s take care of the severity. Our monitoring service has only four severity levels: NONE, INFO, WARN, and PROBLEM. So we’ll map them to the Incident Management severity levels like this...
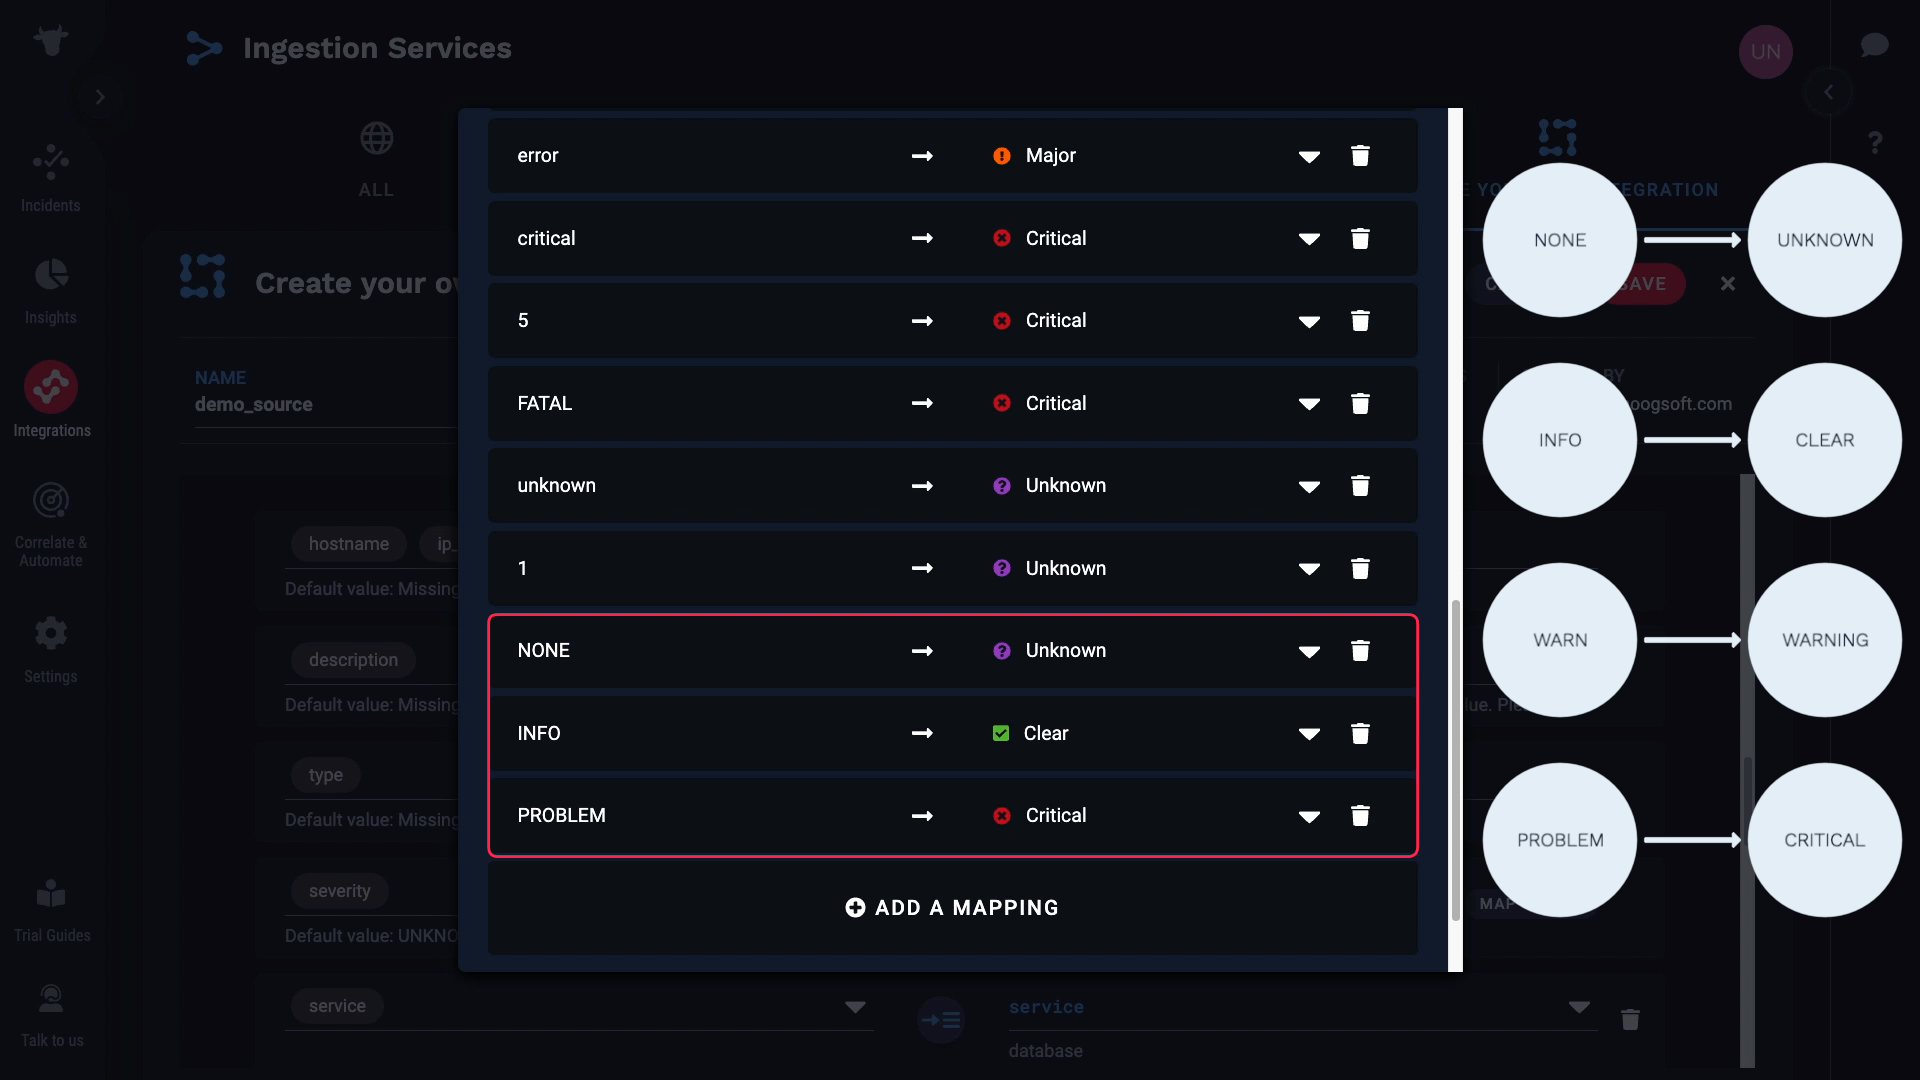
With that we took care of all the required fields. Let’s see what other fields we might want to bring in. Let’s say we want to keep region. And let’s add a custom tag for ip_address.
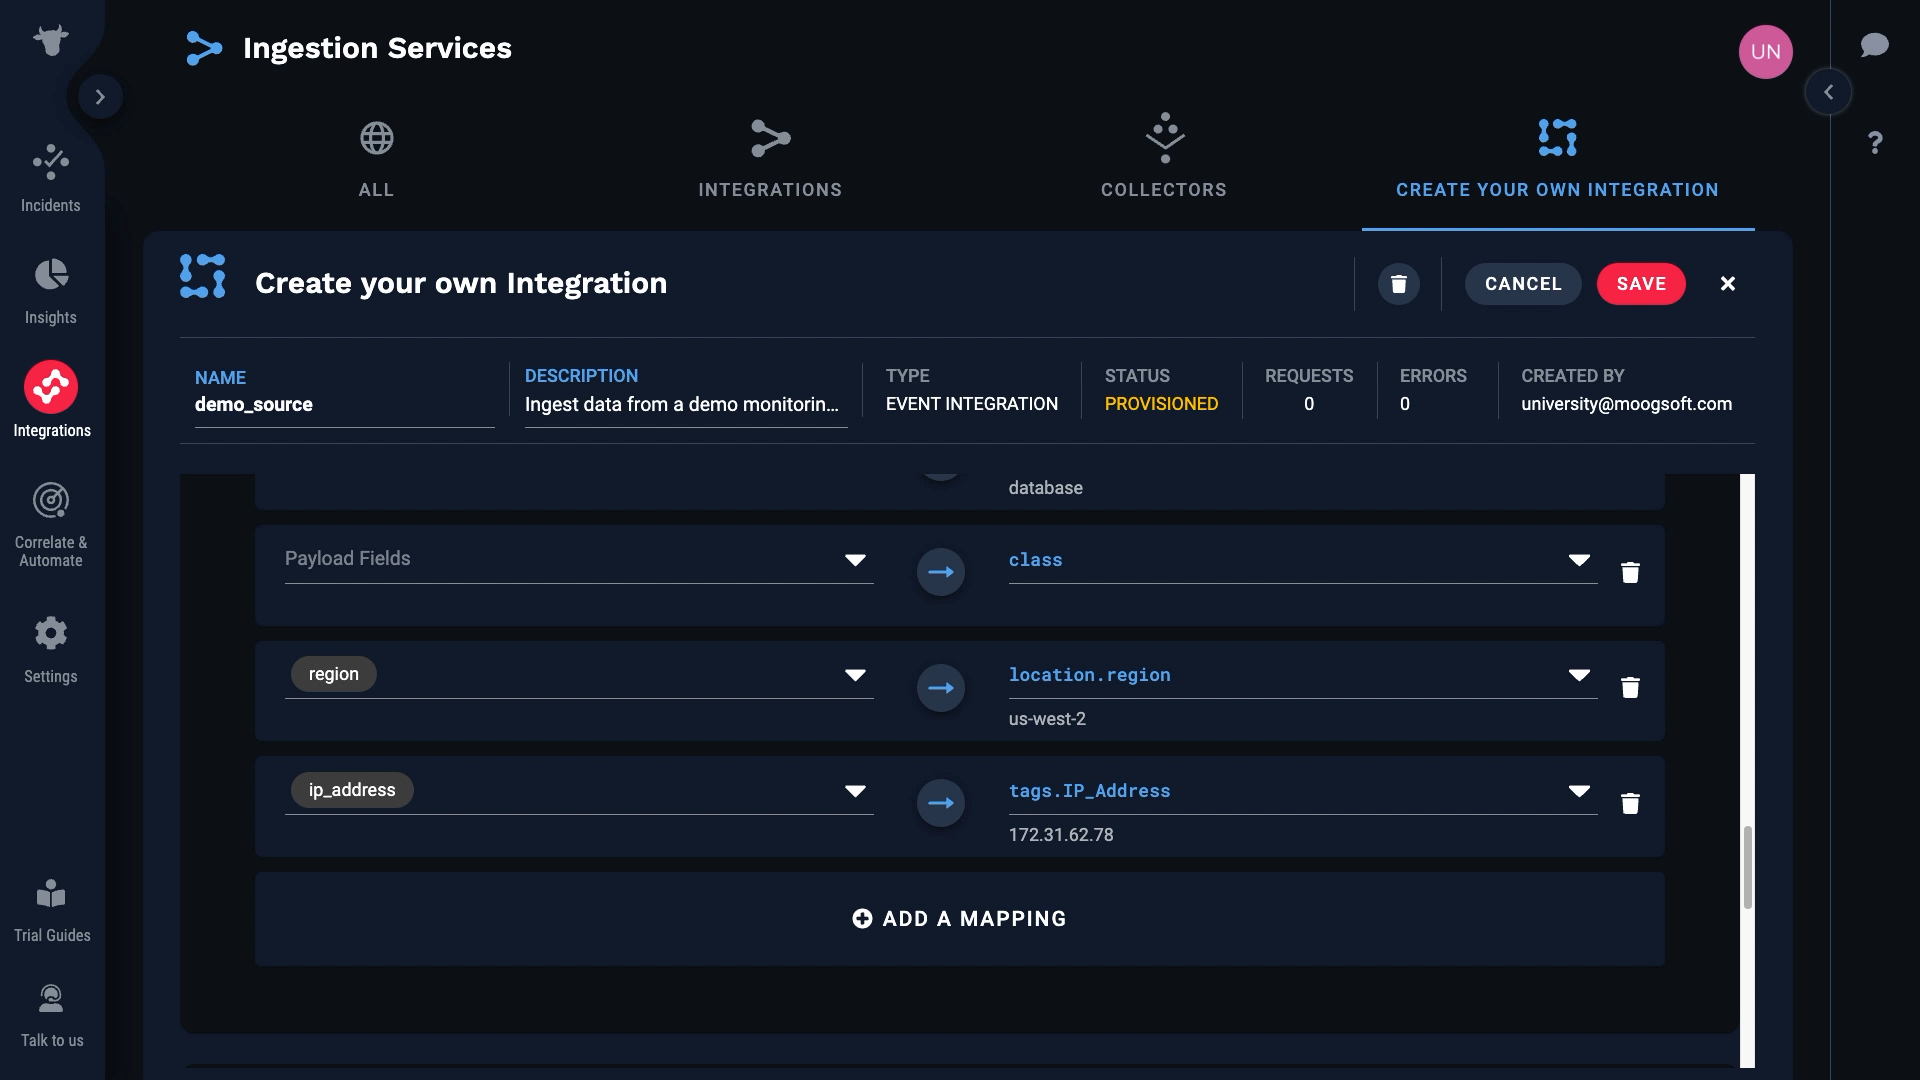
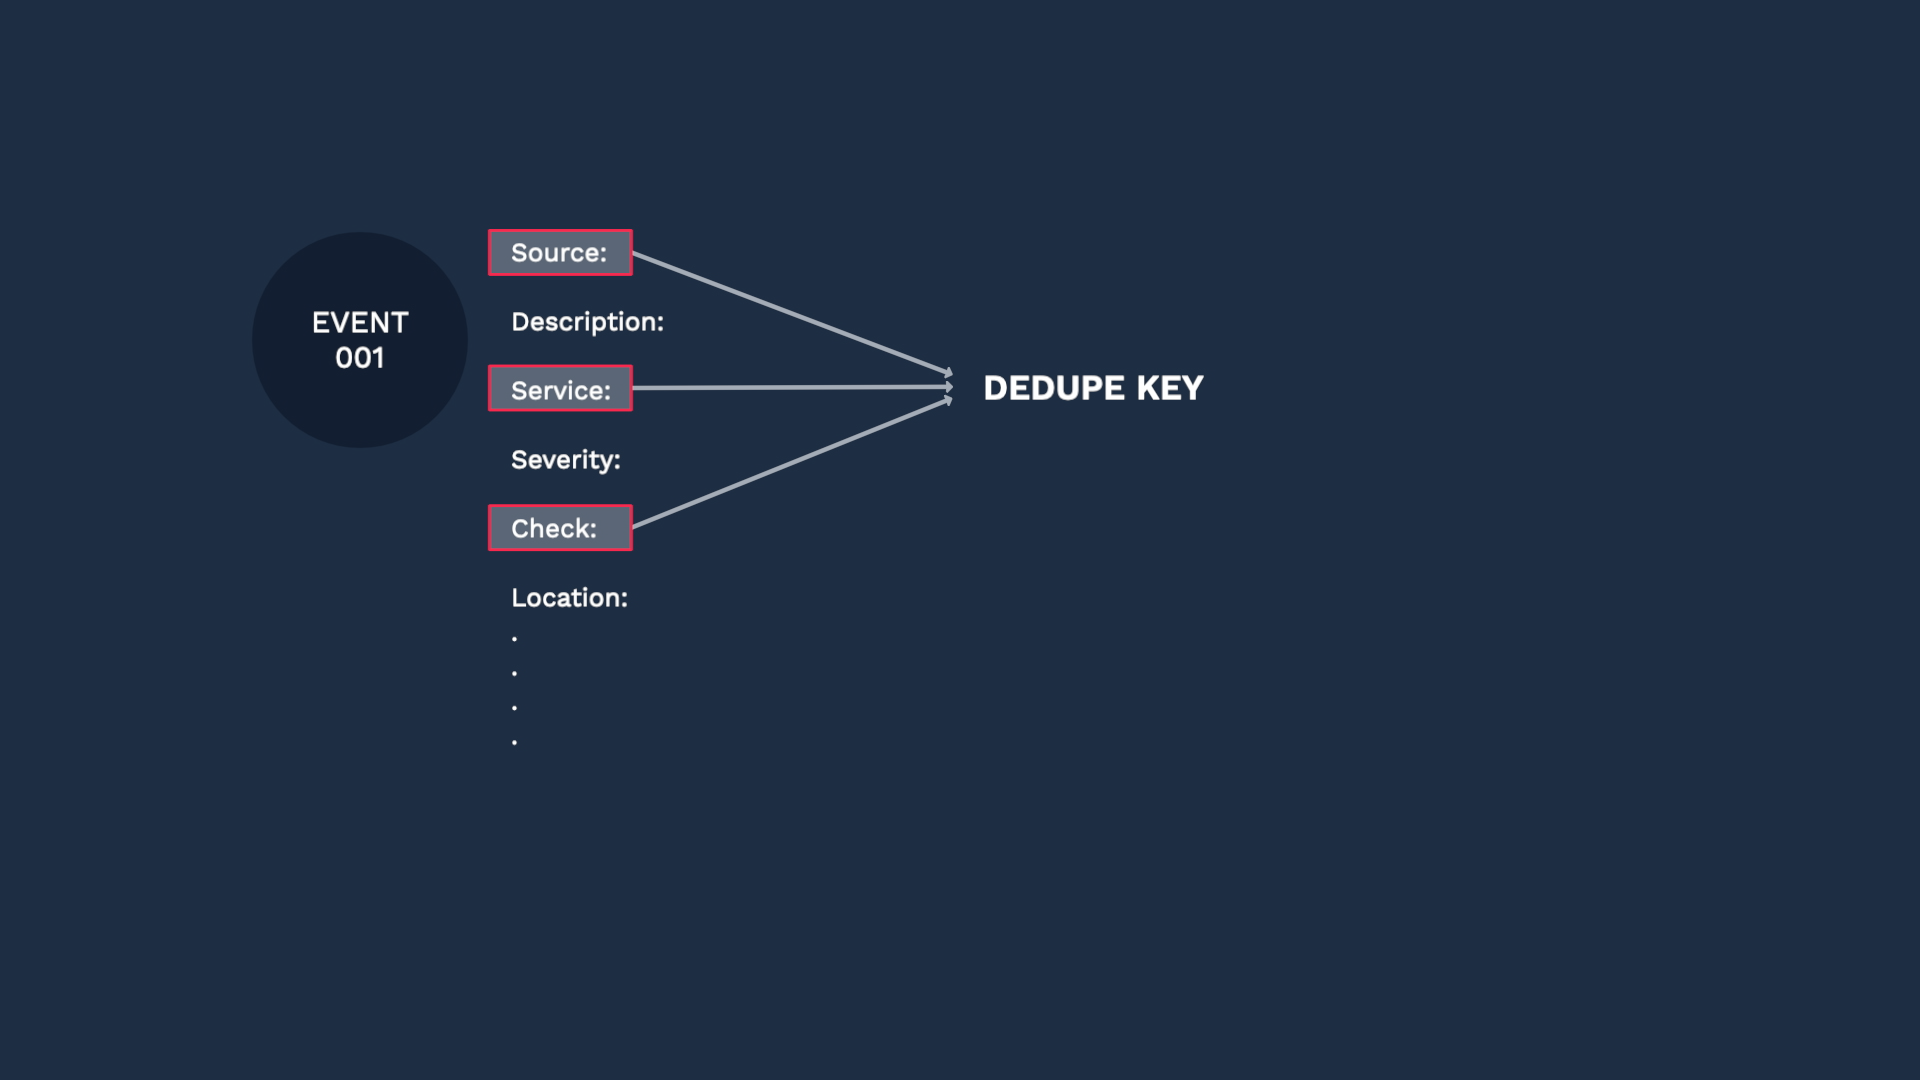
The last step before we save our integration is to configure the deduplication key. Here’s how deduplication works. Incident Management uses the fields in the deduplication key to assign multiple events to the same alert and reduce noise. The idea behind deduplication is that events with the same context should become part of the same alert.
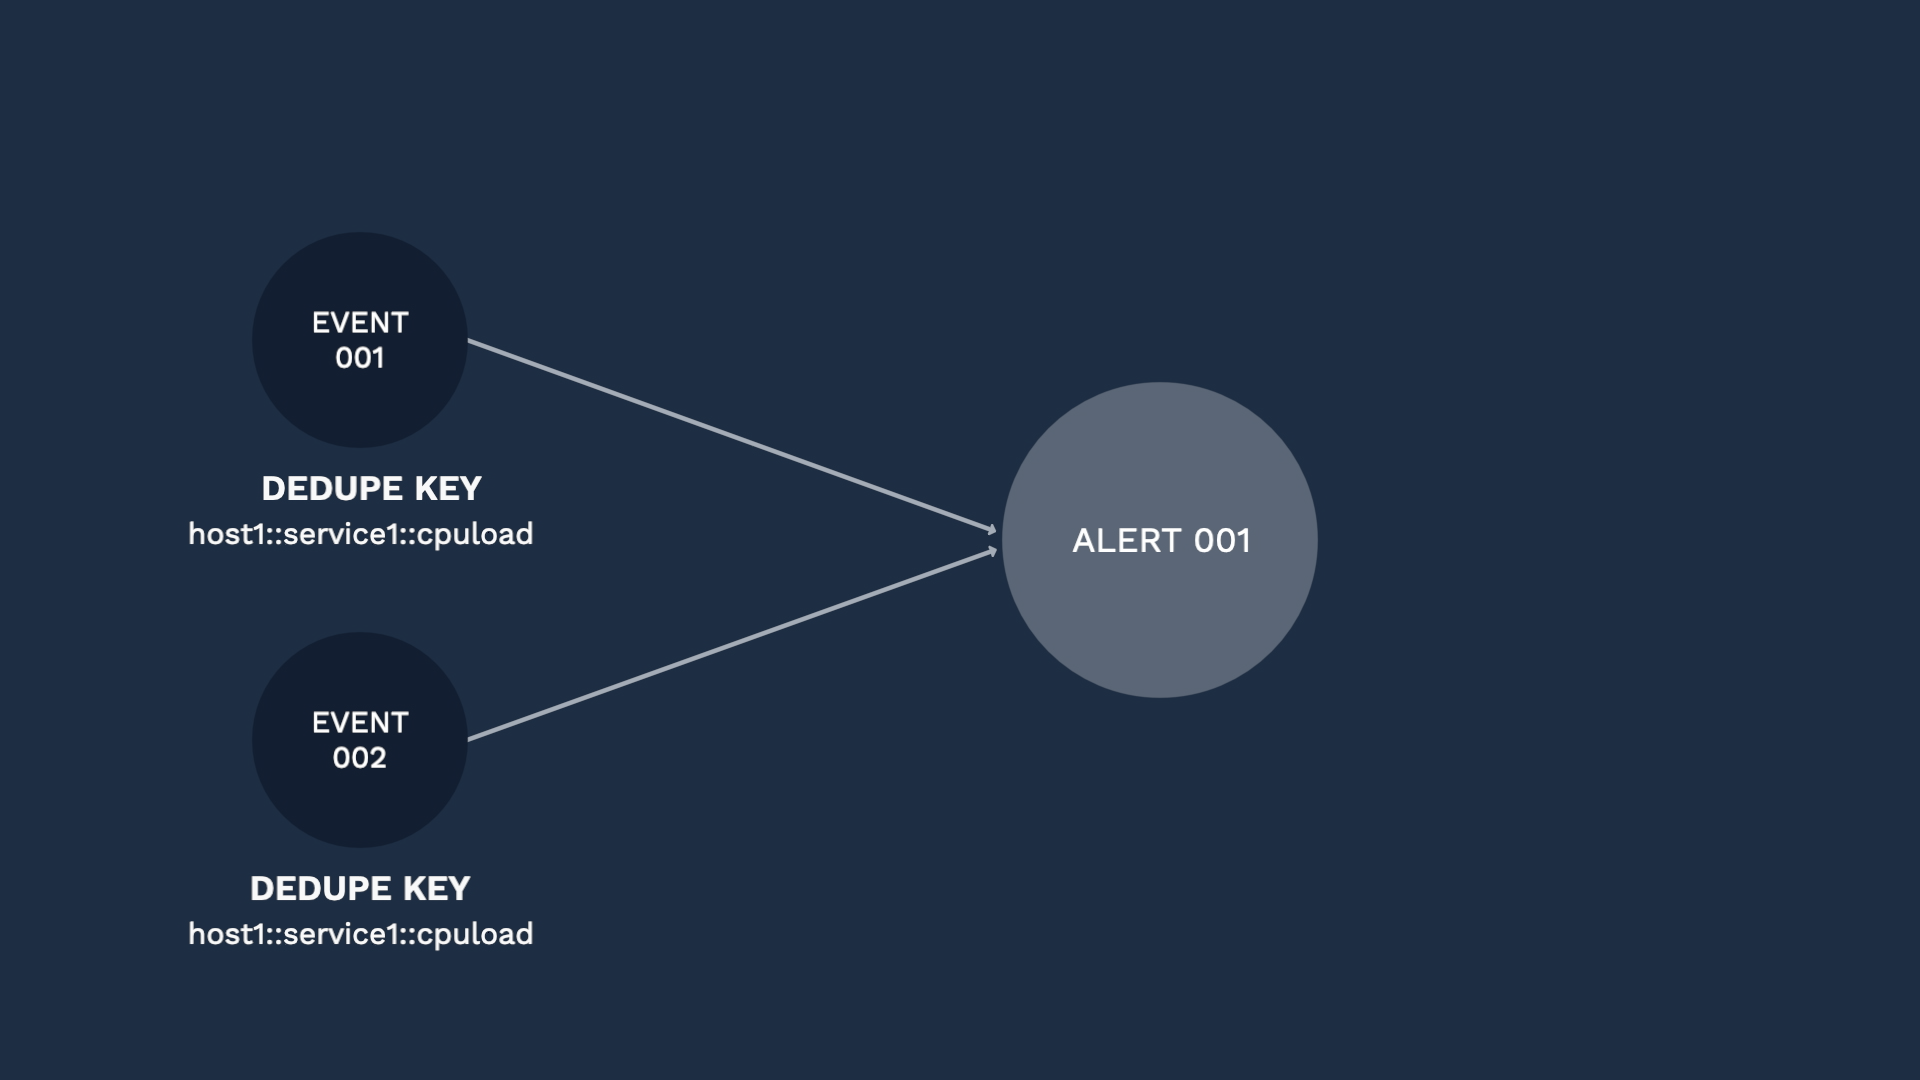
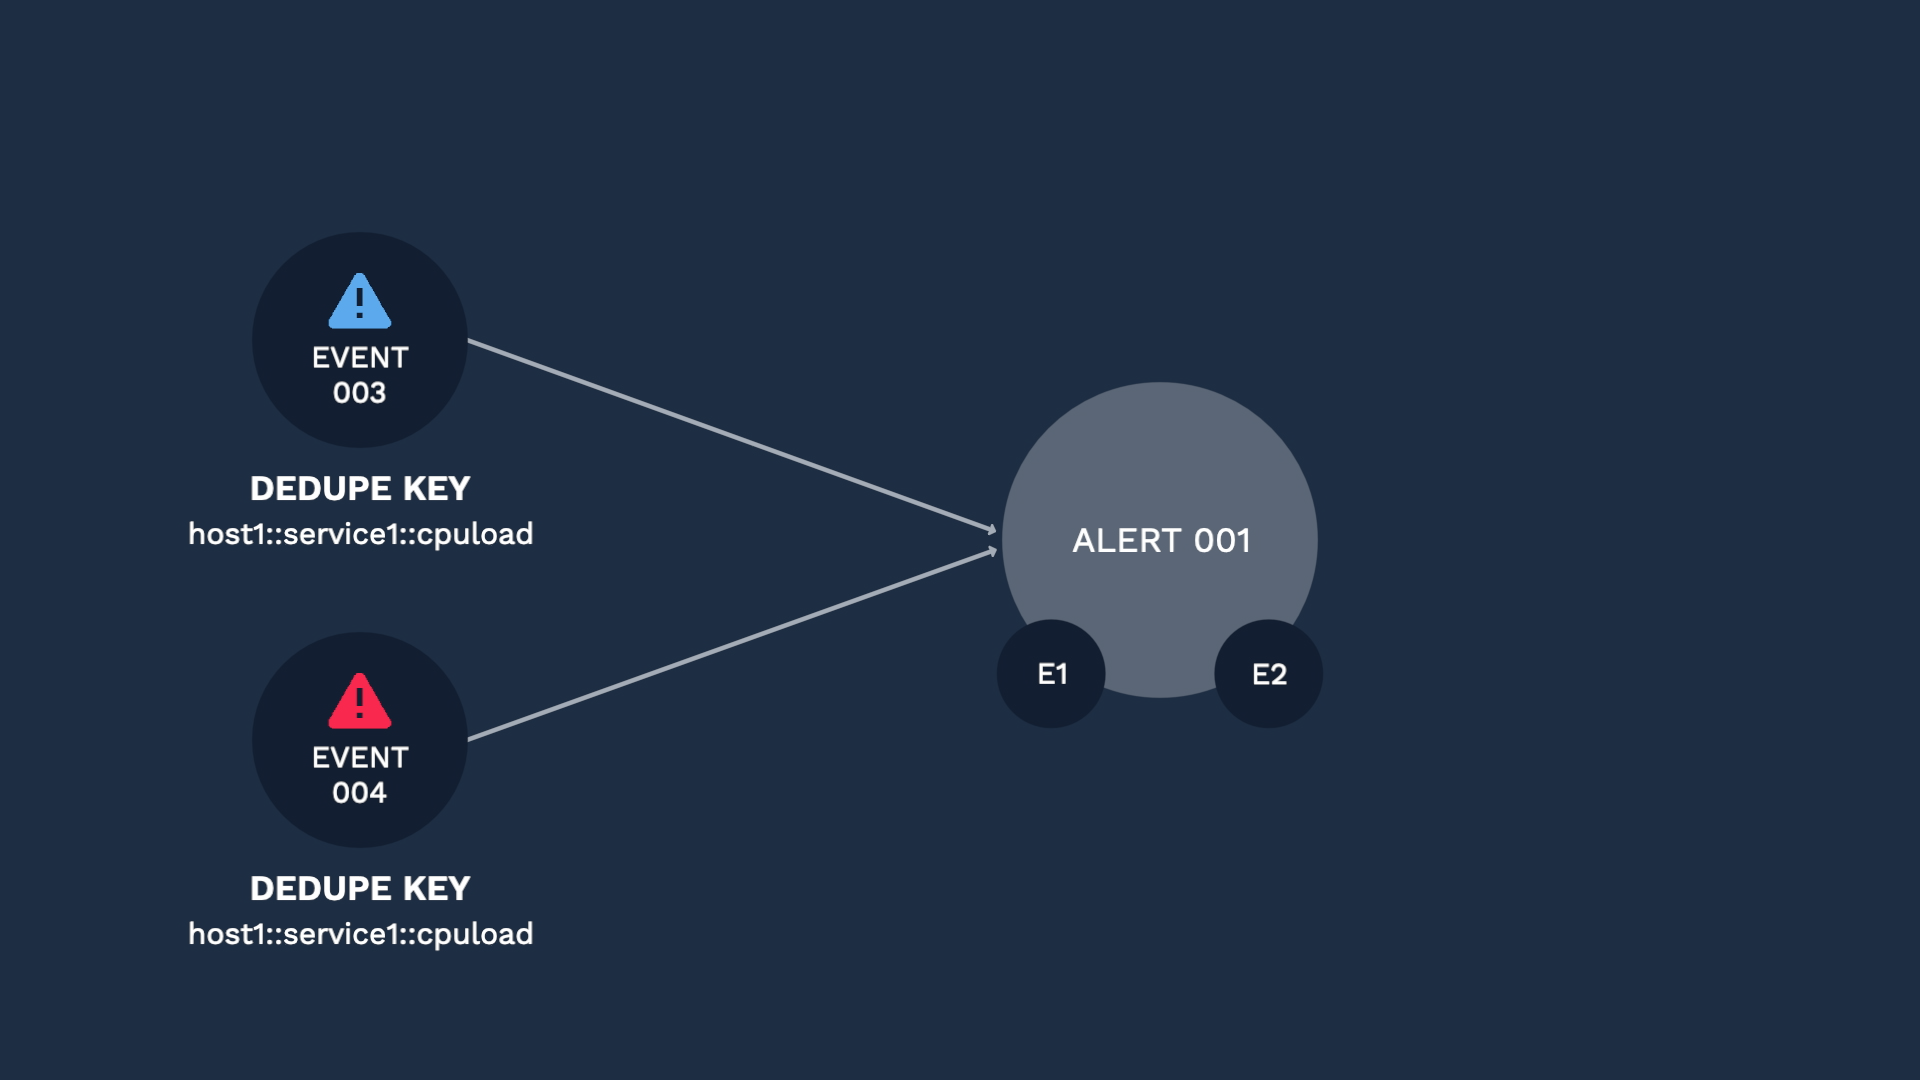
For example, we might find out about a condition that affects one of our hosts with a warning event, which then escalates to a critical event. Since the key context is the same, Incident Management would assign those events to the same alert.
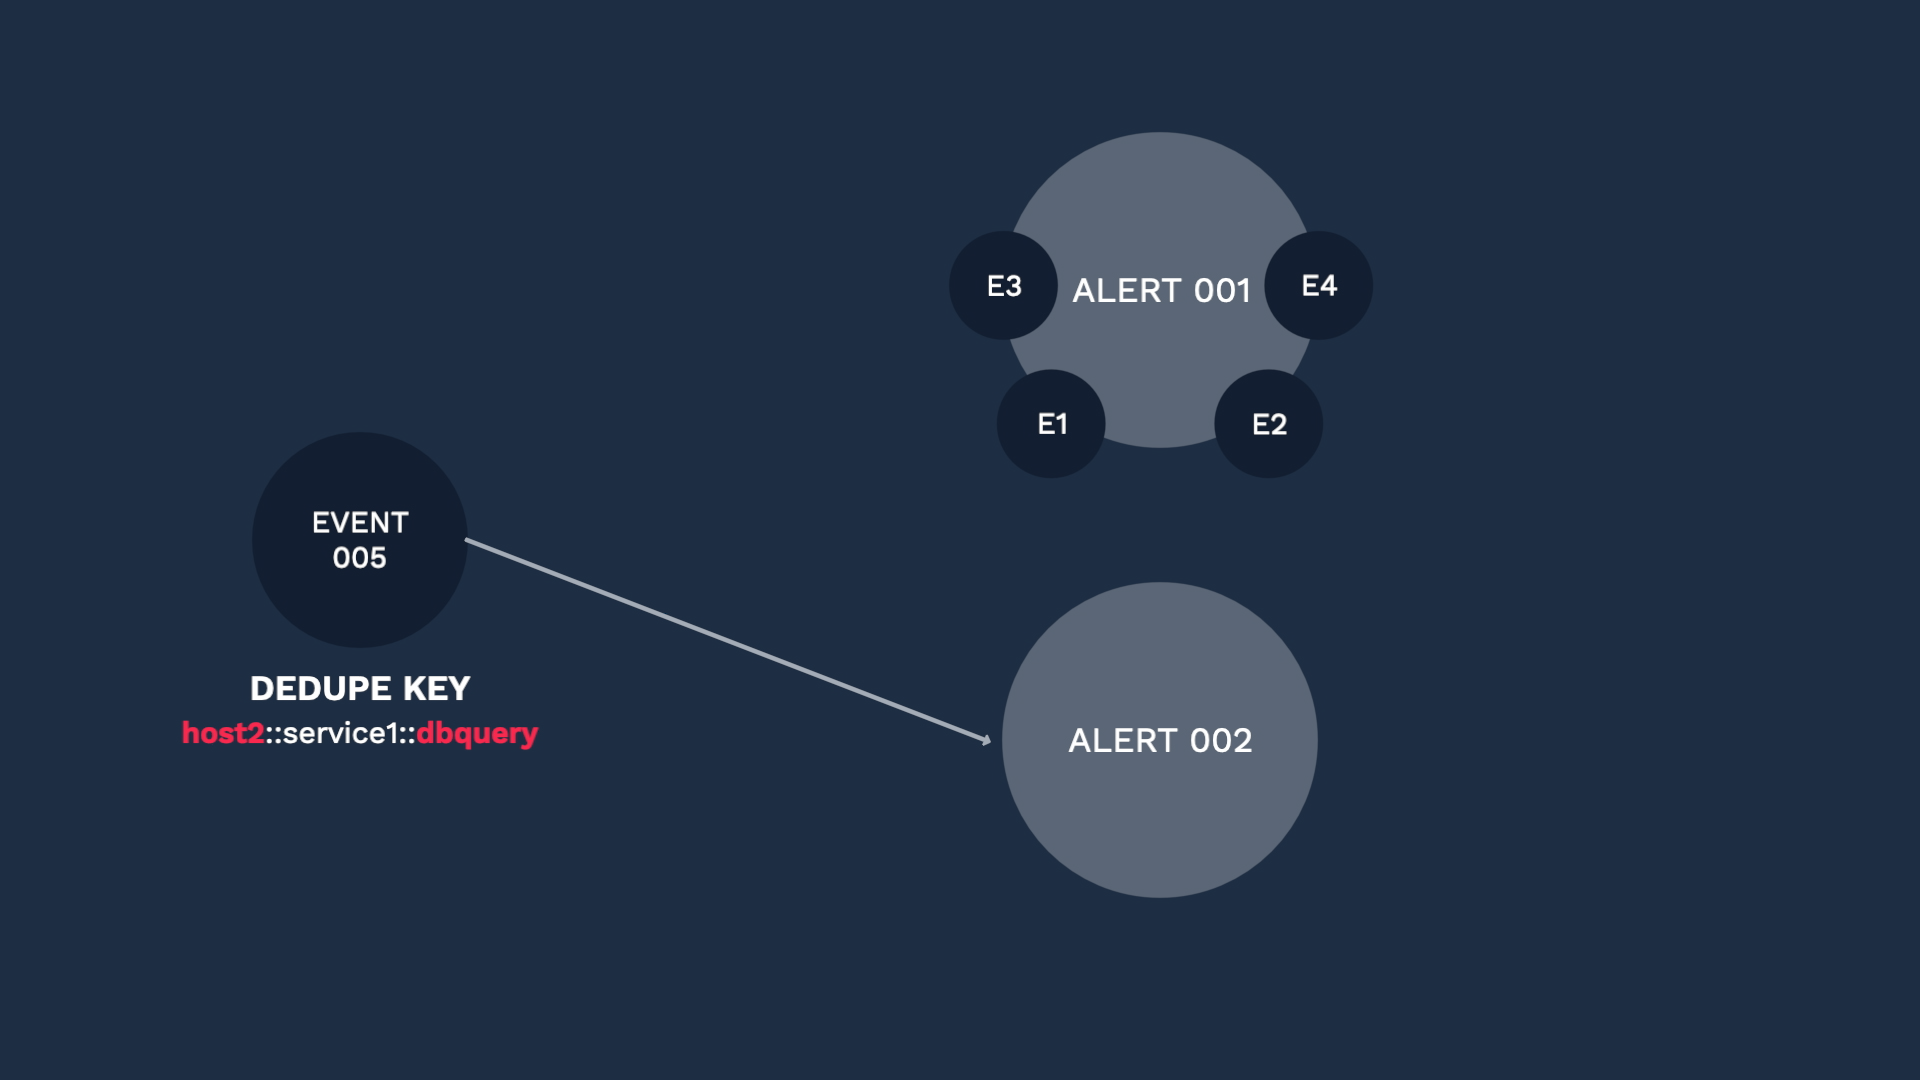
Here comes another event, and since the dedupe key is different, it is categorized into a separate alert. Like this, selecting the right fields for your use case is the key factor for successful deduplication. The default is set to be the combination of the Source, Service, and Check fields, but you can select what works for you. Just ask yourself, what should be the common factors for two events to be considered duplicates.
Going back to our custom integration, these are the default fields for deduplication. You can change them if you wish, but Incident Management recommends you use the defaults unless your business needs require that you use different fields.
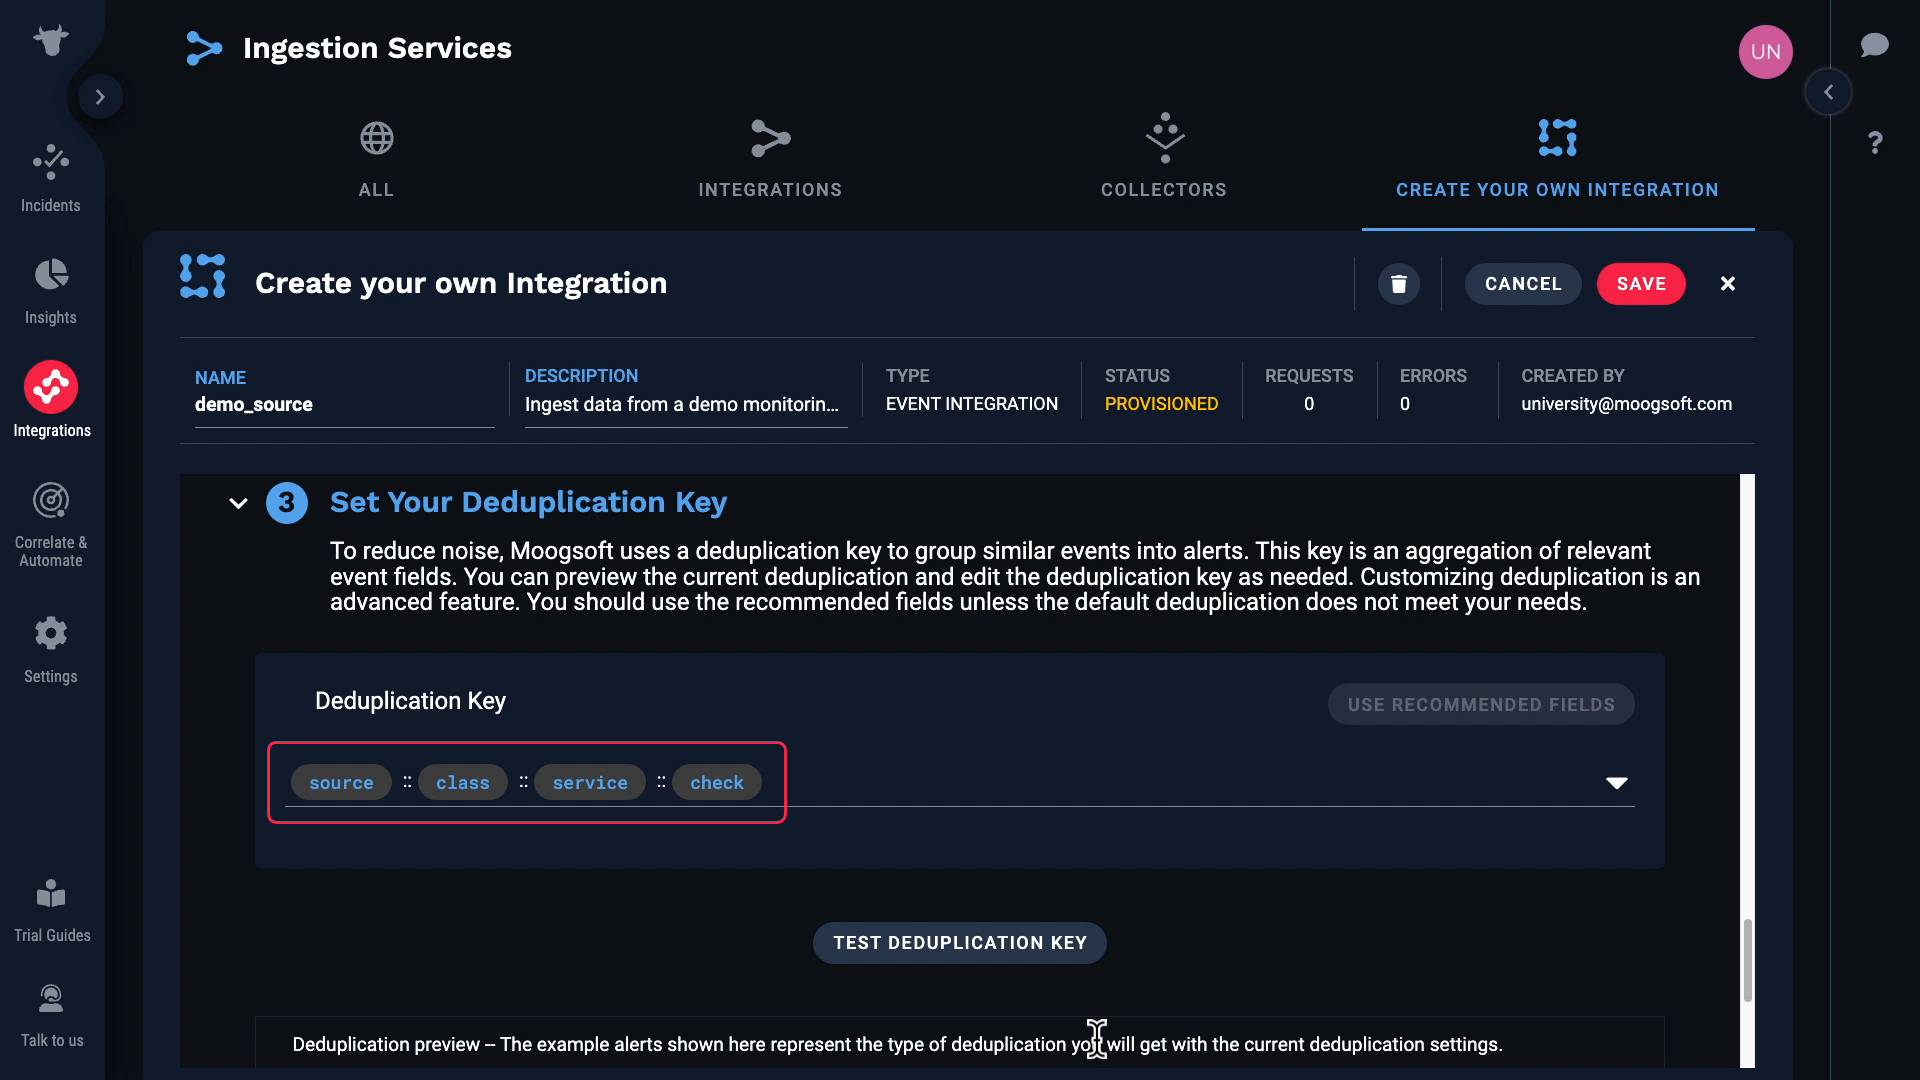
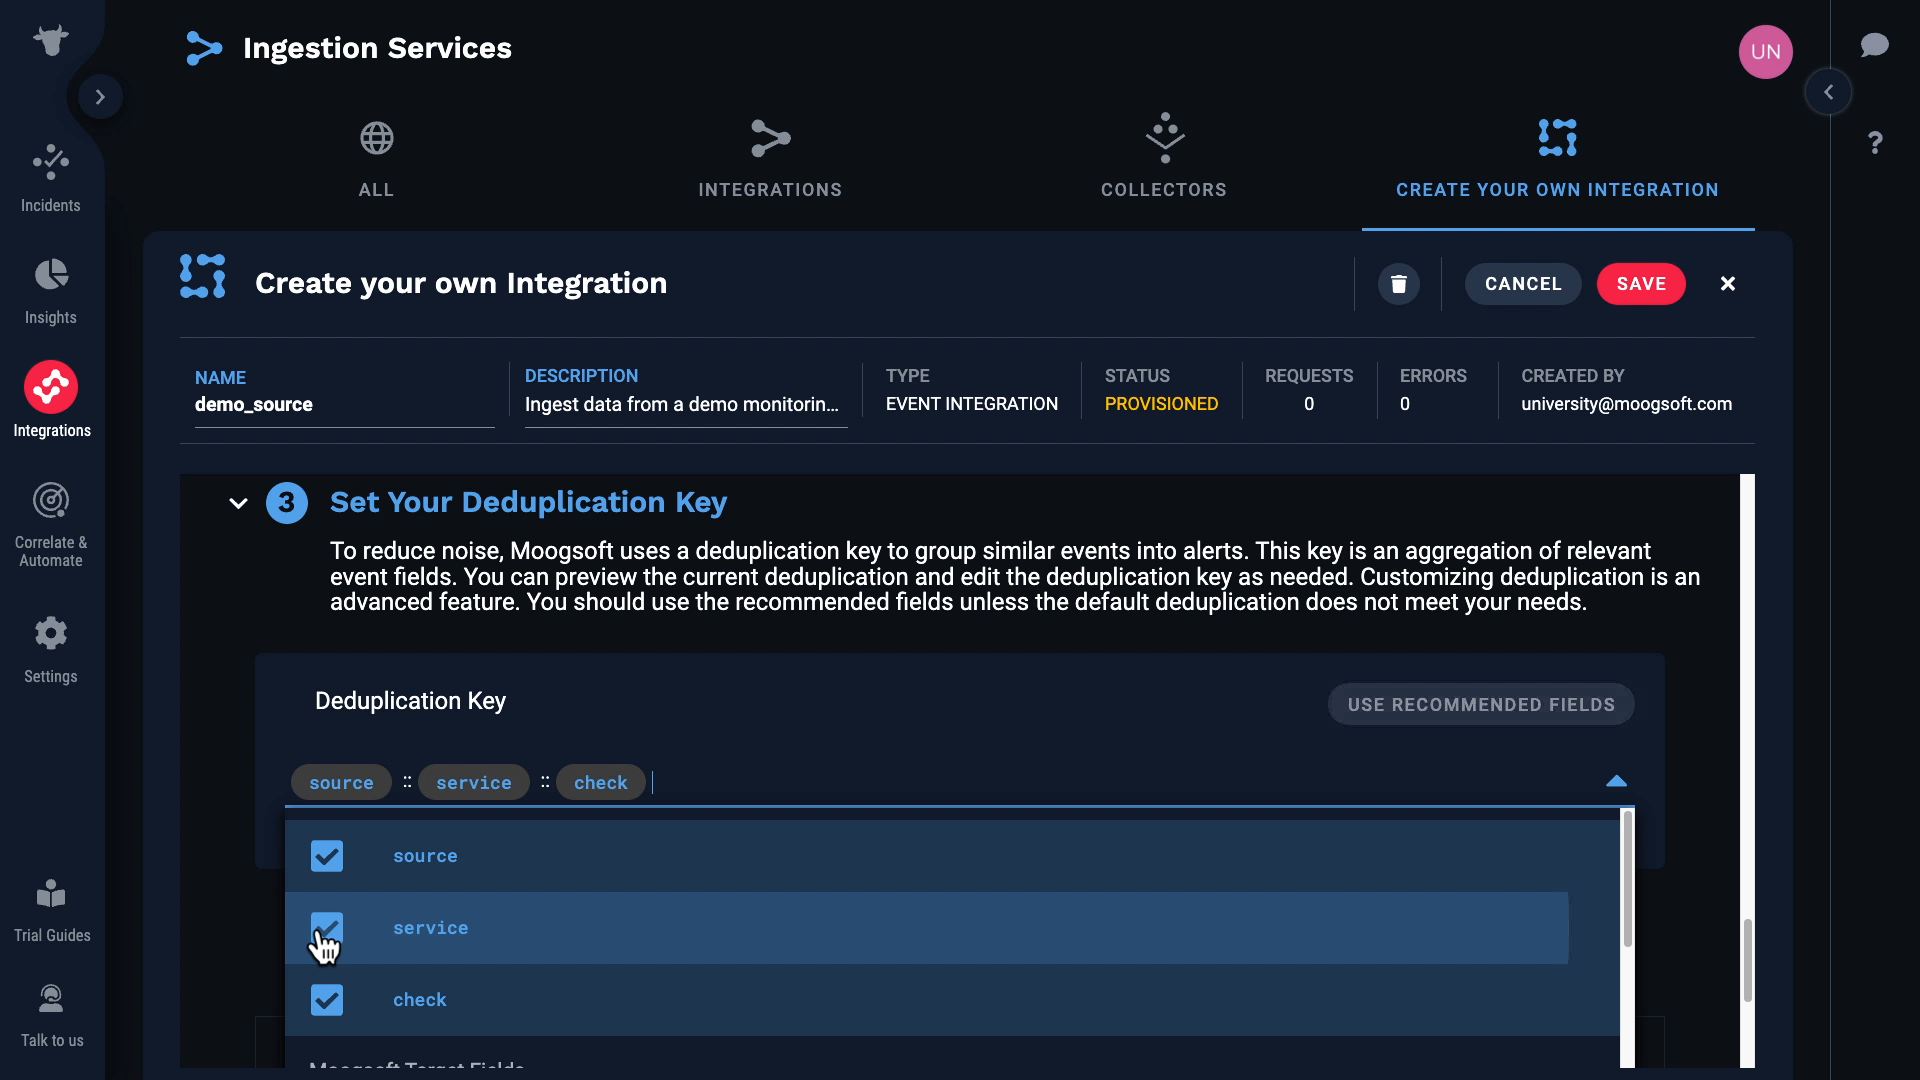
In our case we don’t have a value for class, so we’ll remove that from the default keys.
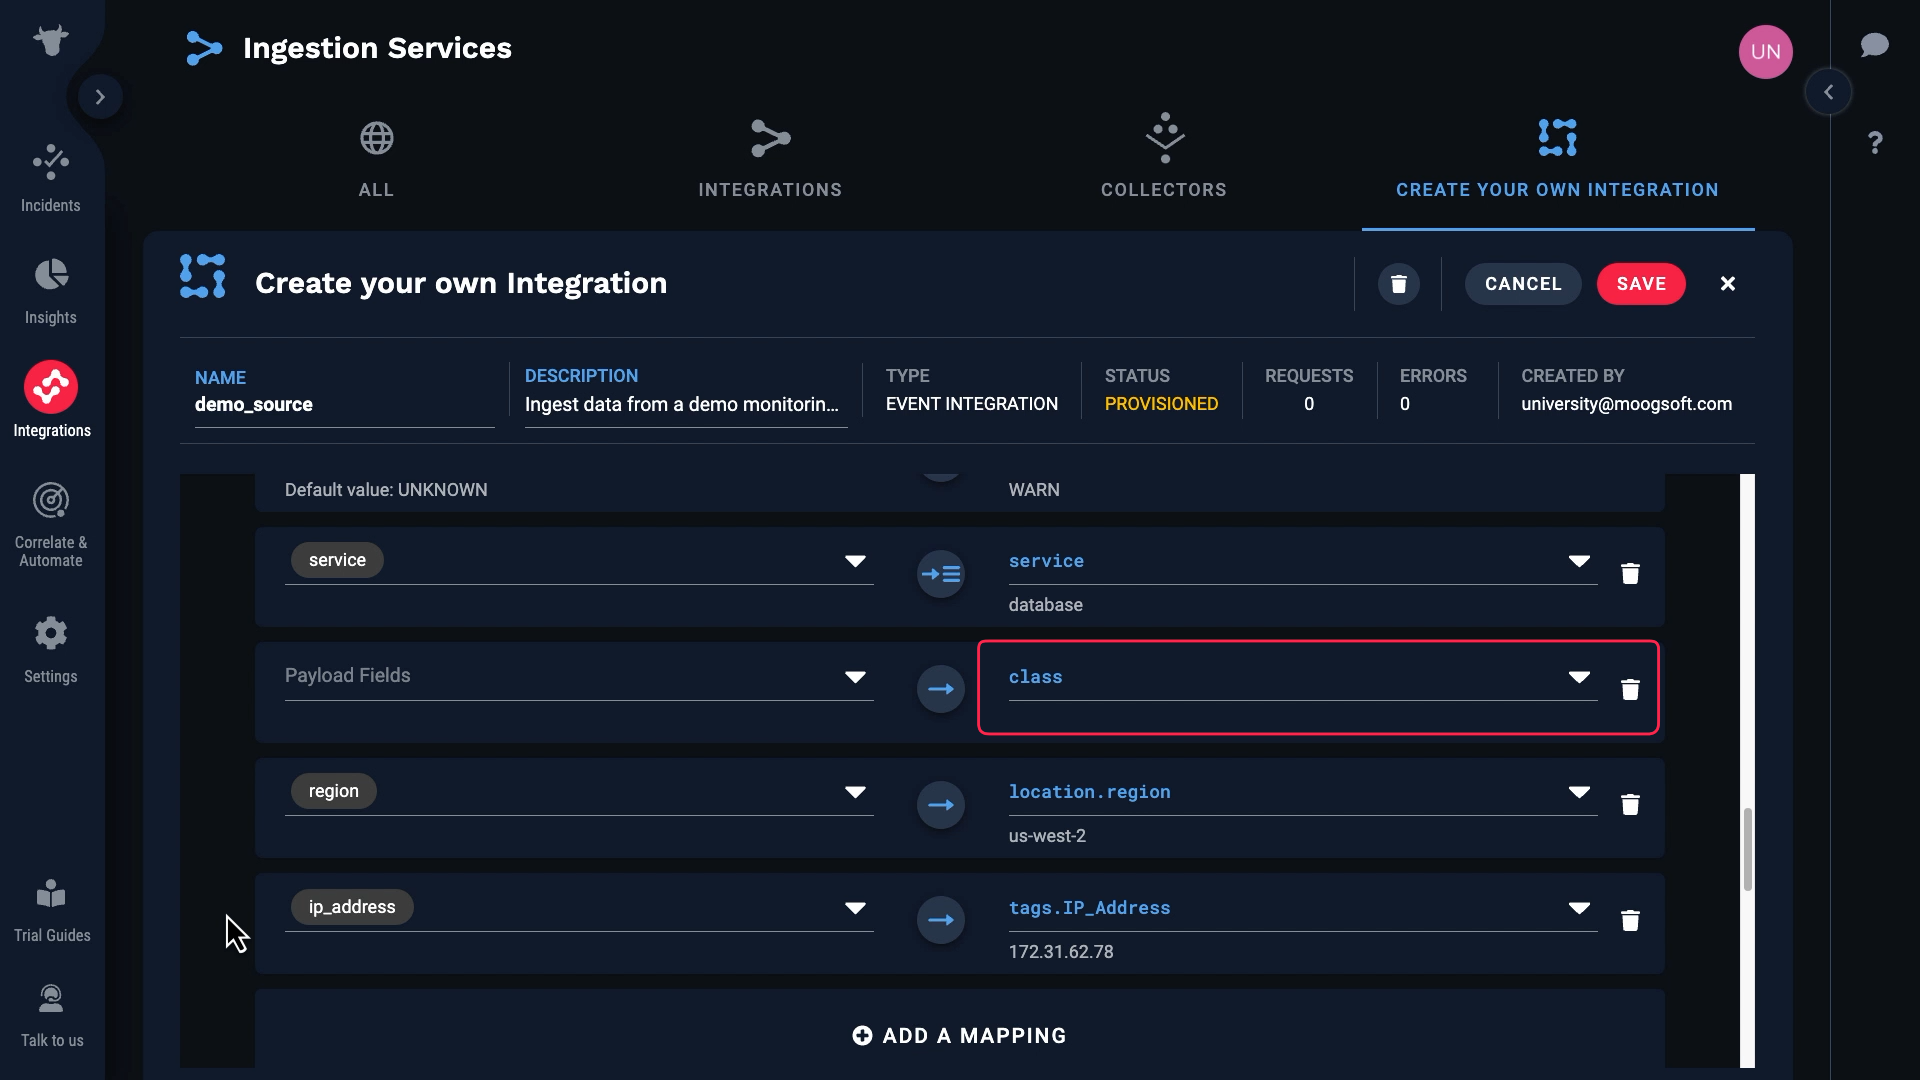
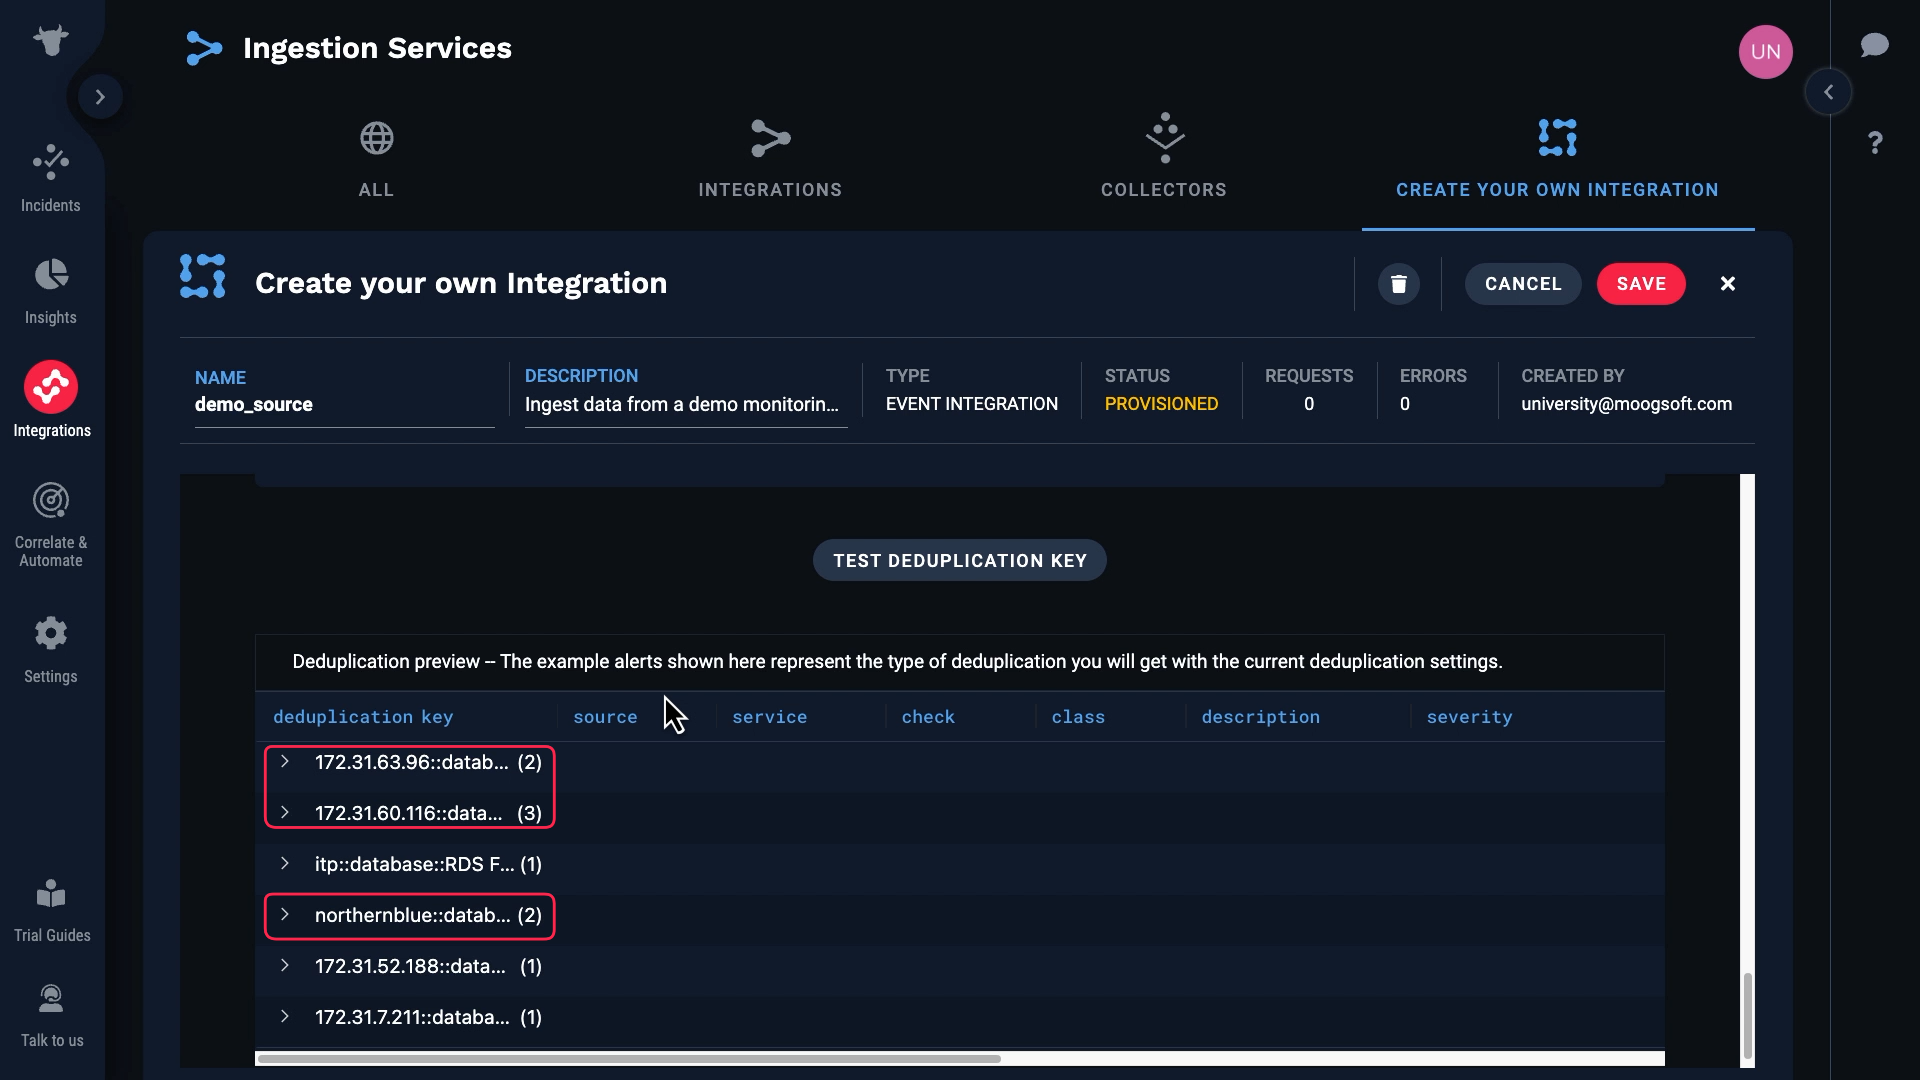
Let’s test. Success! Here are the resulting deduplication keys.
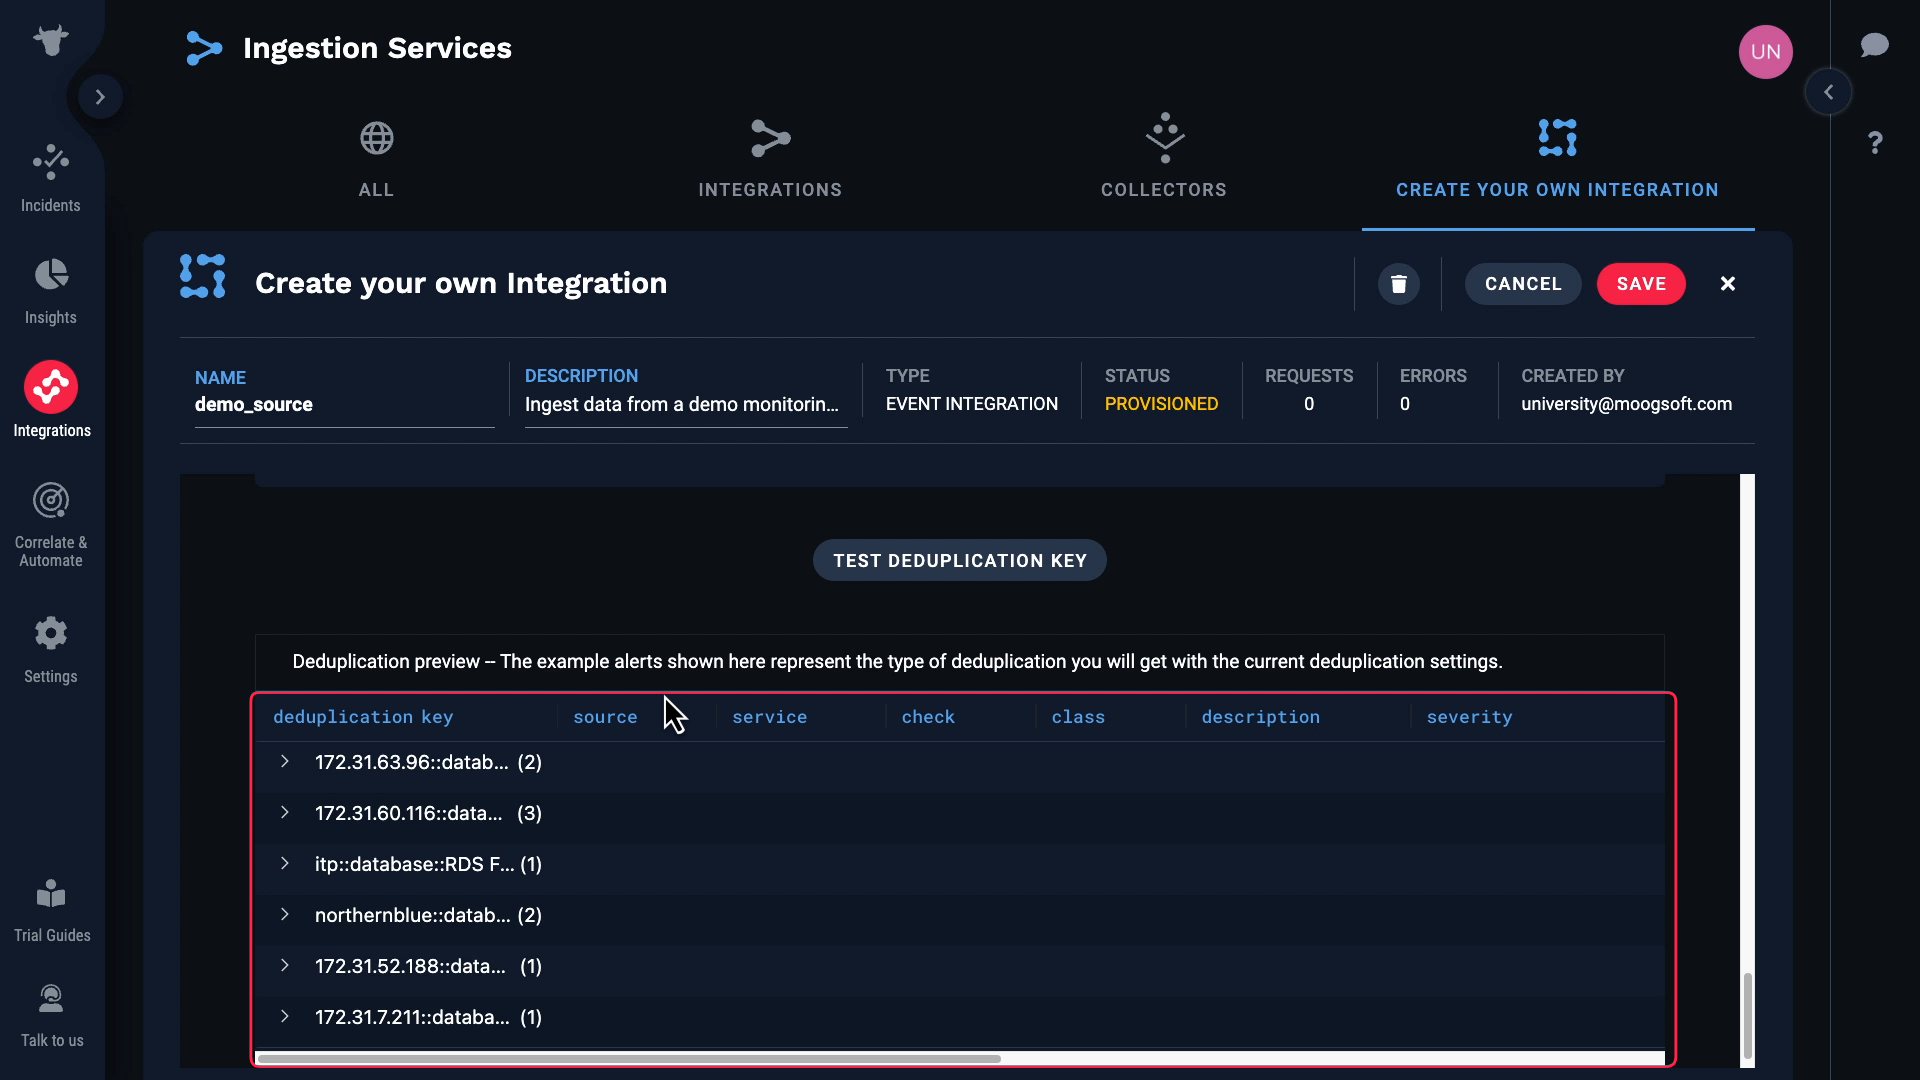
Based on these values, some of the events have been assigned to the same alert.
Our custom integration is ready to go. Let’s save and activate it. Note that it will stay in provisioned status until Incident Management processes an event.
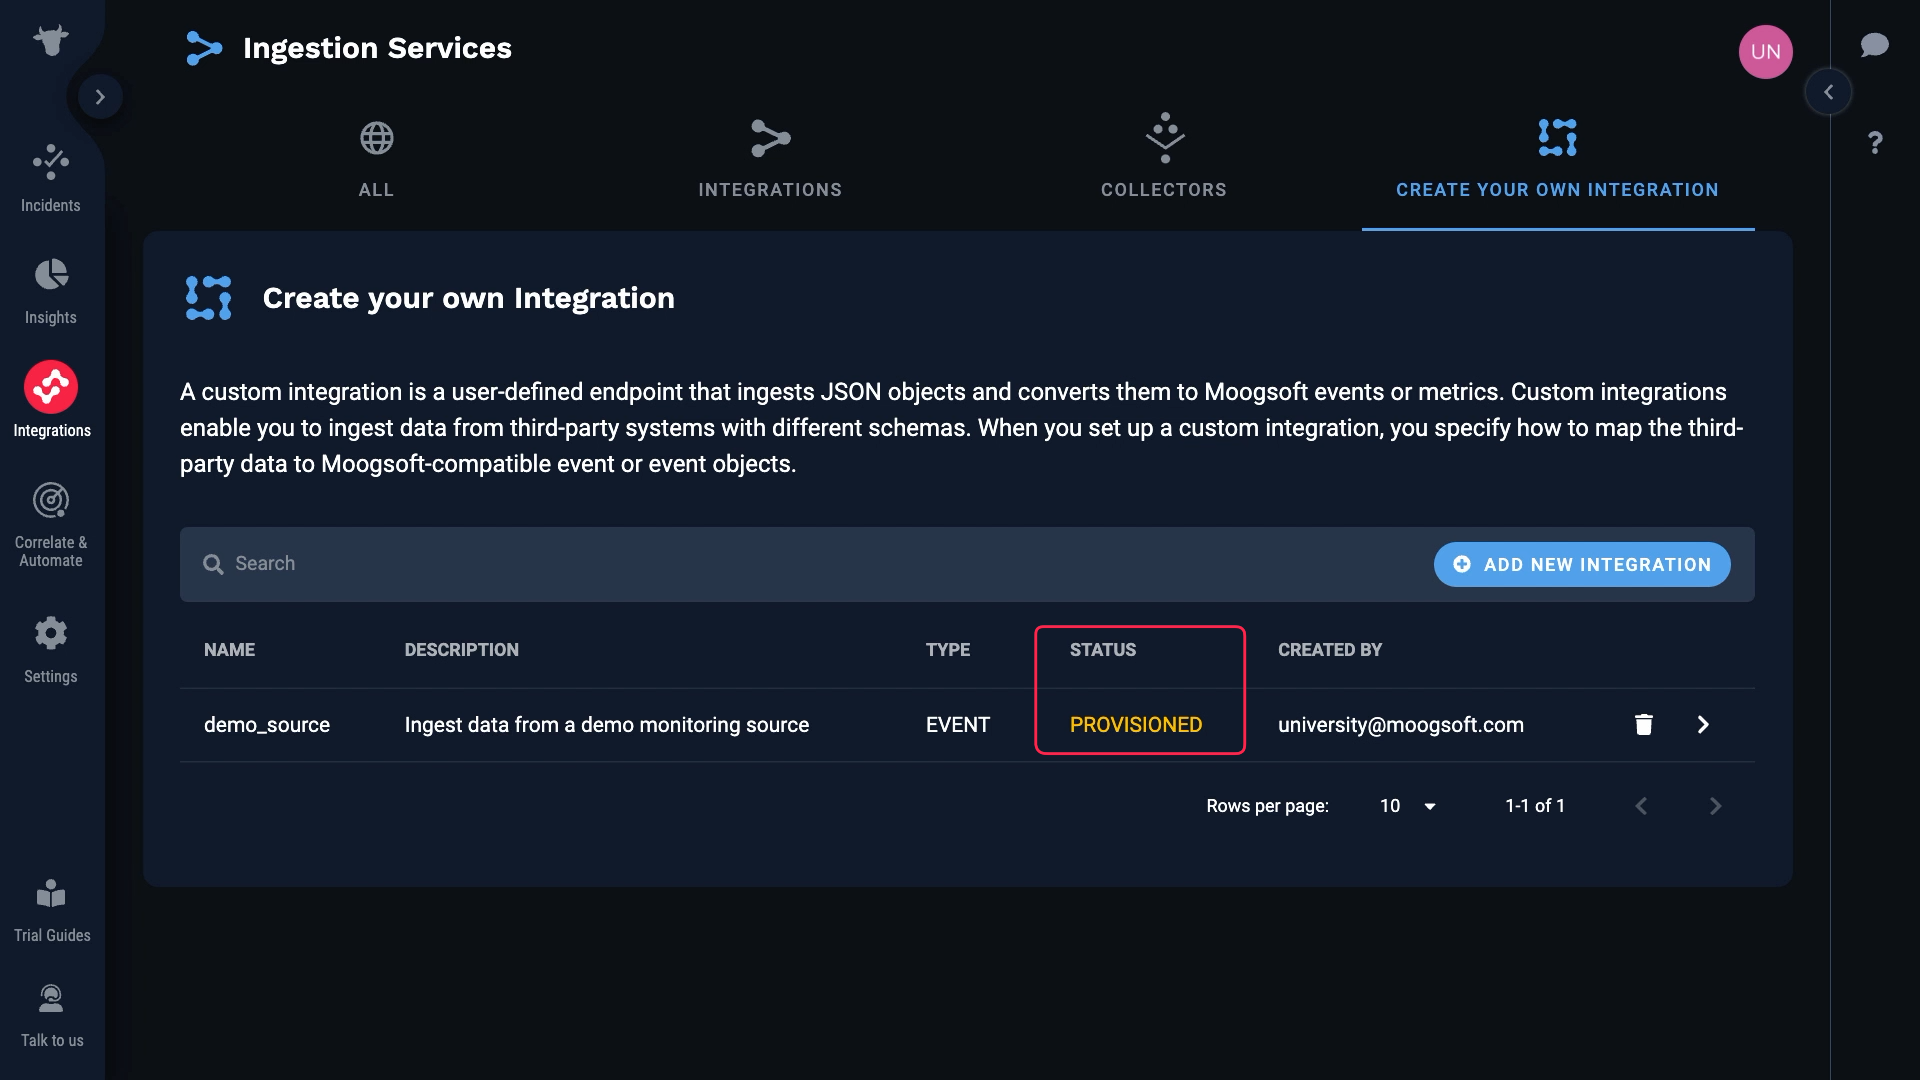
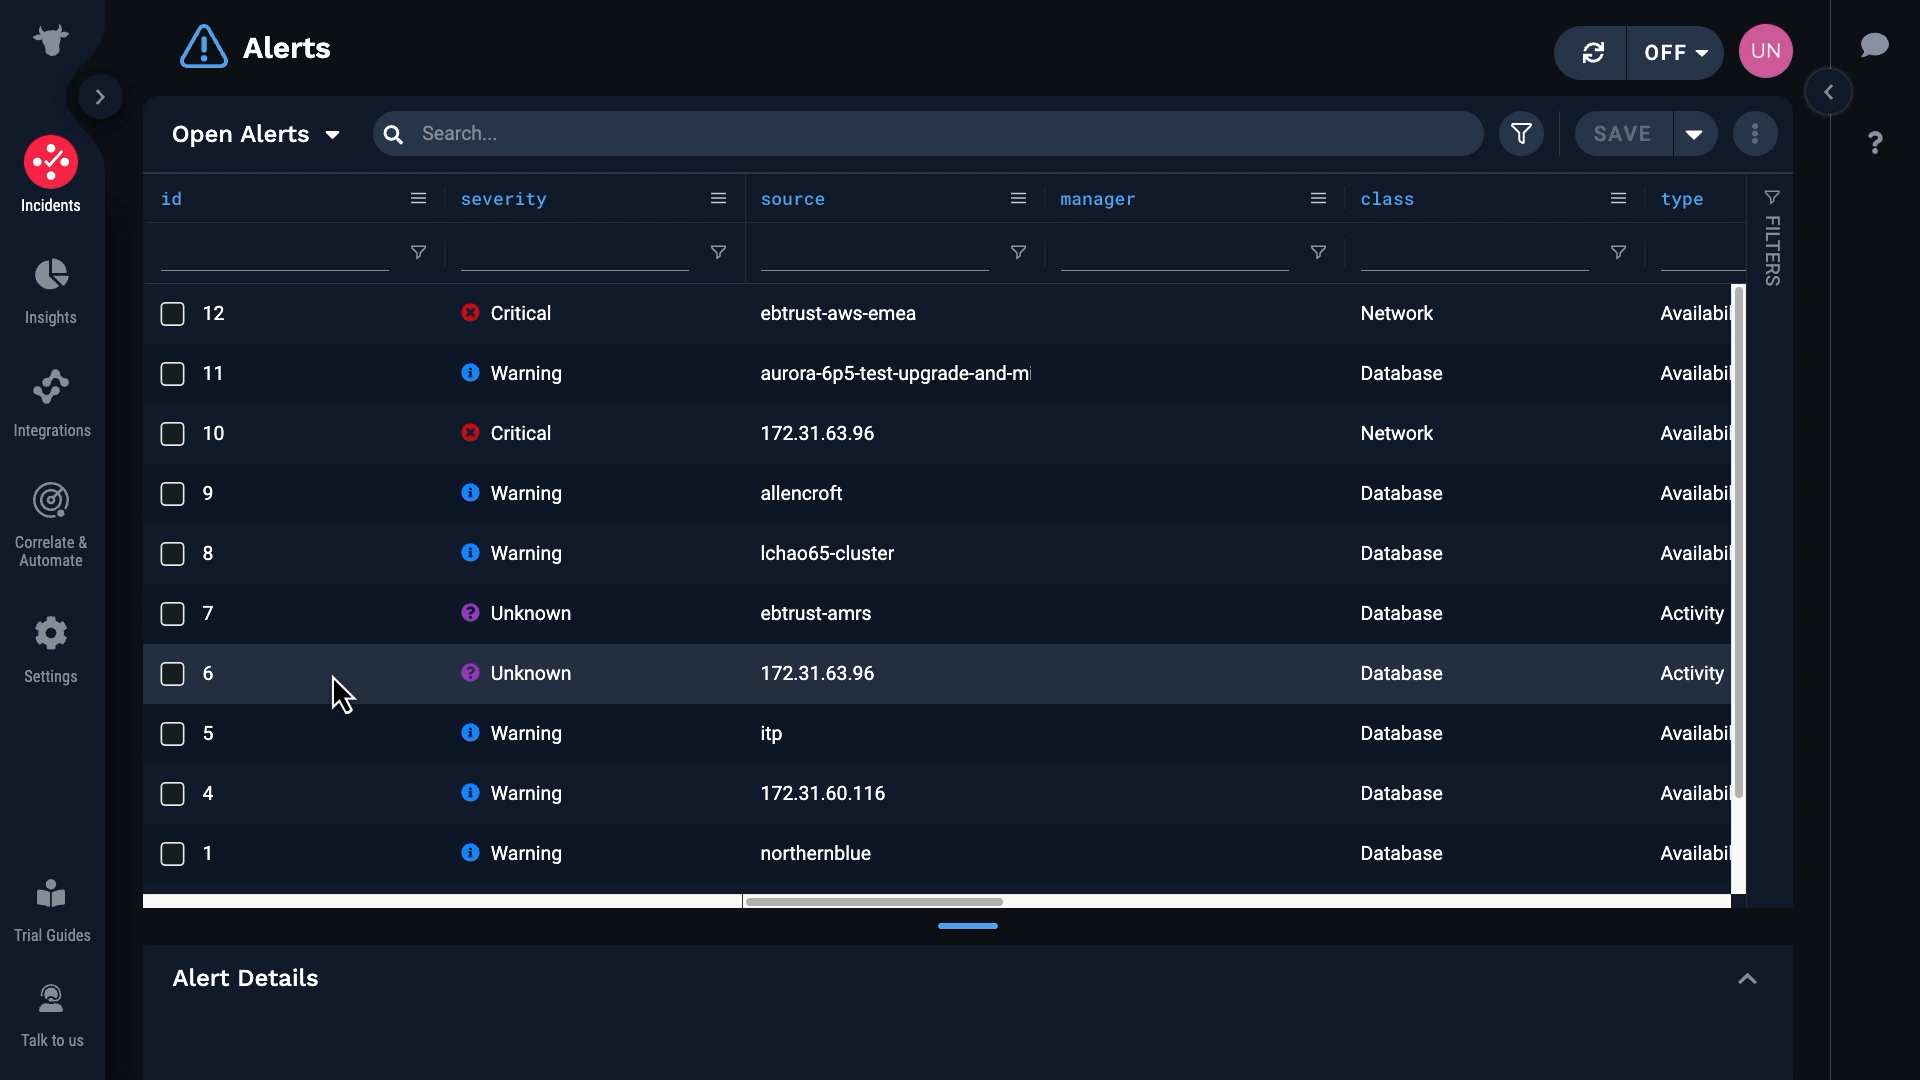
The monitoring data is flowing into Incident Management through our custom integration. Thanks for watching!
BASIC | 5 MIN
In Moogsoft, you can use tags to create custom fields to store data that is important to your organization. Learn how to use them with this video.
Documentation is available.
Use case walkthrough: Use tags to create custom fields ►
This video explains how to create custom fields using tags in APEX AIOps Incident Management.
*Please note Moogsoft is now part of Dell's IT Operations solution called APEX AIOps, and changed its name to APEX AIOps Incident Management. The UI in this video may differ slightly but the content covered is still relevant.
While working on data ingestion, you may realize you need additional fields other than the ones provided by Incident Management to map your incoming payload. Tags are custom fields you can create to store such information.
For example, let’s say you are creating an integration using the Events API.
You’ve mapped basic information to the fields available by default.
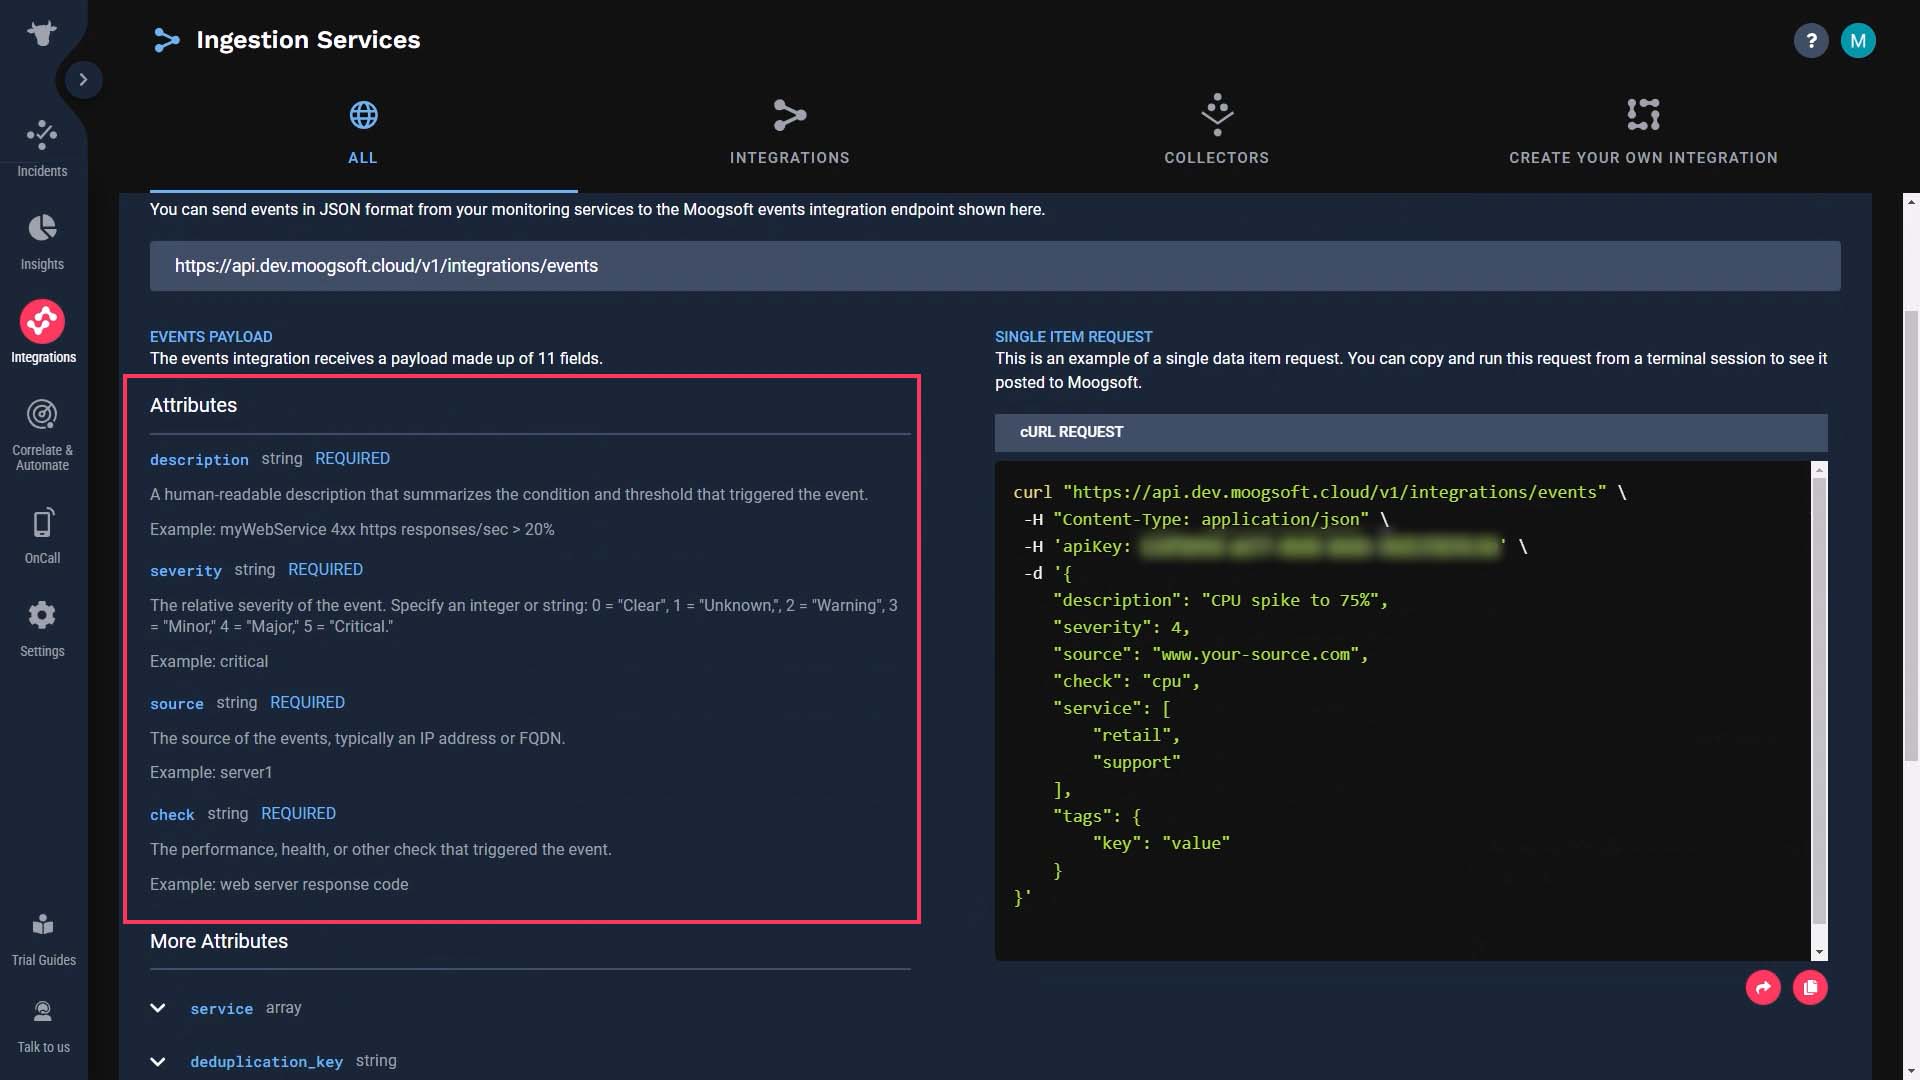
But you also need to map the environment value in your incoming payload. There’s no field available for that to be mapped. What to do?
This is where you use tags.
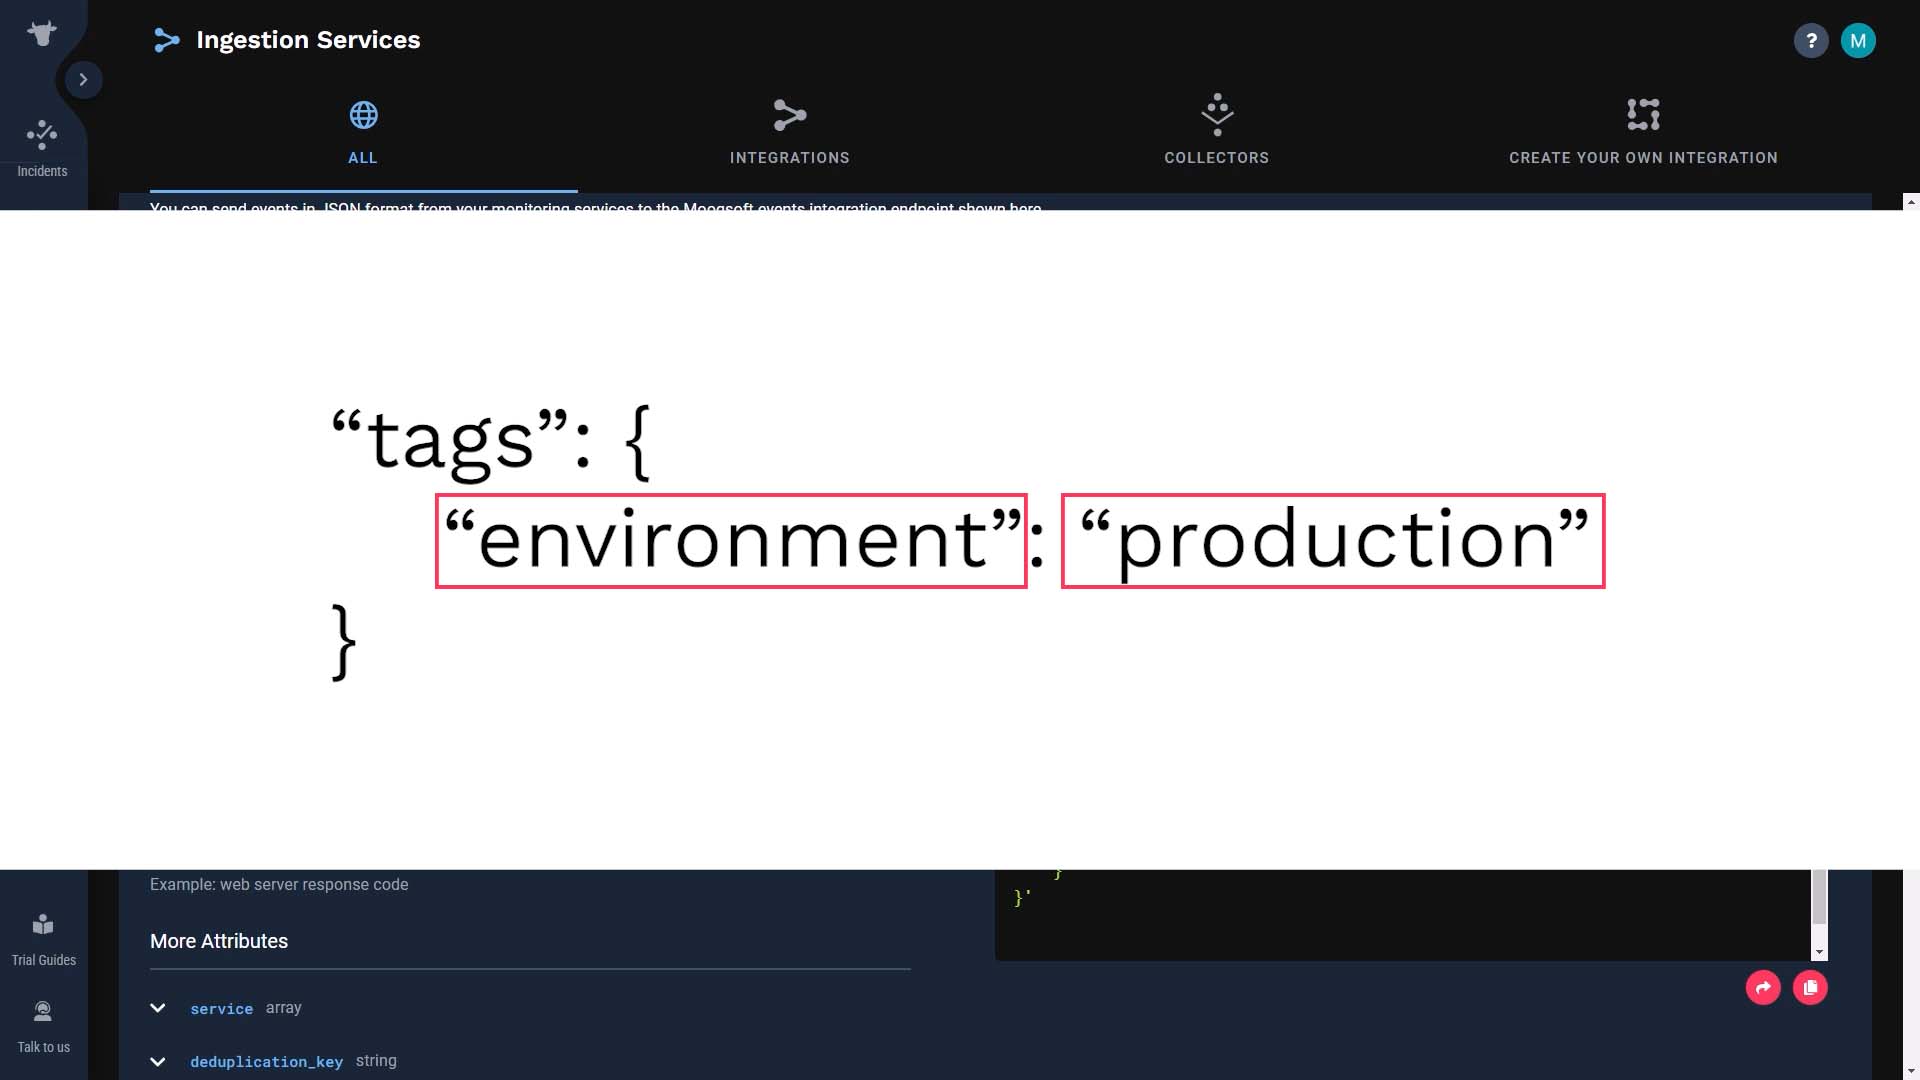
This shows the JSON format for a custom tag. There is a key: environment, and a value: production. Incident Management will generate a tag to hold the environment type when the Events API receives this in an event payload.
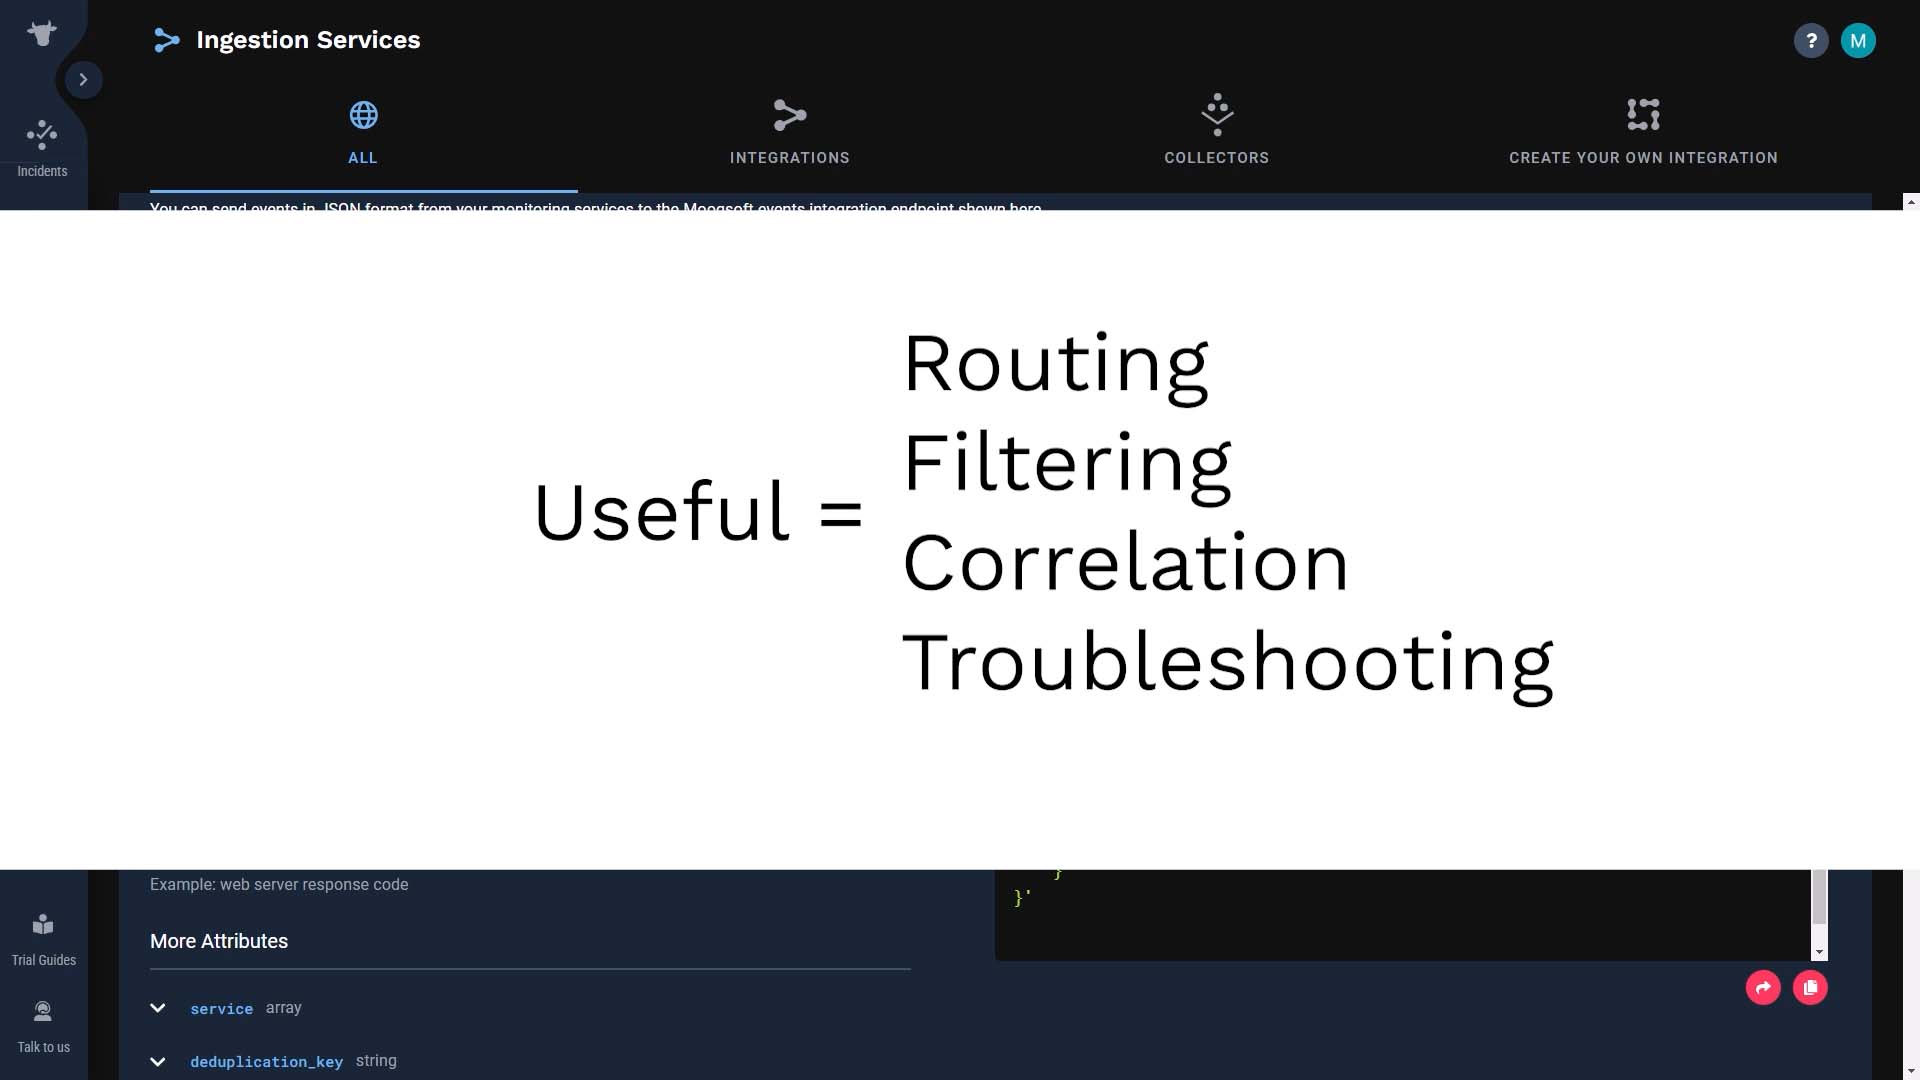
Keep in mind, you should create tags ONLY WHEN you need to use them later in the journey of the data. if that data is not useful for routing, filtering, correlation, or troubleshooting, there’s no need to map every single field to Incident Management.
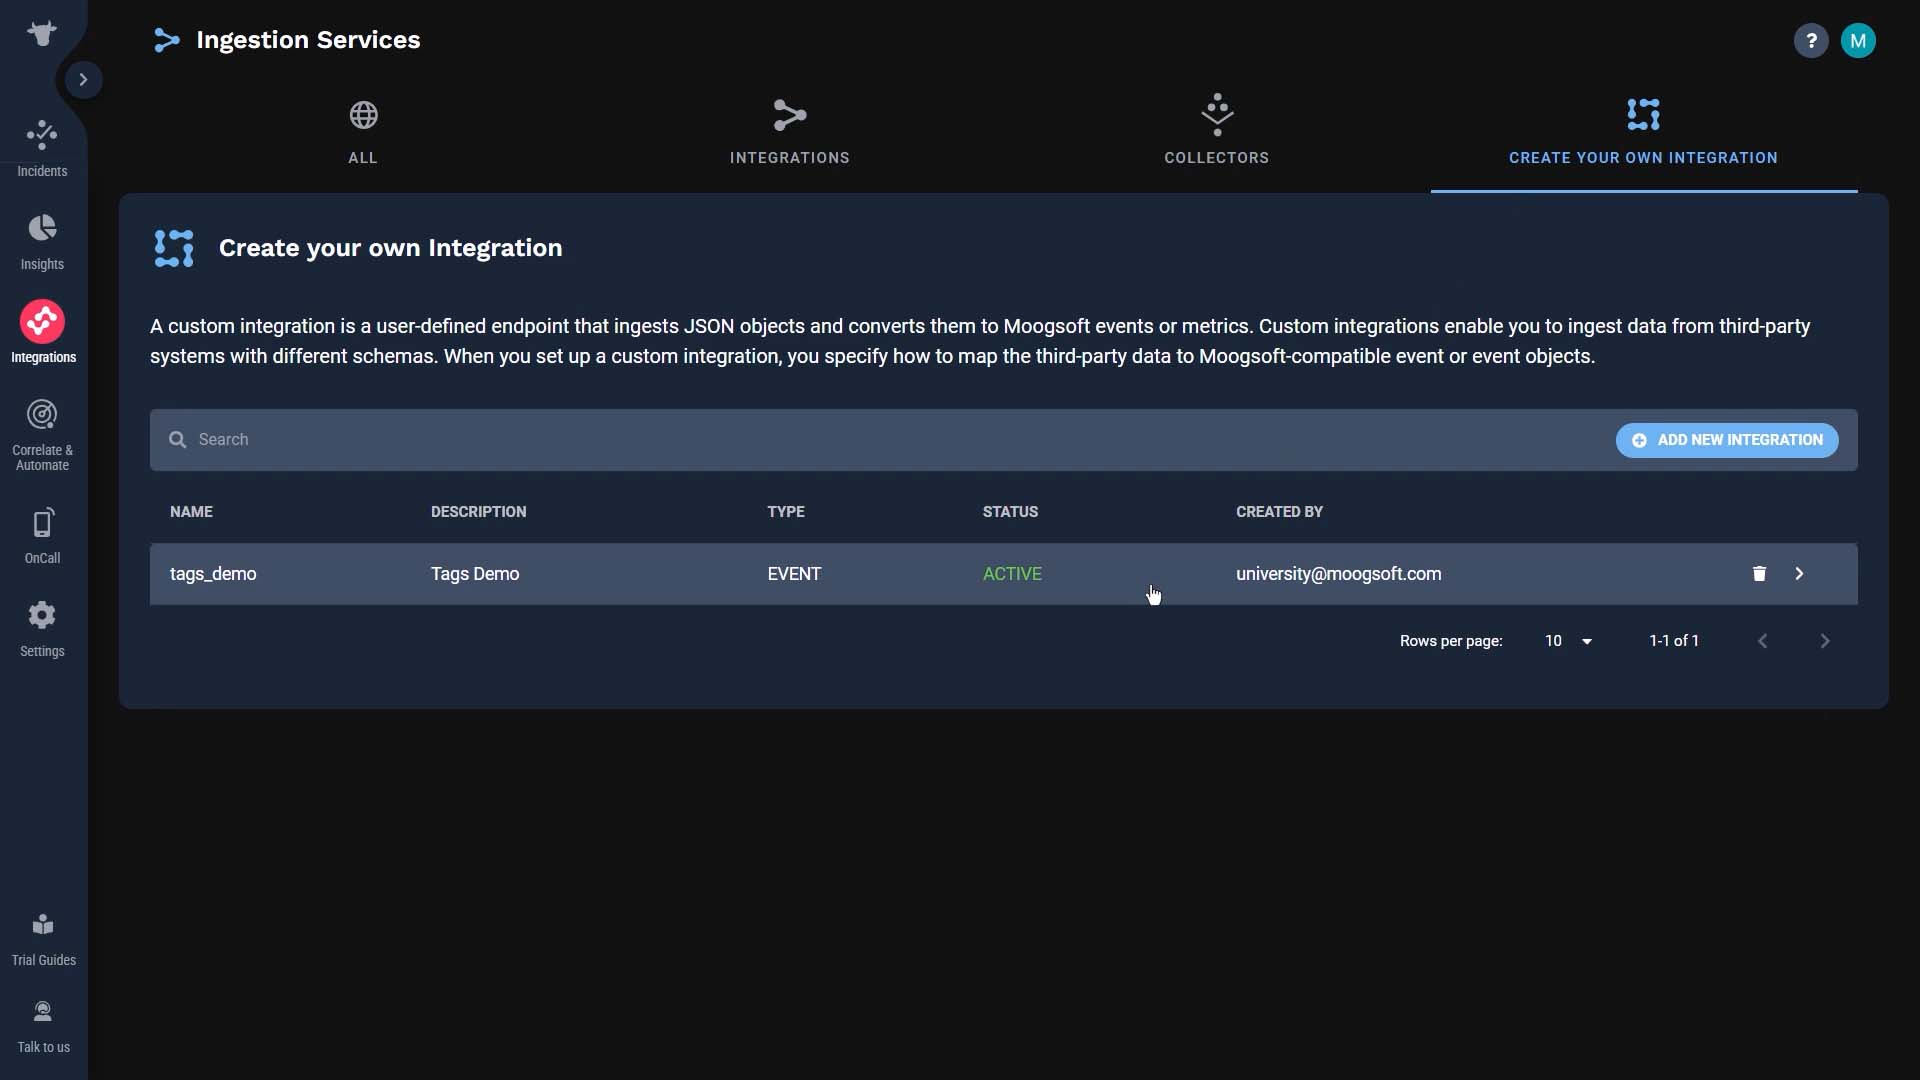
Instead of the Events API, you may be using the Create Your Own Integration feature for the flexibility of its field mapping. In that case, there’s a convenient feature to auto-create tags. Here’s how it works.
Add a new mapping row.
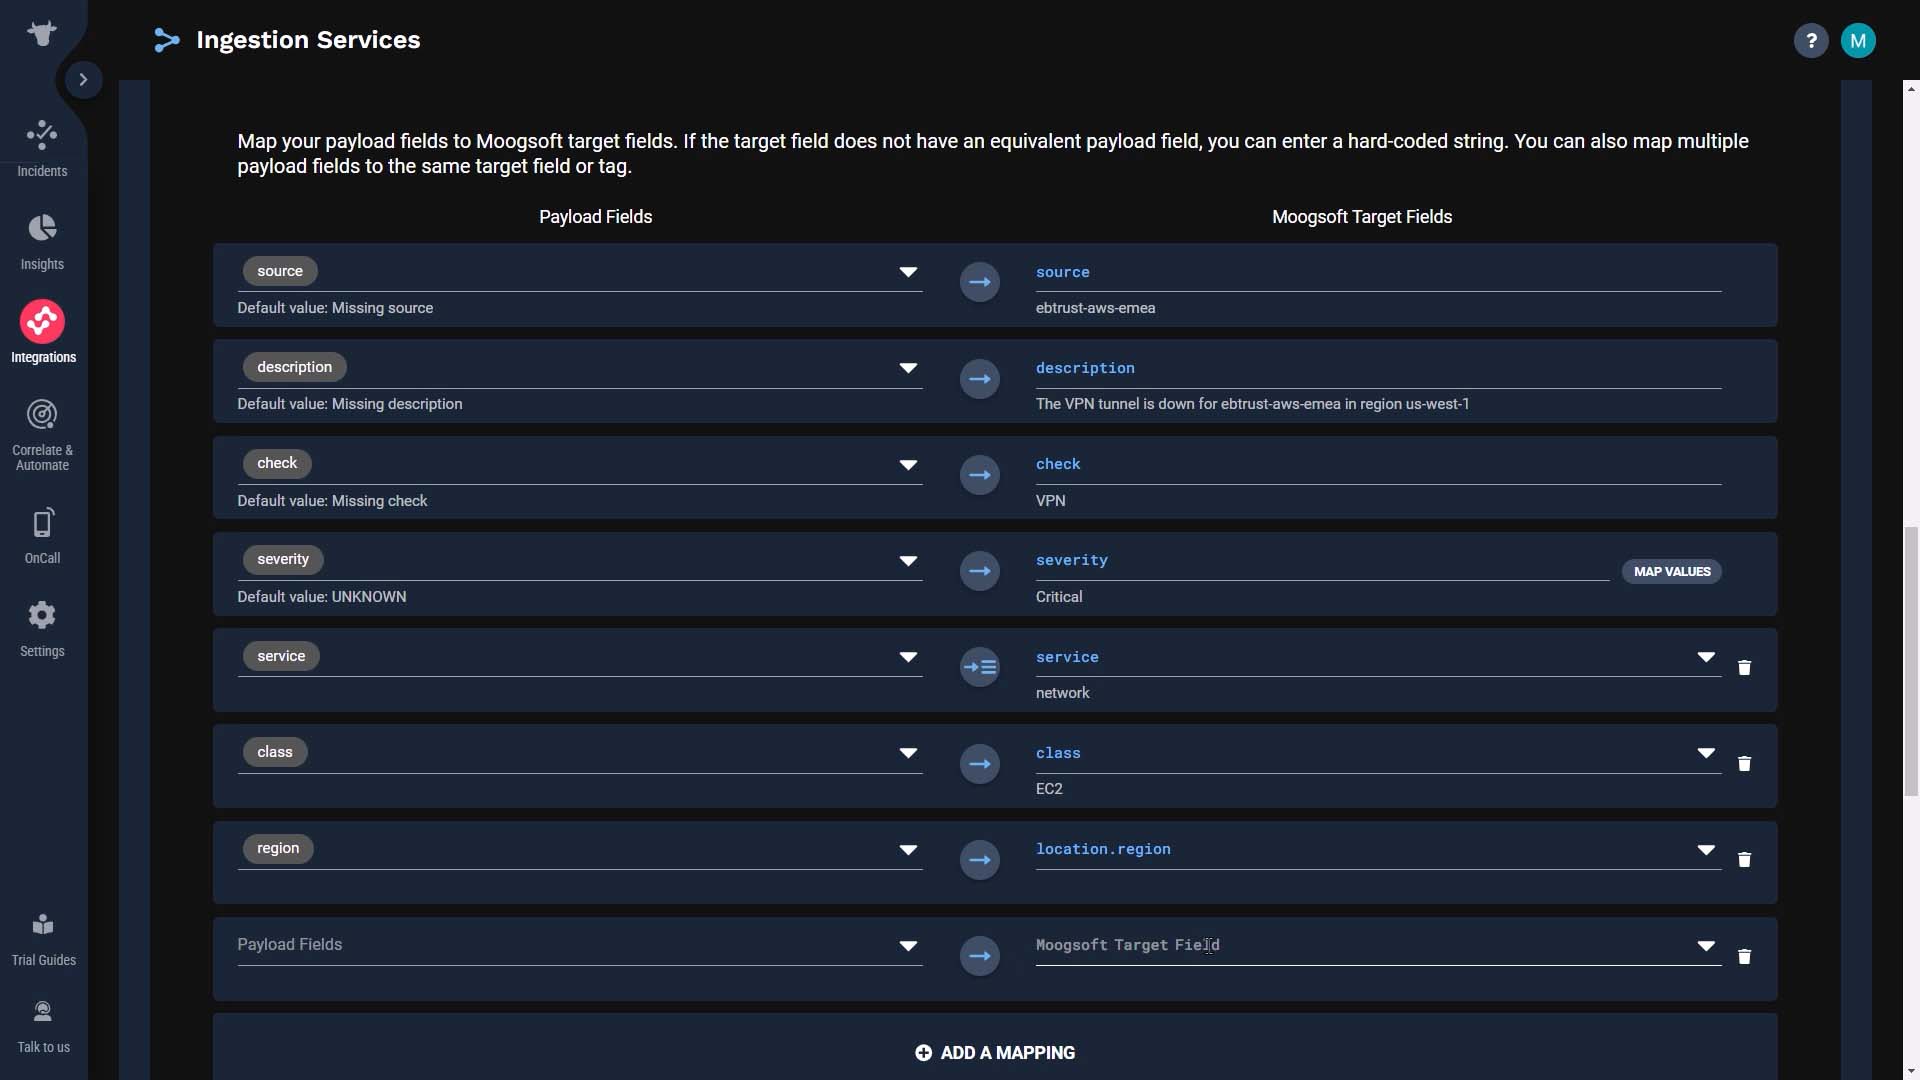
And in the target field, select tags.
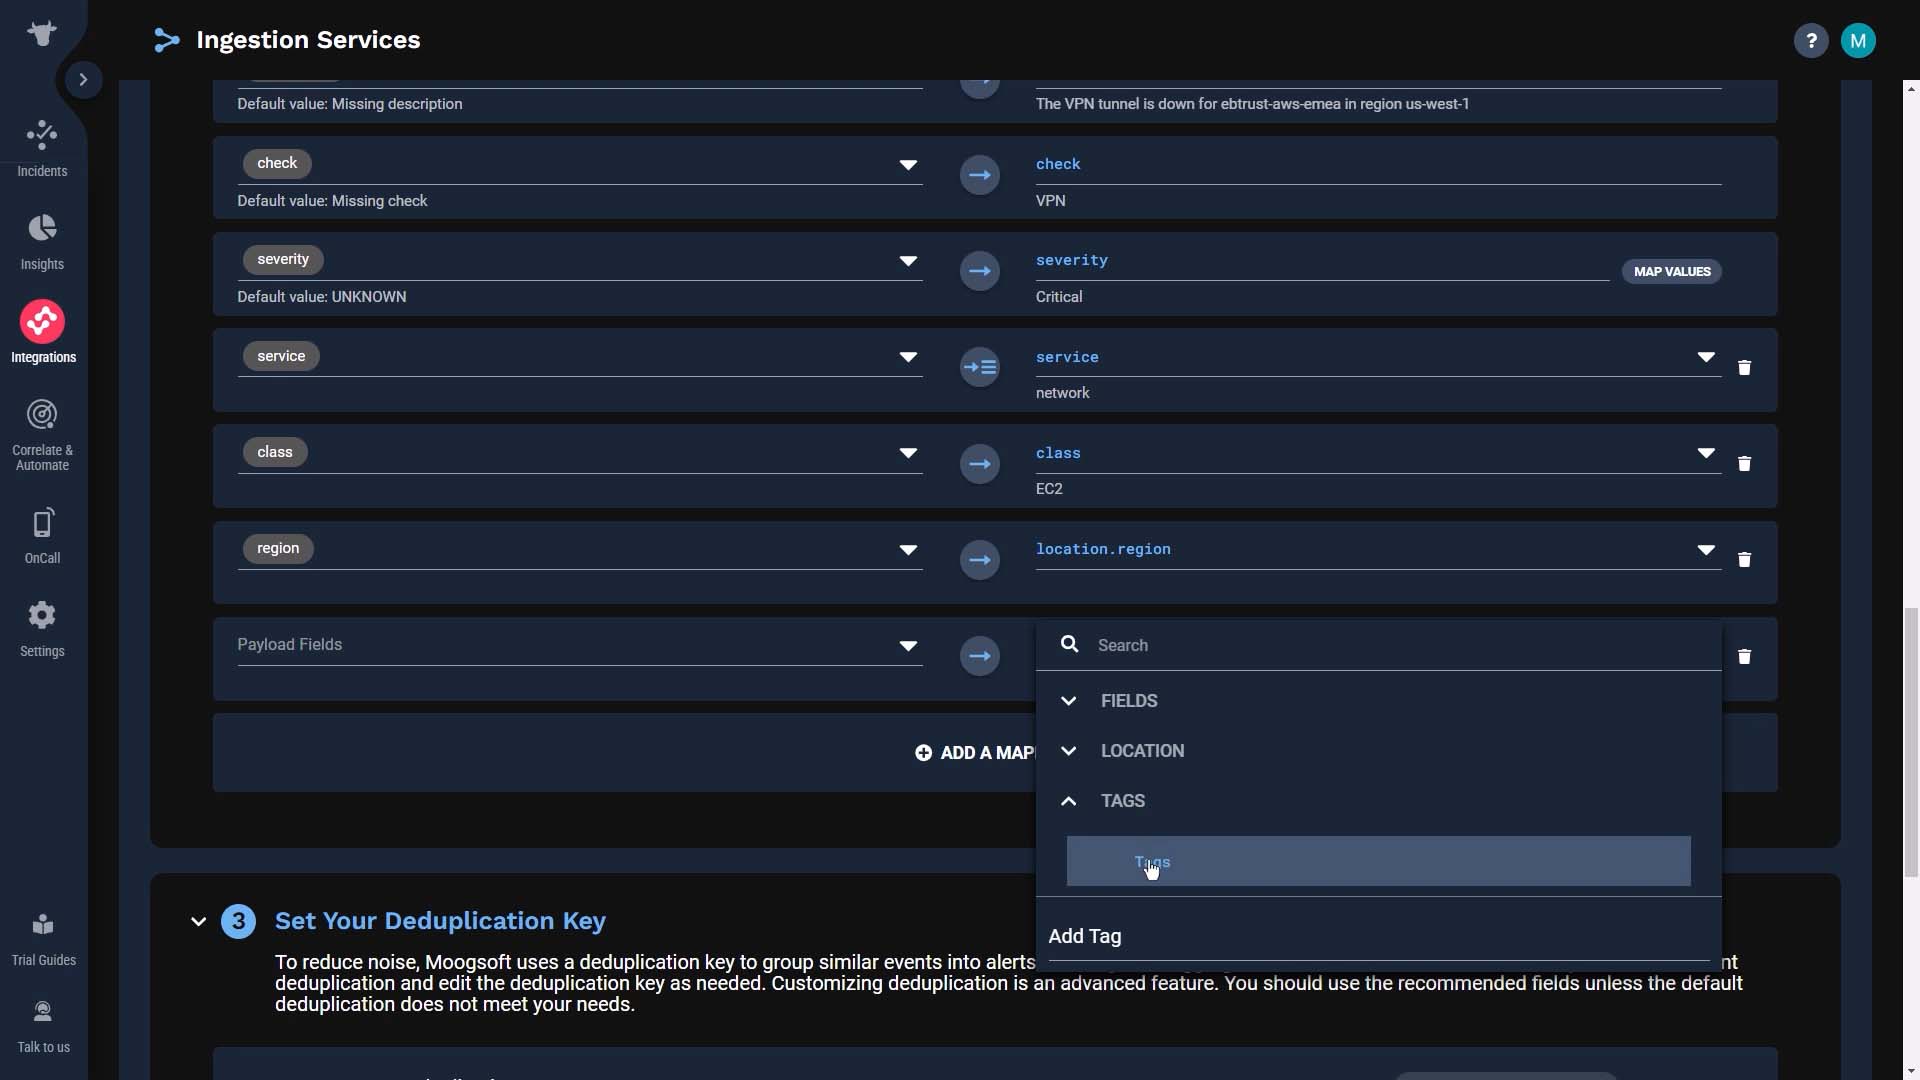
And for payload fields, search for and add the JSON key which includes the tags you want to use. We’ll add the instance details.
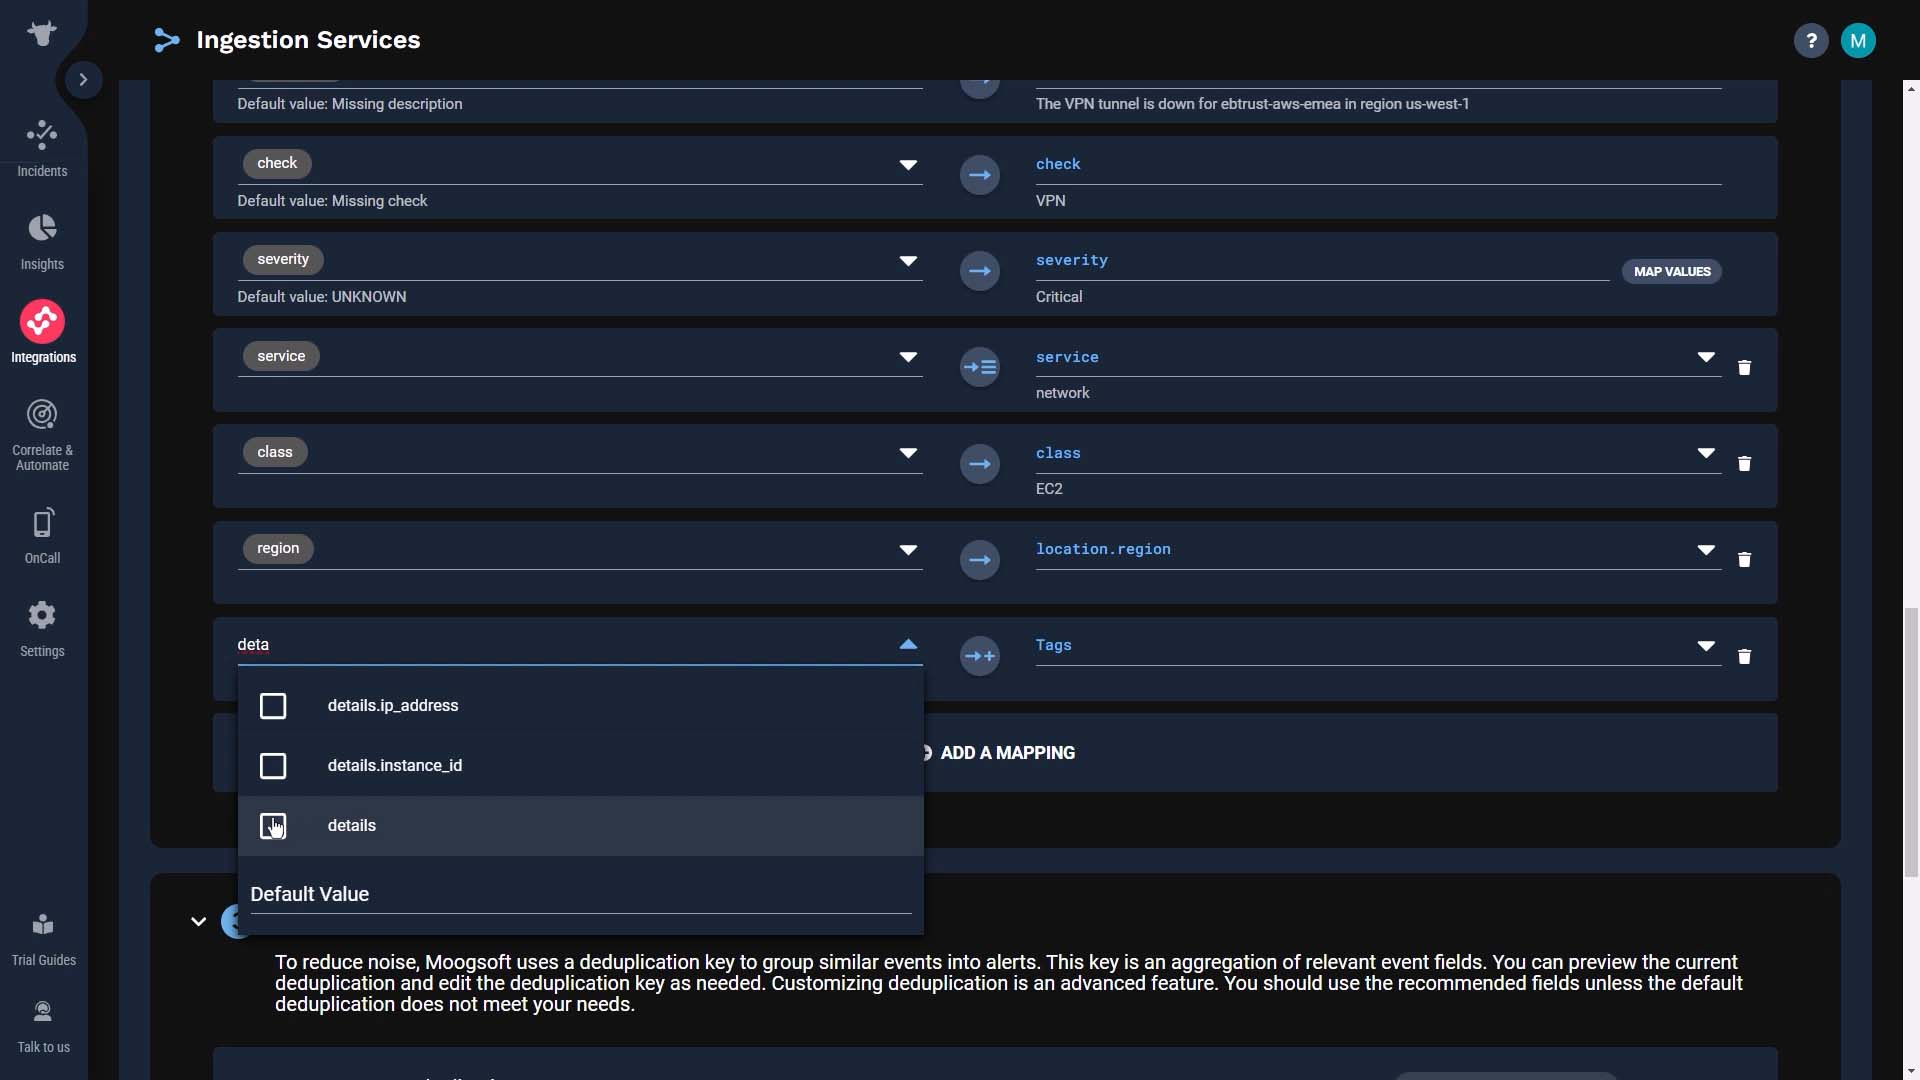
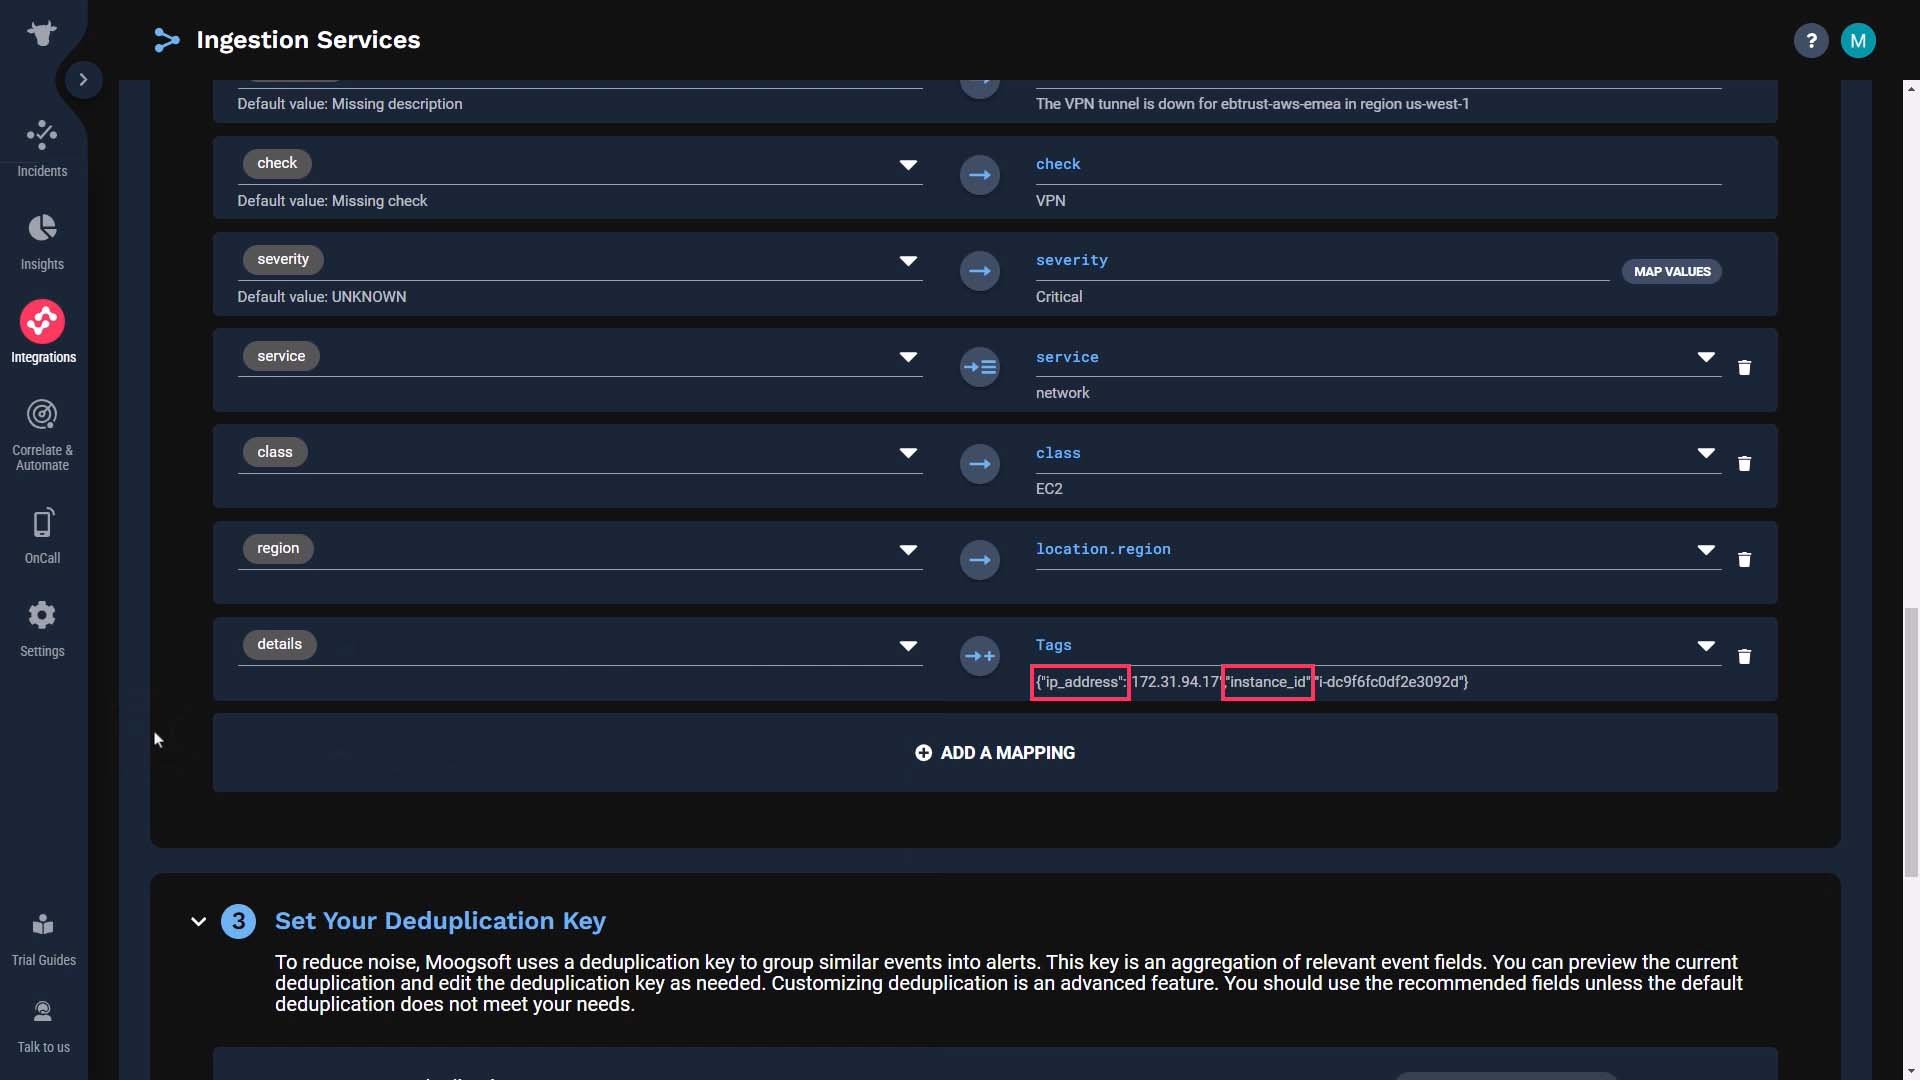
This adds IP Address and Instance ID at the same time.
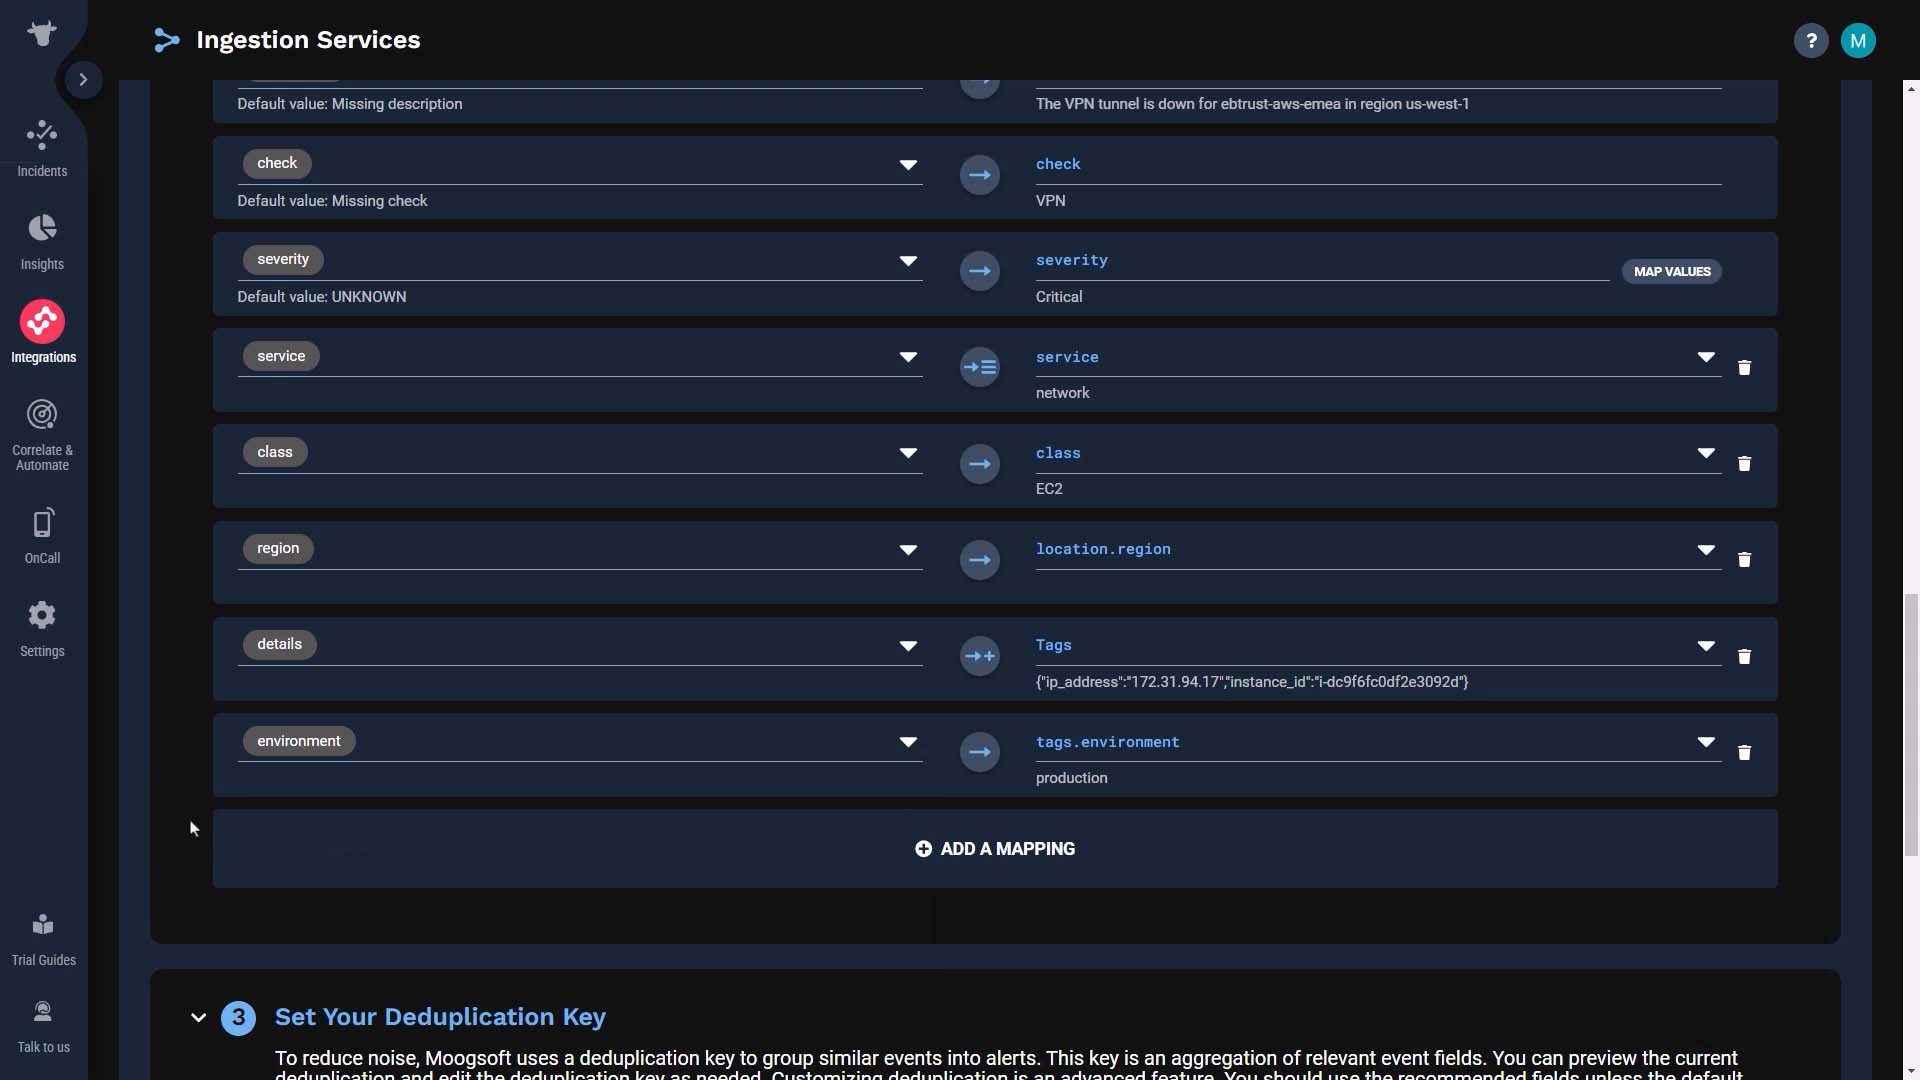
Of course, you can also map tags one at a time. Here's how you do that. Now we have the environment value stored as a tag.
Another way to create tags is using the workflow engine.
Let’s say the impacted customer is not part of the incoming event payload, so you want to enrich events with customer information from an external source.
This workflow queries the data catalog using the instance_id. It looks up the customer value and stores it in a newly created tag.
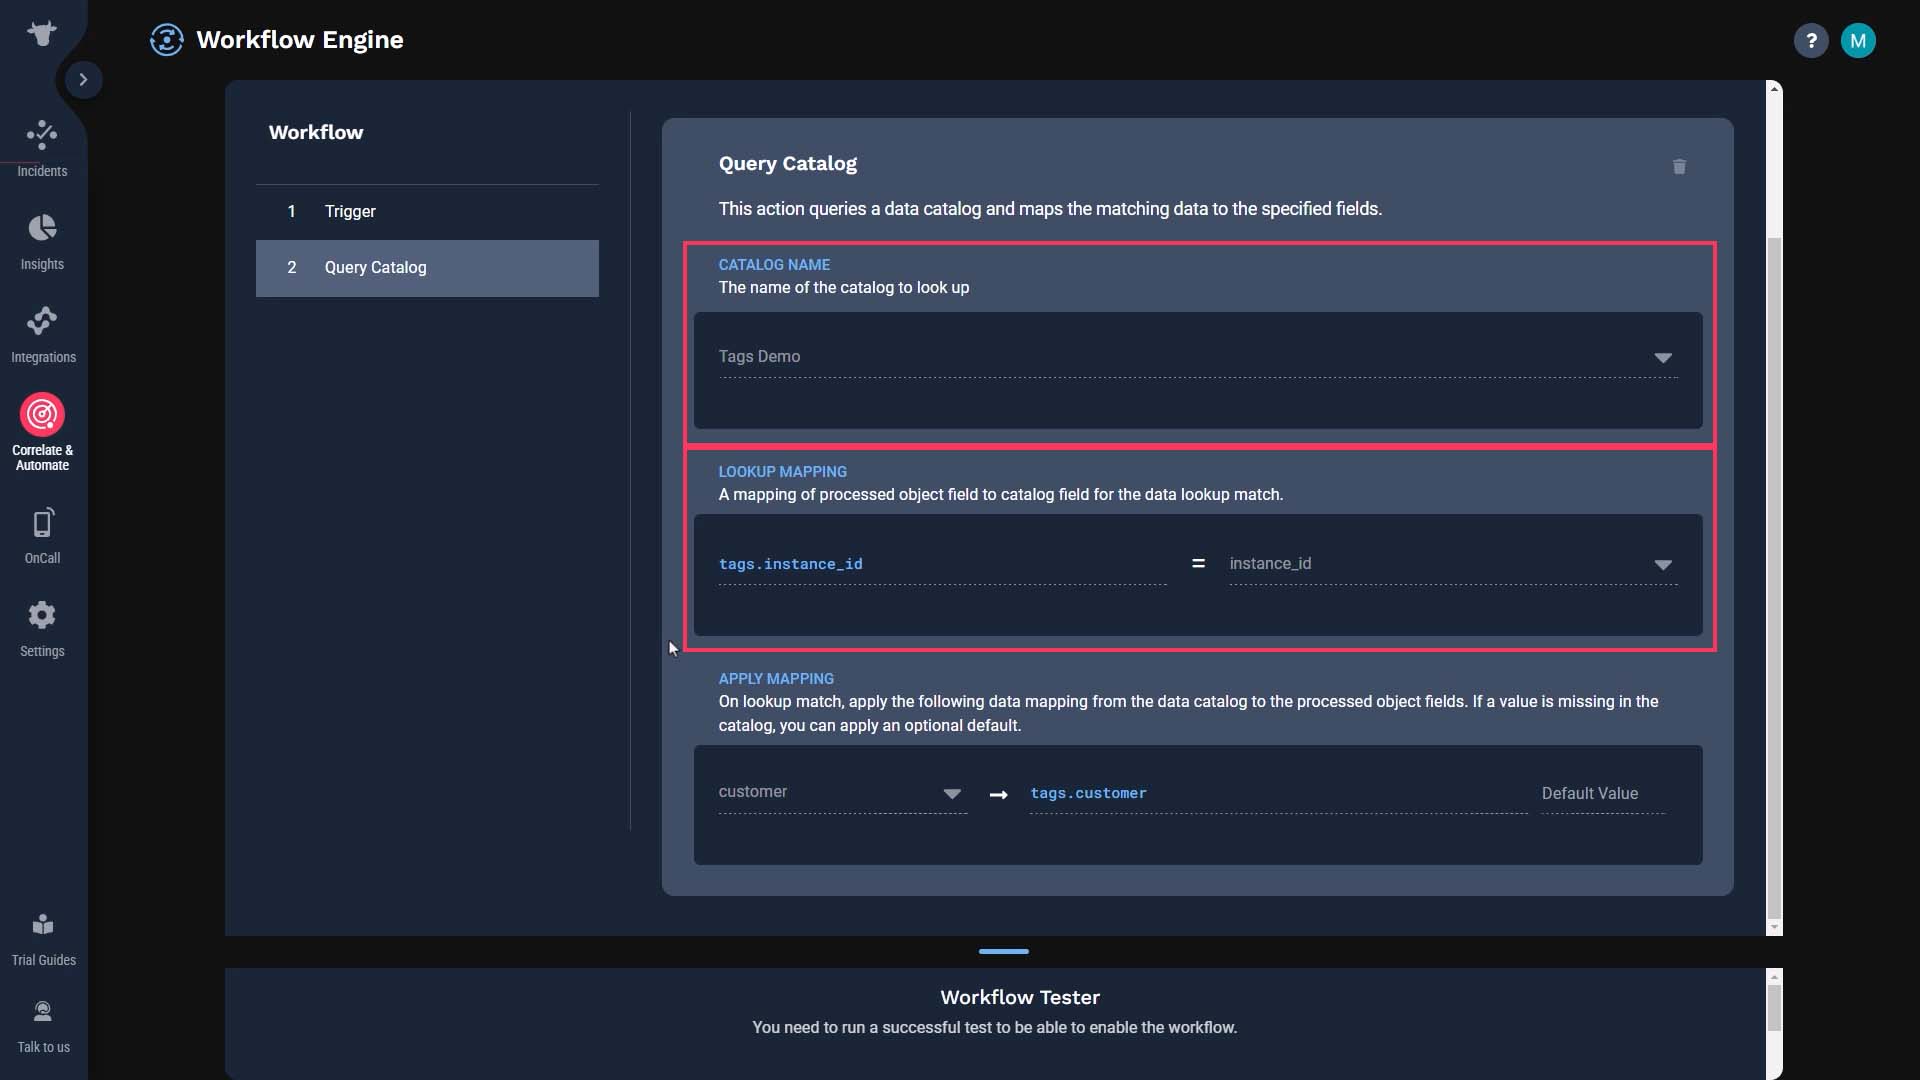
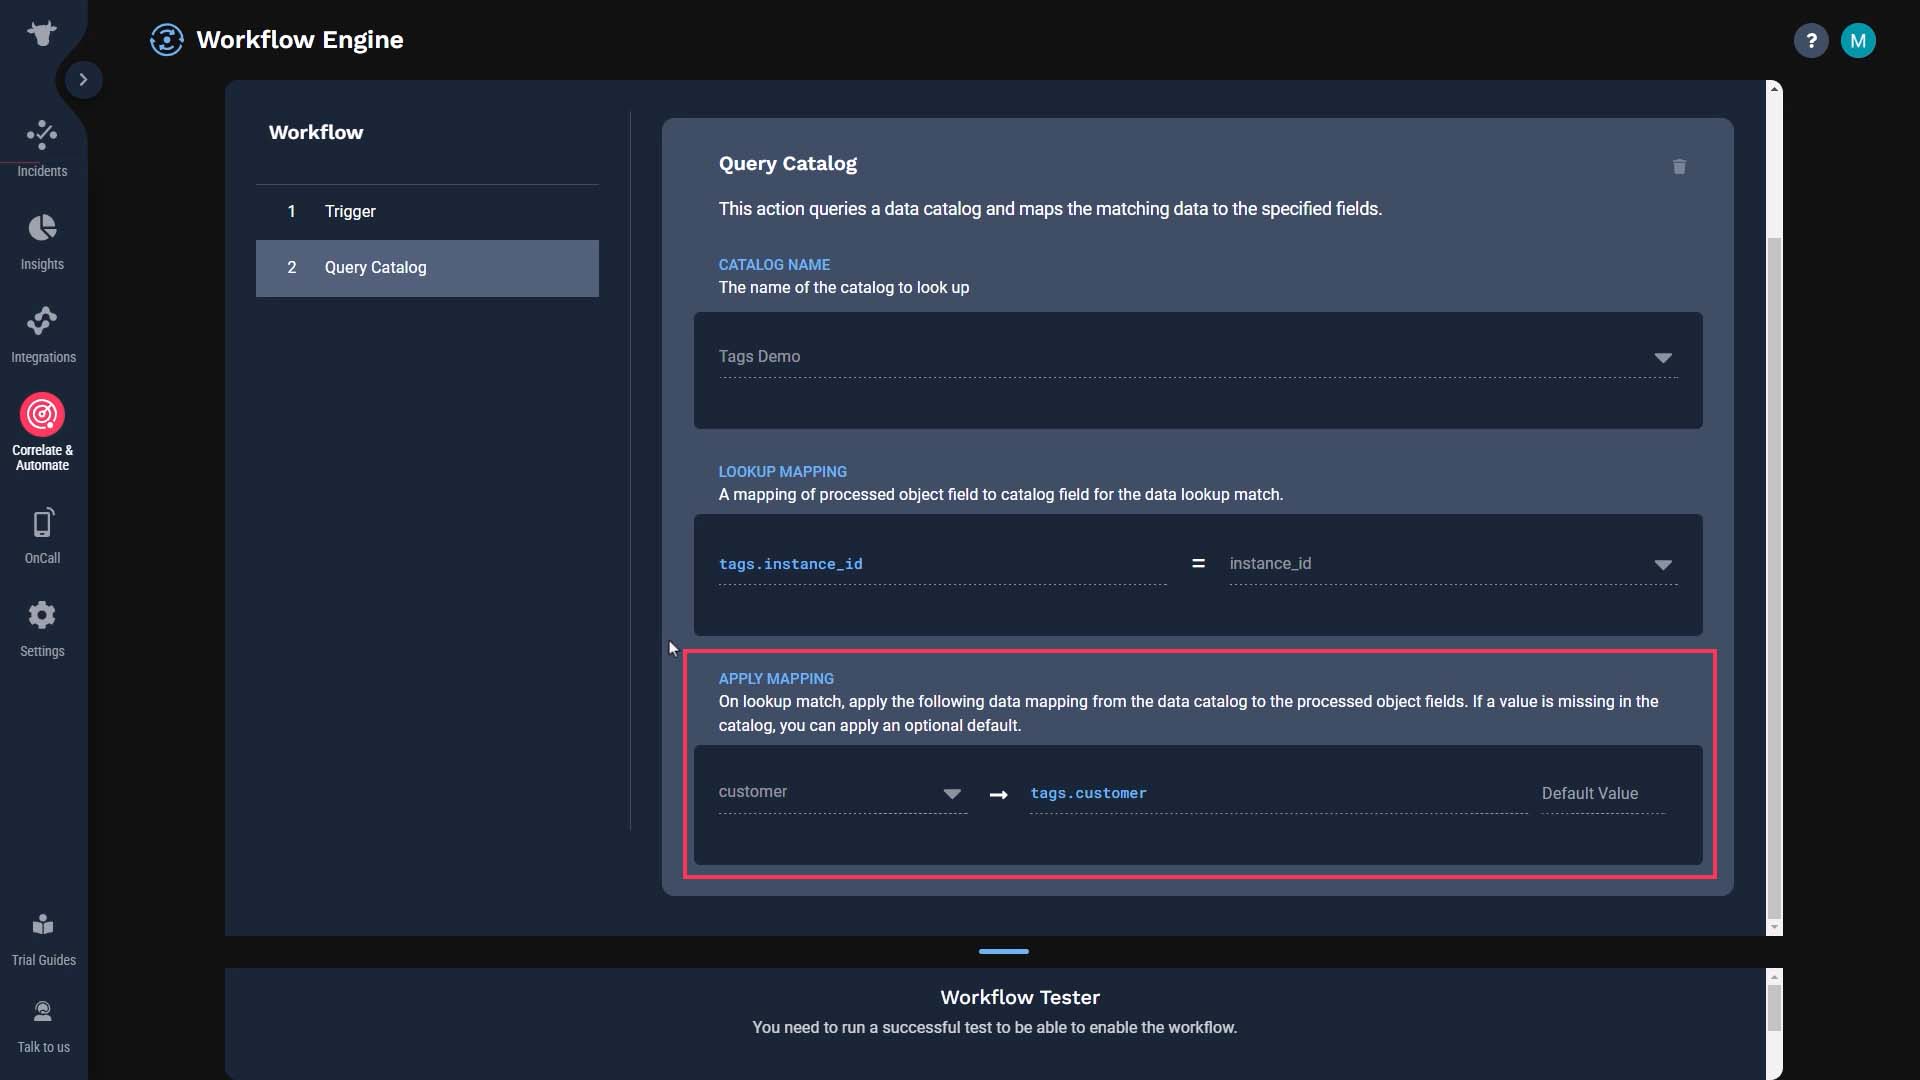
You can generate tags from any workflow action that allows you to specify an output field. For example, Extract Substring or Match and Update.
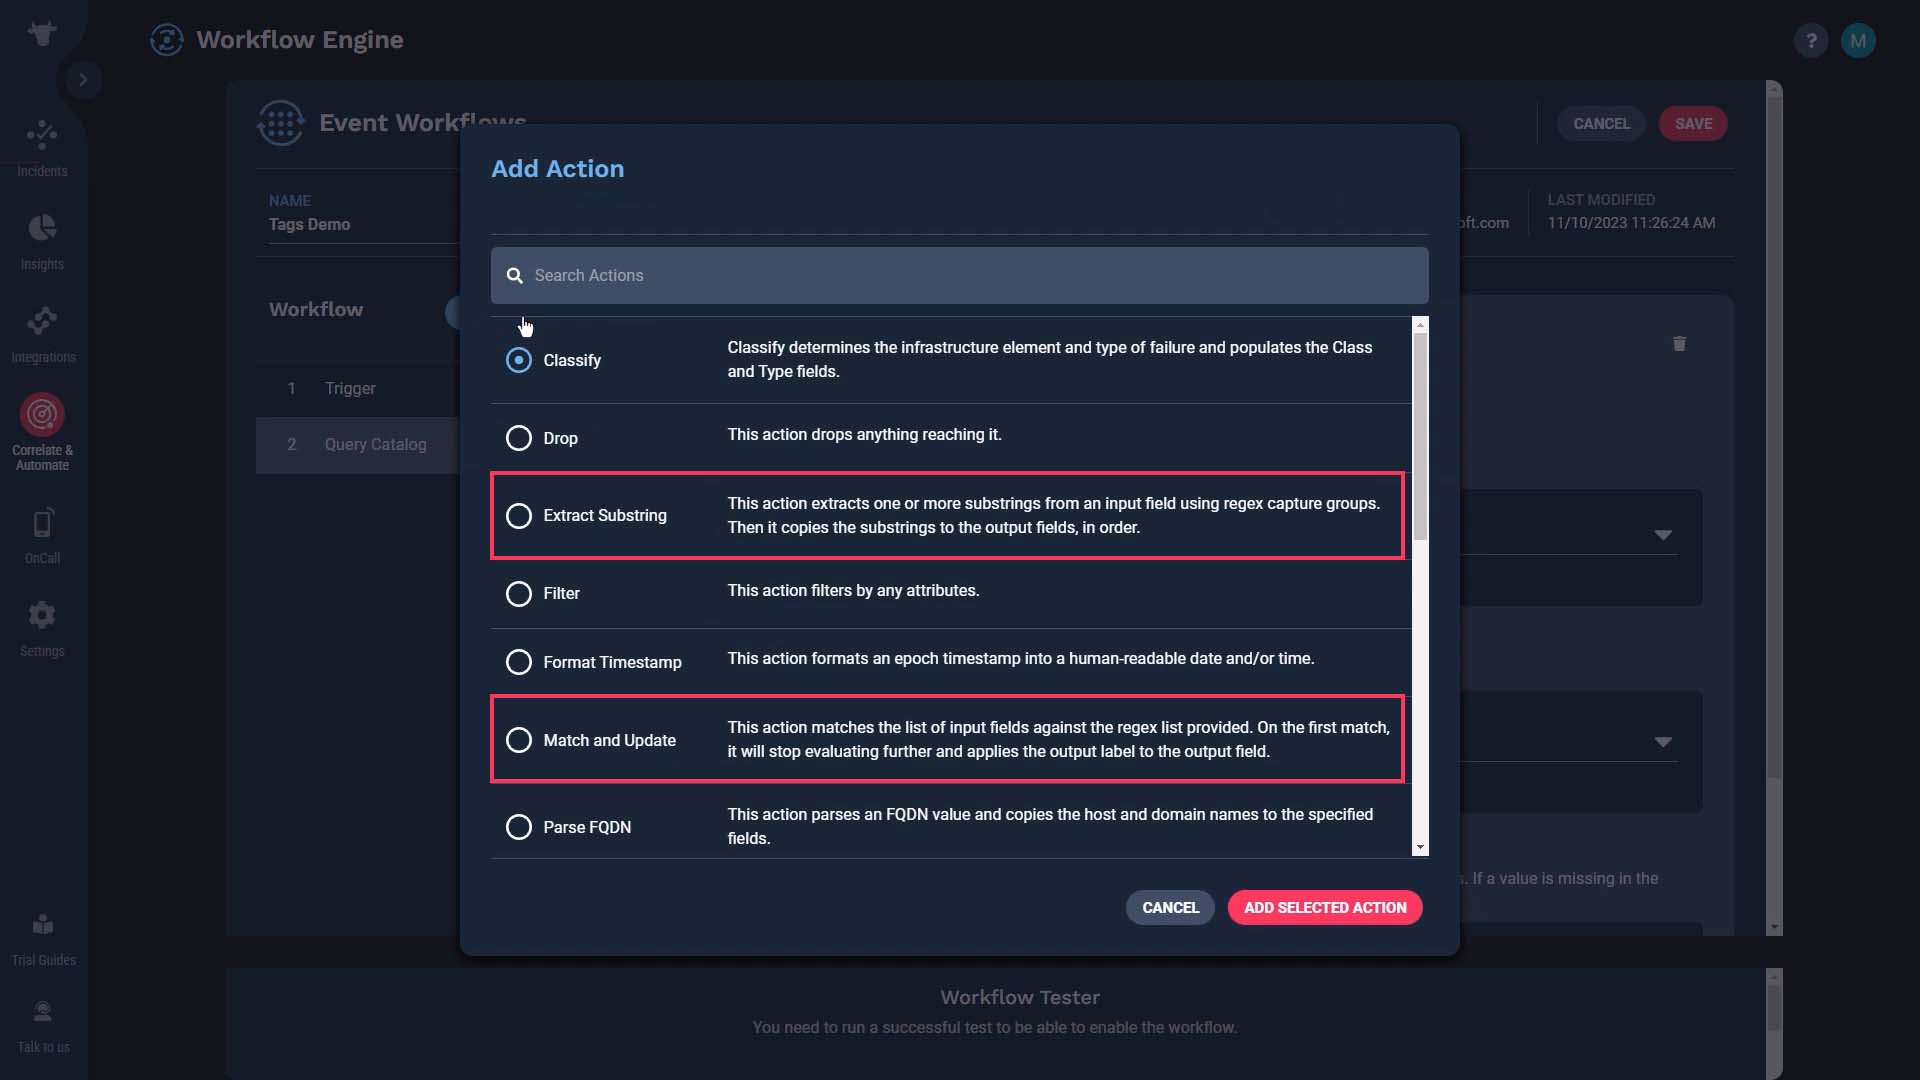
OK, now that you know how to create tags, next, let me show you how to use them.
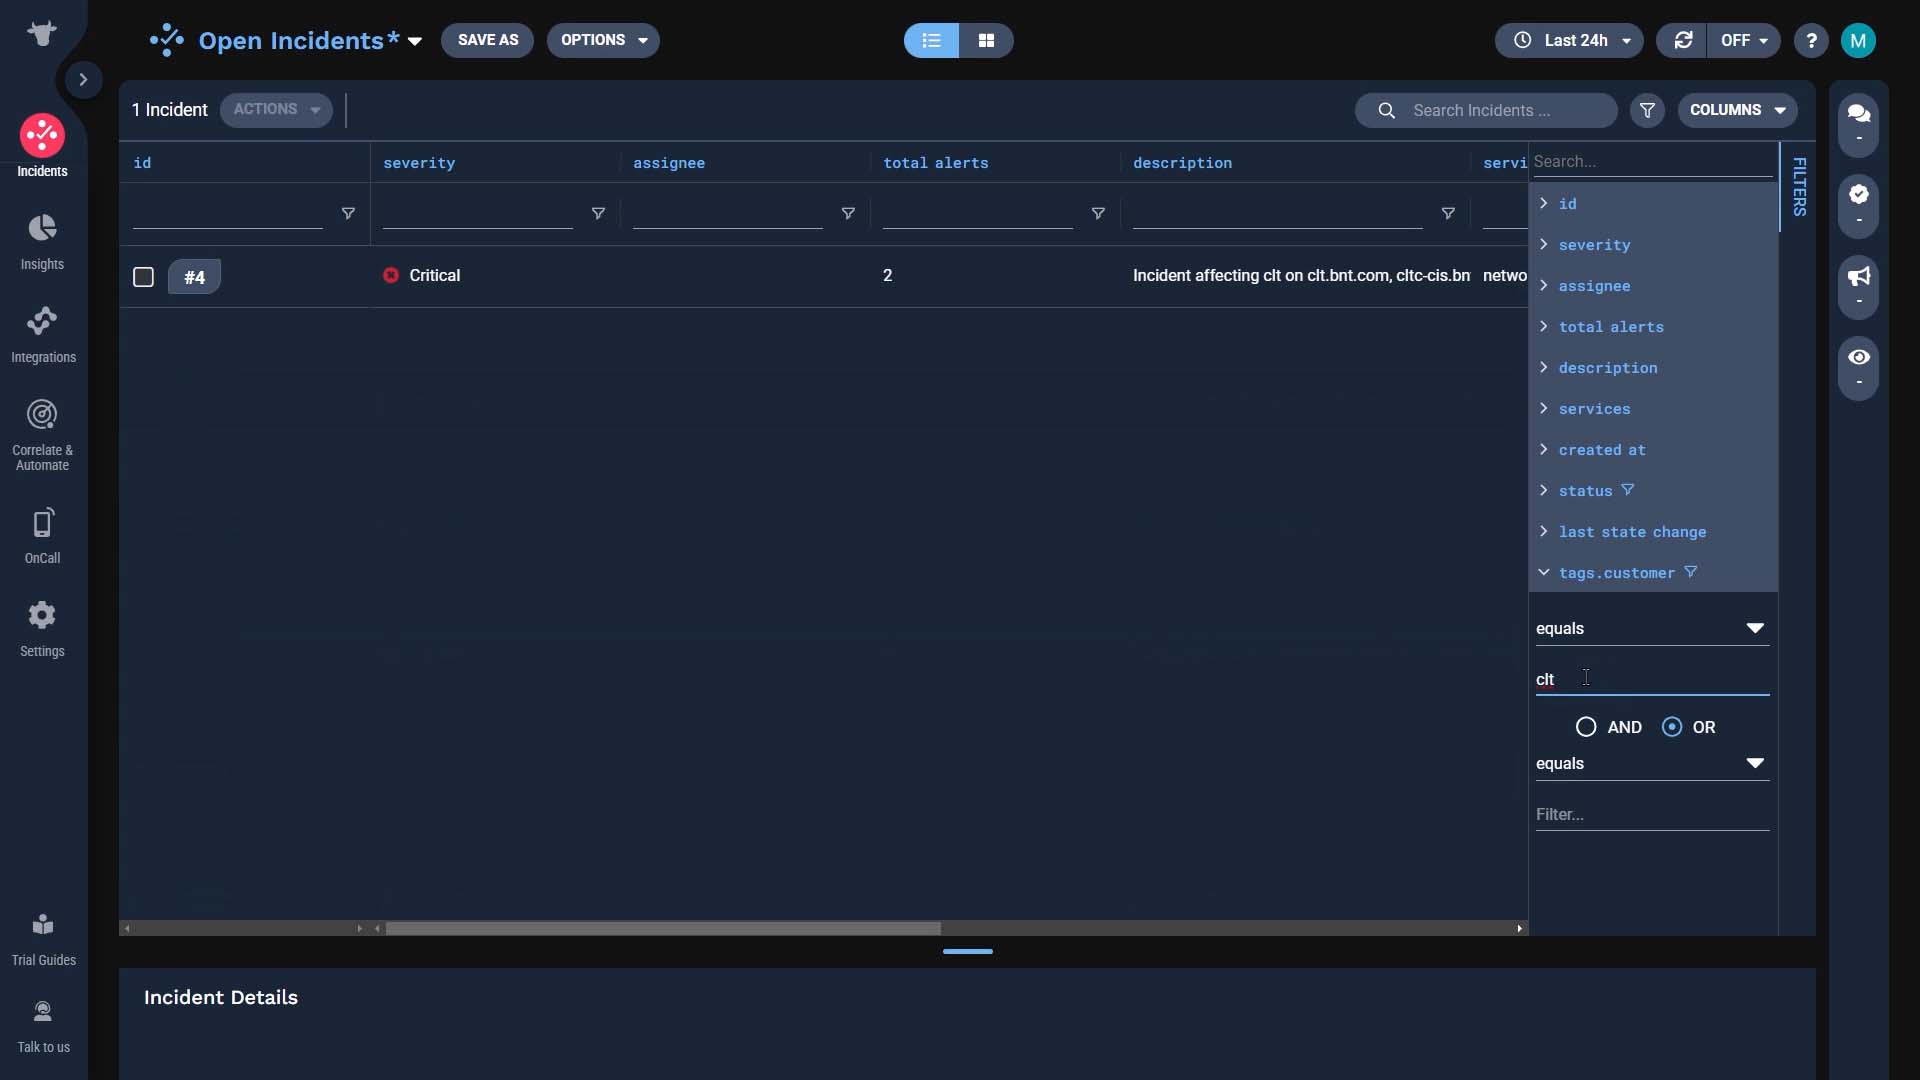
You can use tags to filter a list. We’ll add a column for the customer tag…
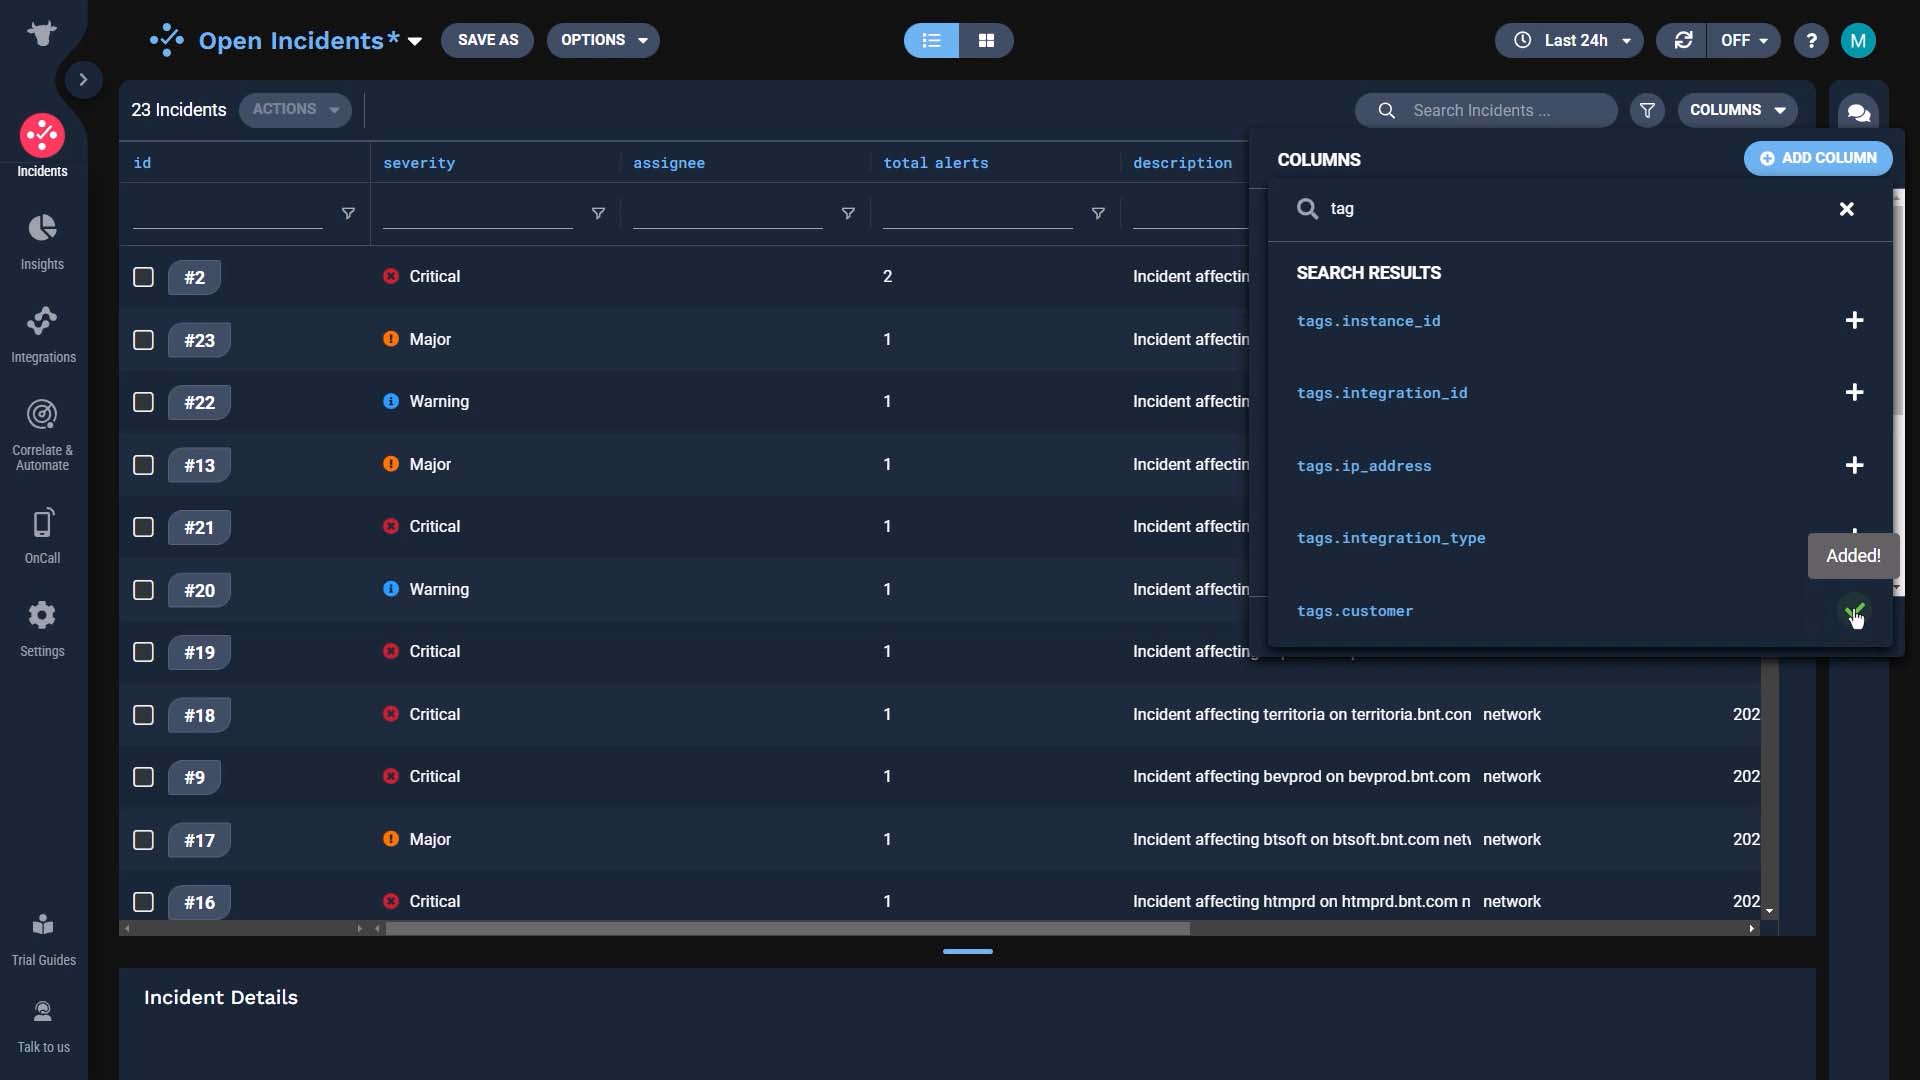
…and filter by the value we want.
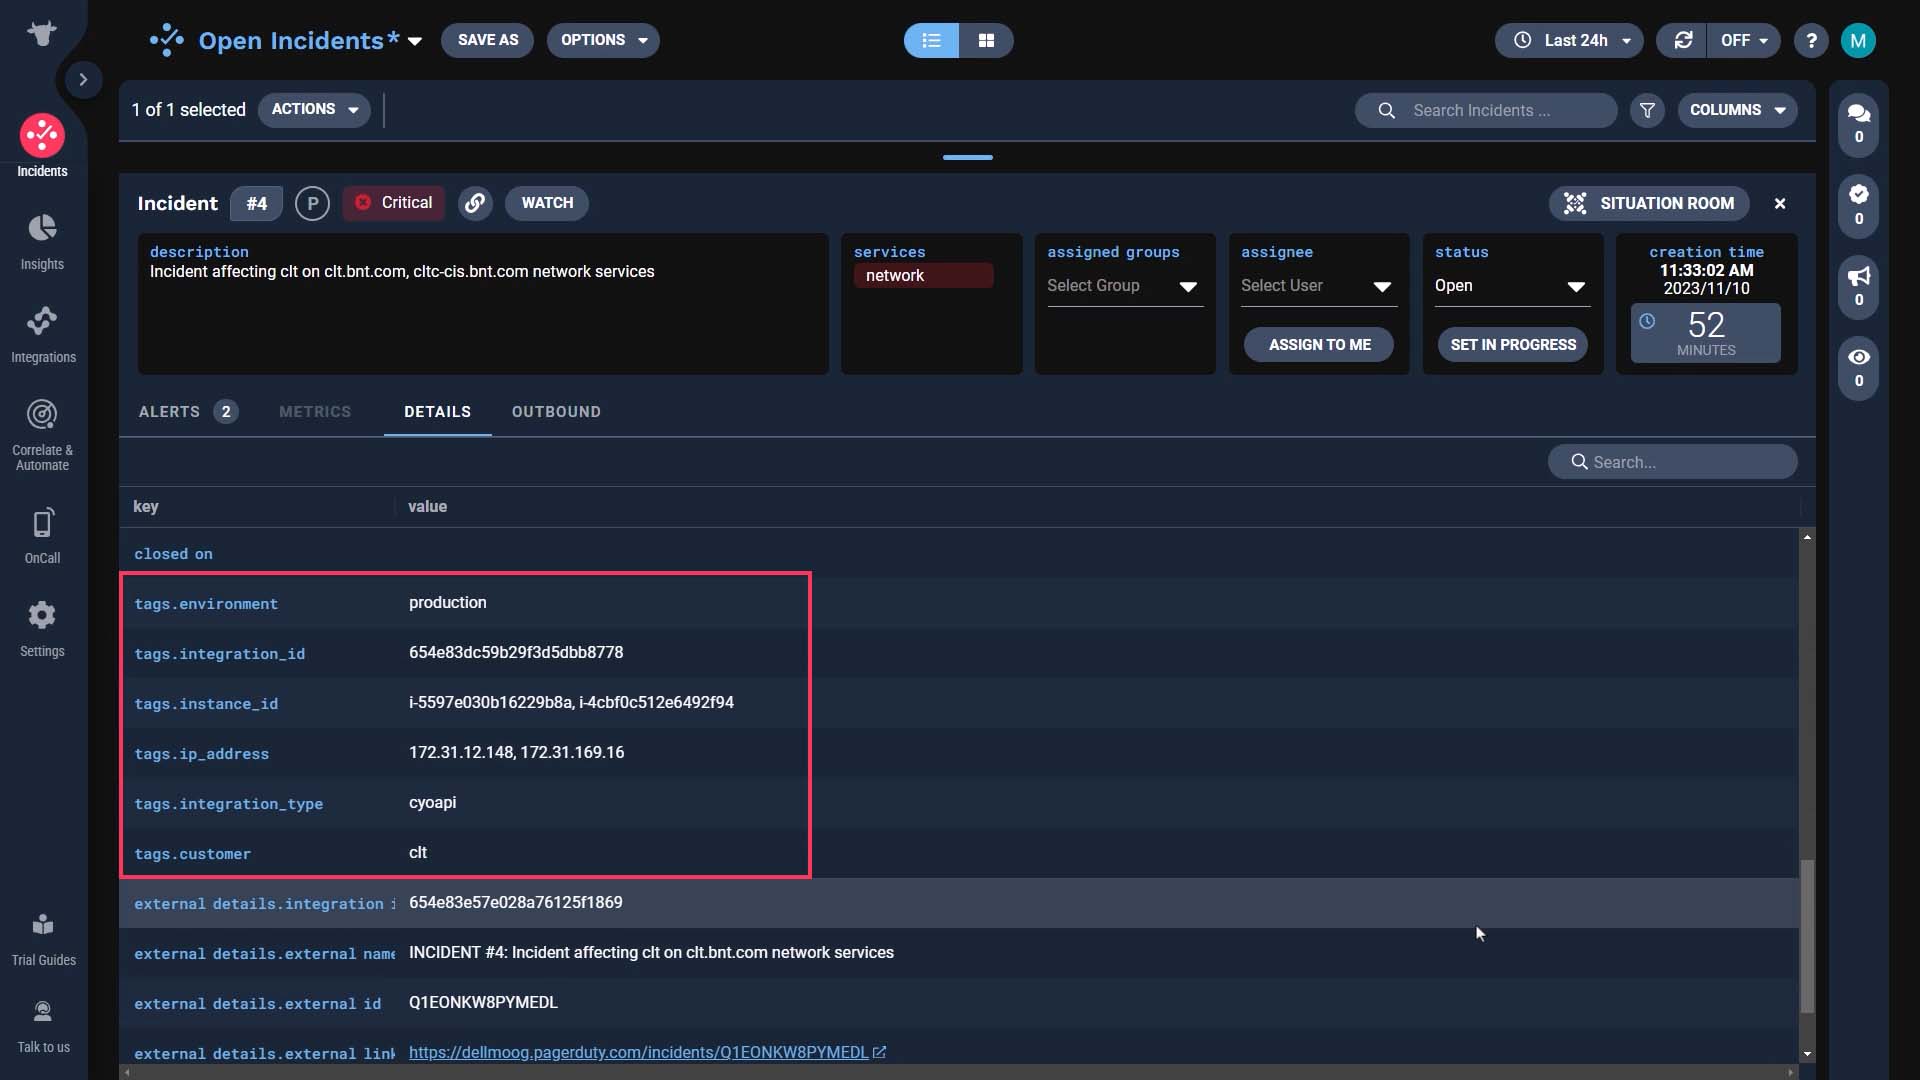
And, you can refer to tags to help with troubleshooting.
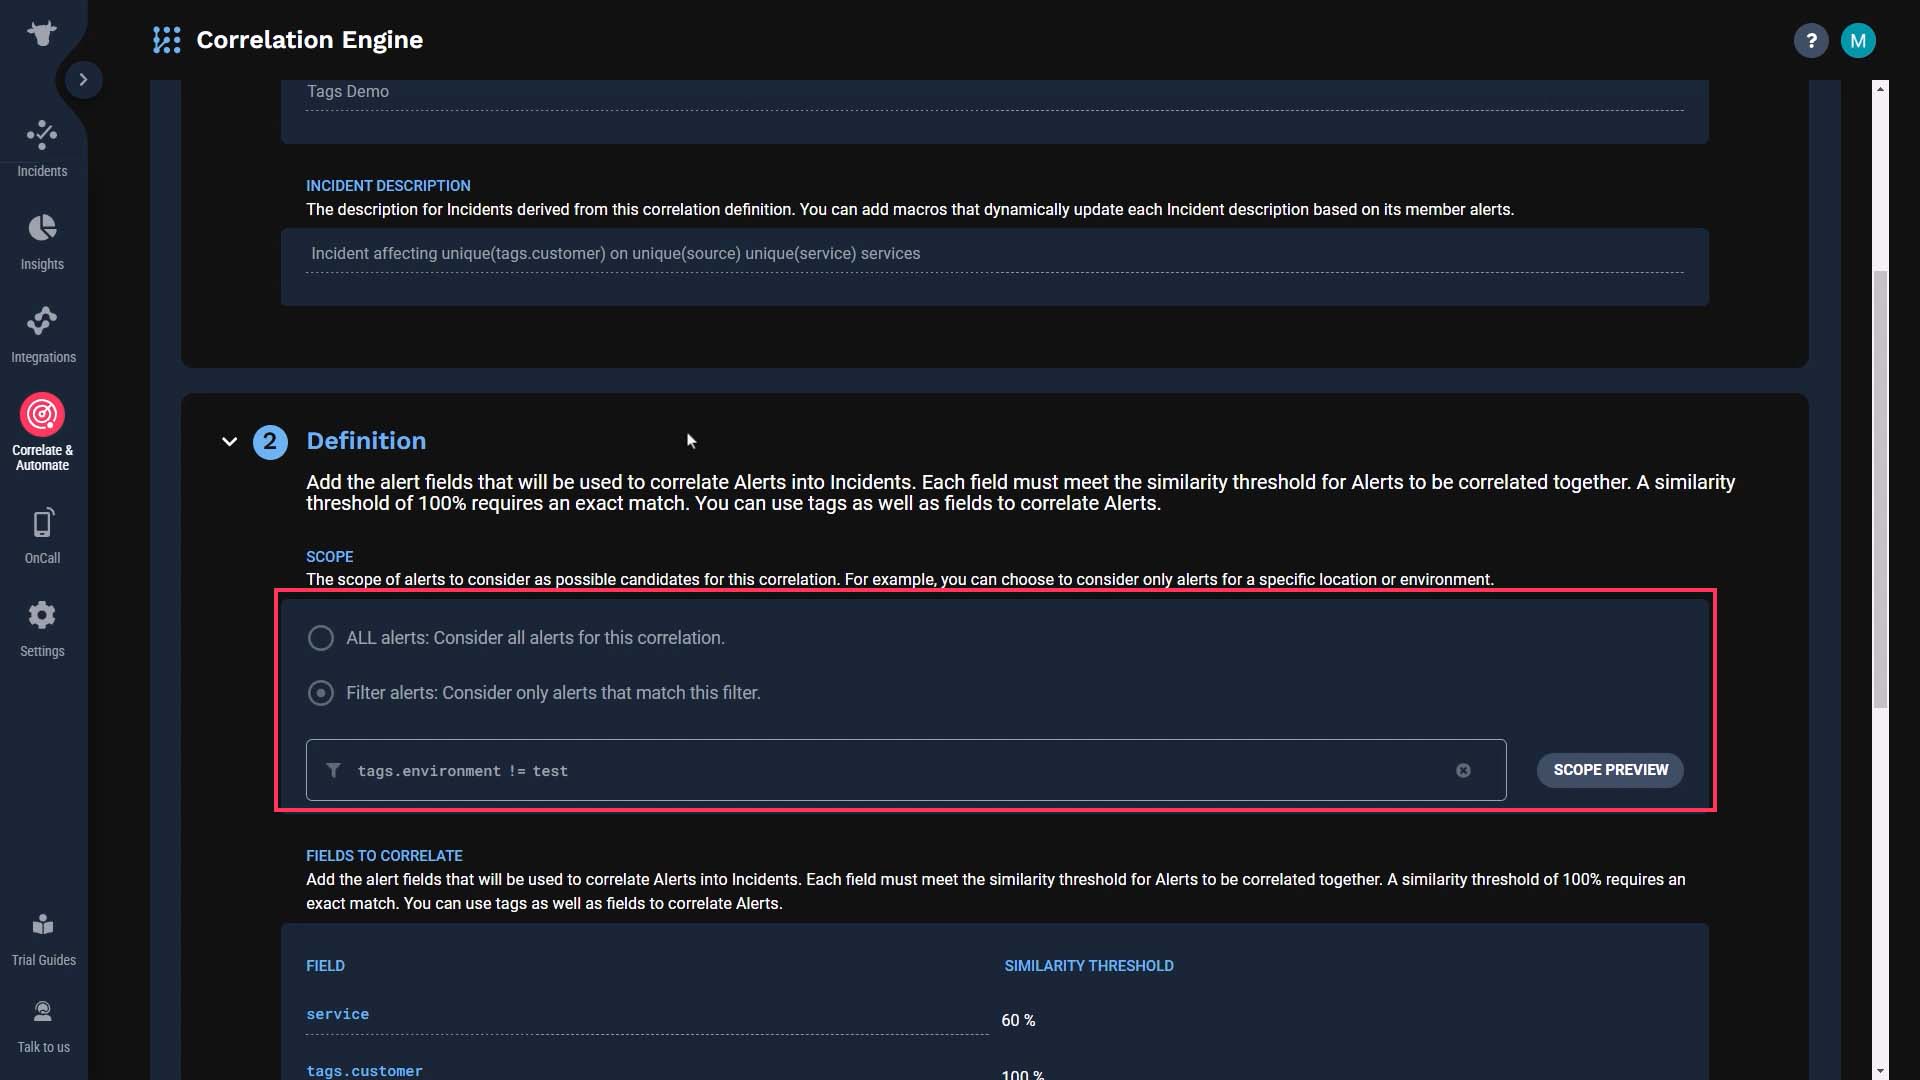
This correlation definition uses tags to filter, and to correlate.
Let’s say the alerts originating in the test environment should not be put through this correlation definition.
Since you have a tag for the environment value, you can use that to filter the alert flow like this.
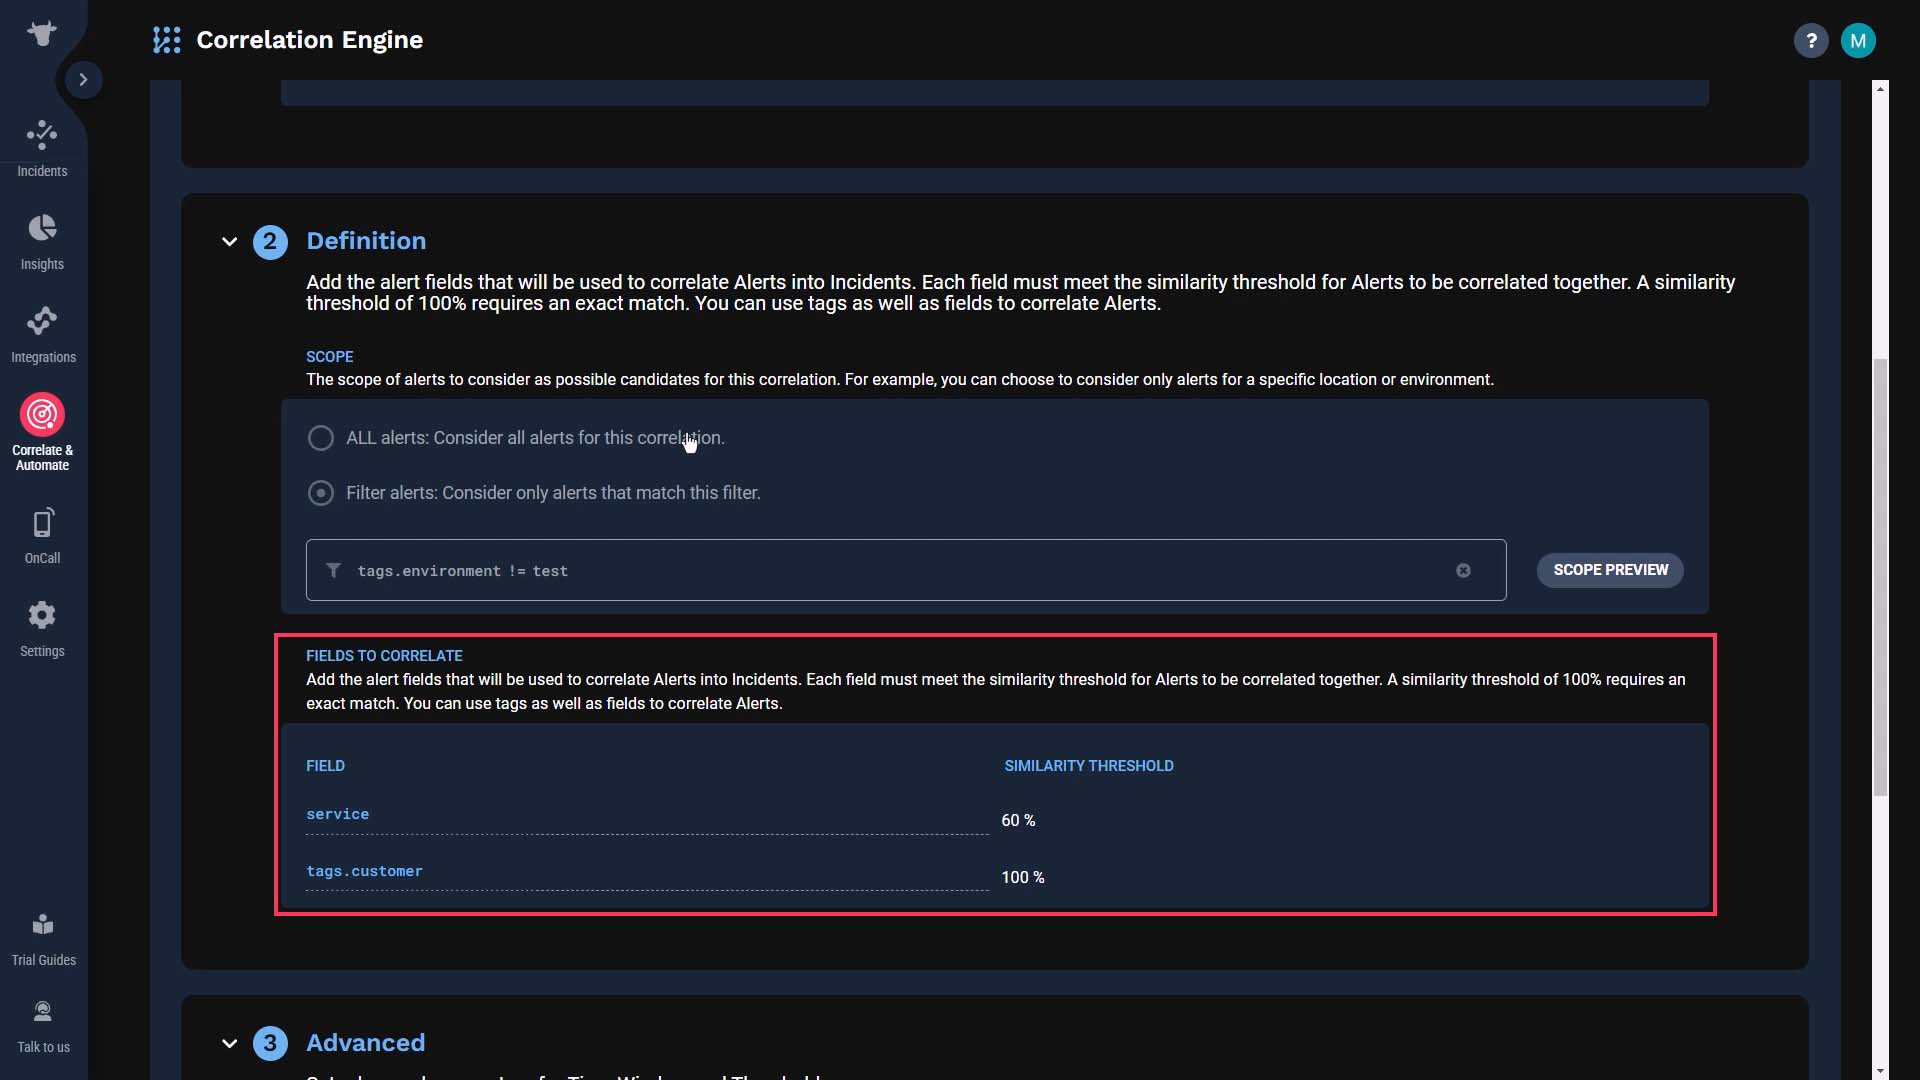
Also, suppose you want to use the customer name to correlate alerts. Here alerts that share the exact same value for the customer tag and similar values for service are grouped together into an incident.
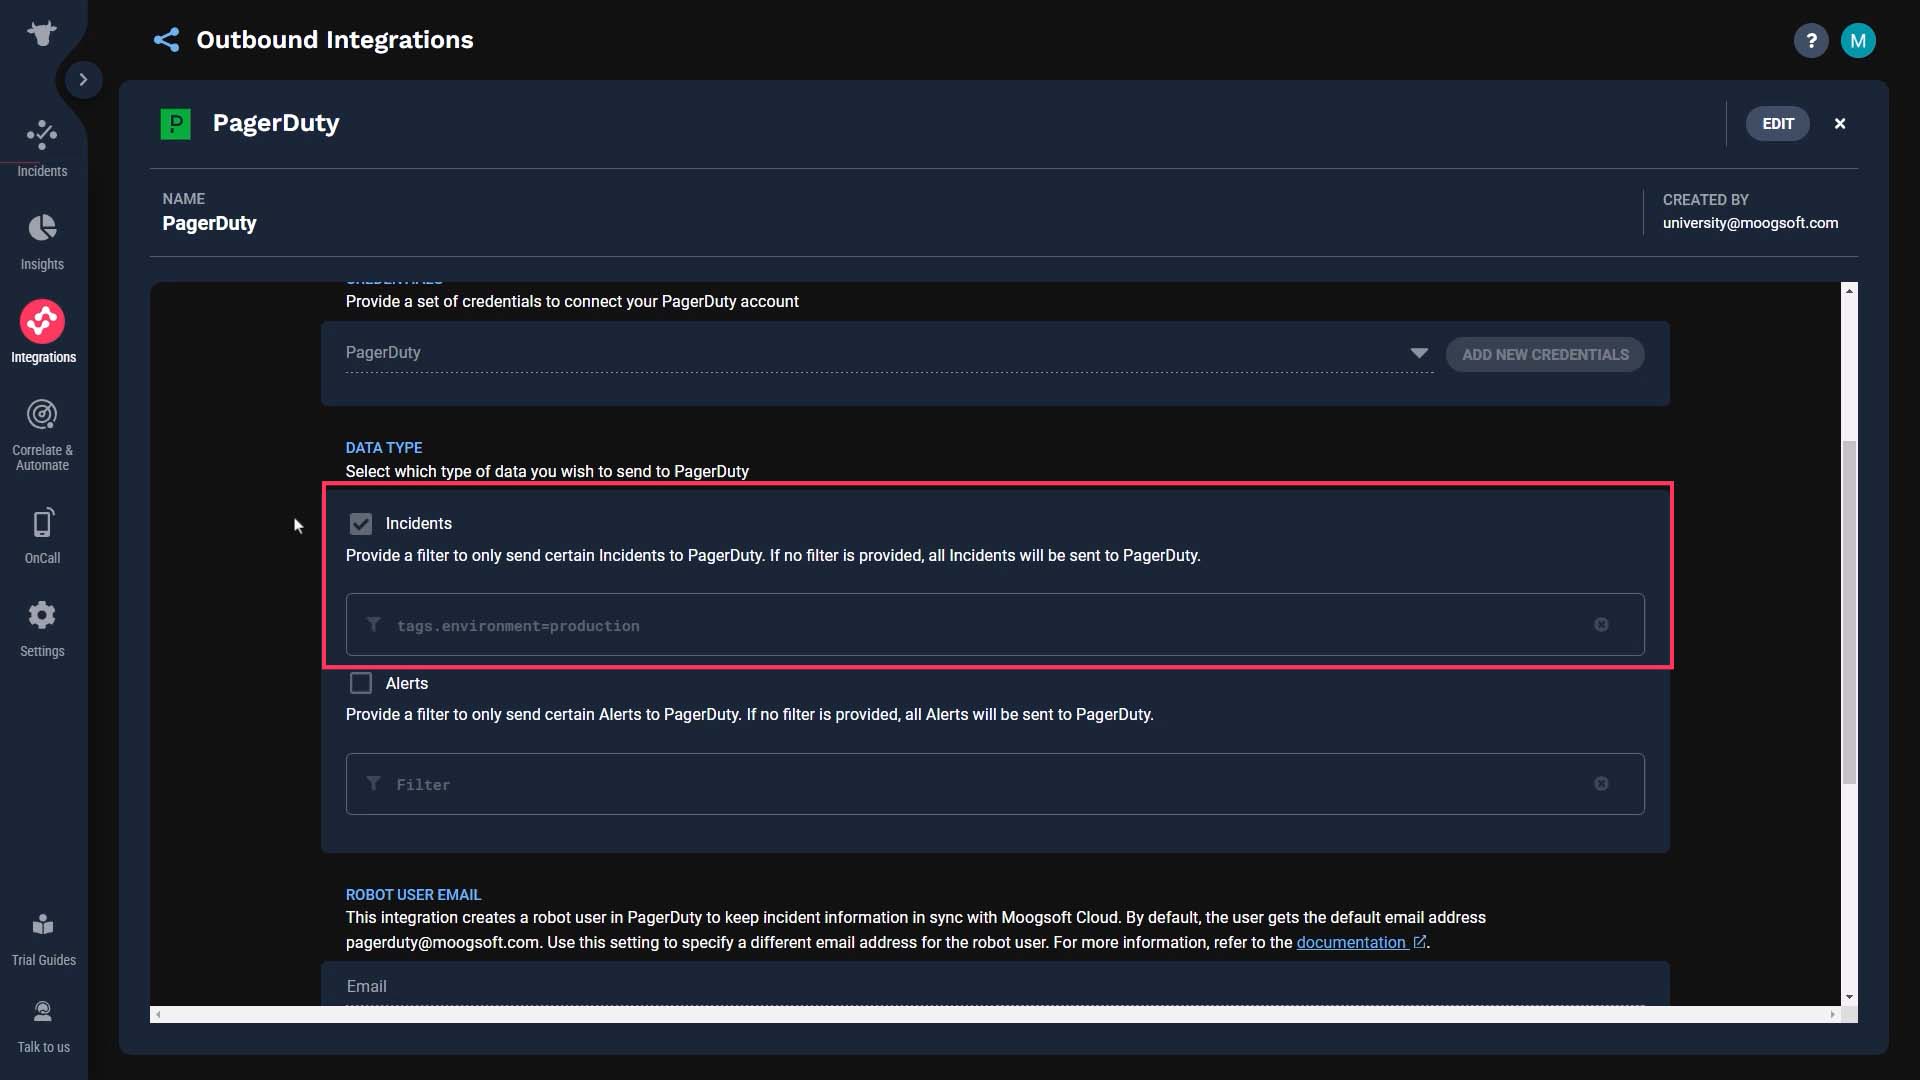
Another place you can use tags is routing. Let’s say your support team uses PagerDuty to respond to customer-impacting incidents. So you want to route production incidents to PagerDuty, but not incidents affecting the development or test servers.
Here, we’ve used the environment tag to create a filter so only production incidents will be routed to this integration.
Now you know how to use tags. Thanks for watching.
Now you know how to Thanks for watching!