PROD 110: APEX AIOps Incident Management Operator/End User Training
BASIC | 34 MIN
This course is for users who will be handling incidents in APEX AIOps Incident Management. You will learn what Incident Management does and how it helps your day to day operations, then proceed to get familiar with the workflow of investigating and resolving incidents.
Whether you are completely new to Incident Management, or moving from Moogsoft Onprem, this course will get you ready to work with your own incidents.
BASIC | 4 MIN
With this video, get familiar with a typical workflow for a Moogsoft user.
Use case walkthrough: User workflow in APEX AIOps Incident Management ►
This video provides a use case walkthrough of what a typical workflow might look like for an Incident Management user as they resolve incidents.
In this video, we will step through the typical workflow of an APEX AIOps Incident Management user as they work through incidents.
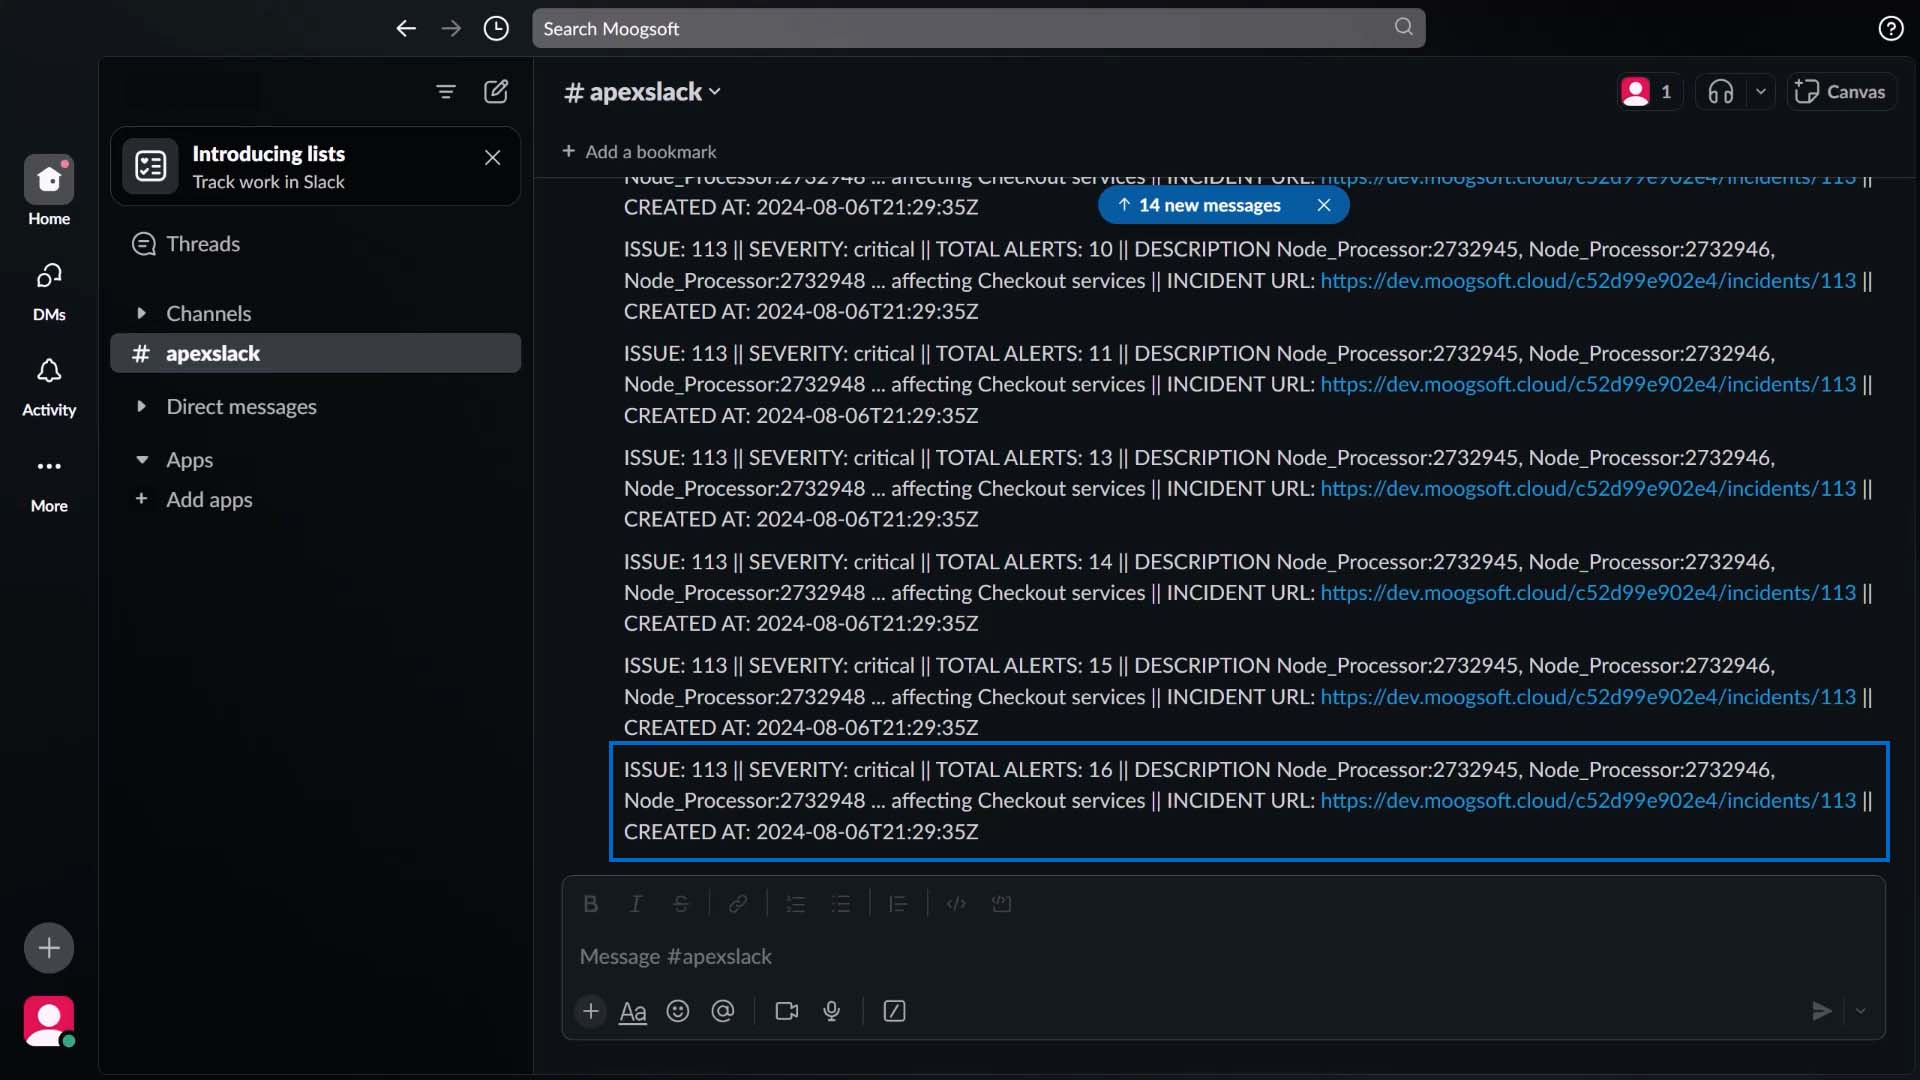
Here comes a slack message, notifying us there’s a critical incident requiring our attention.
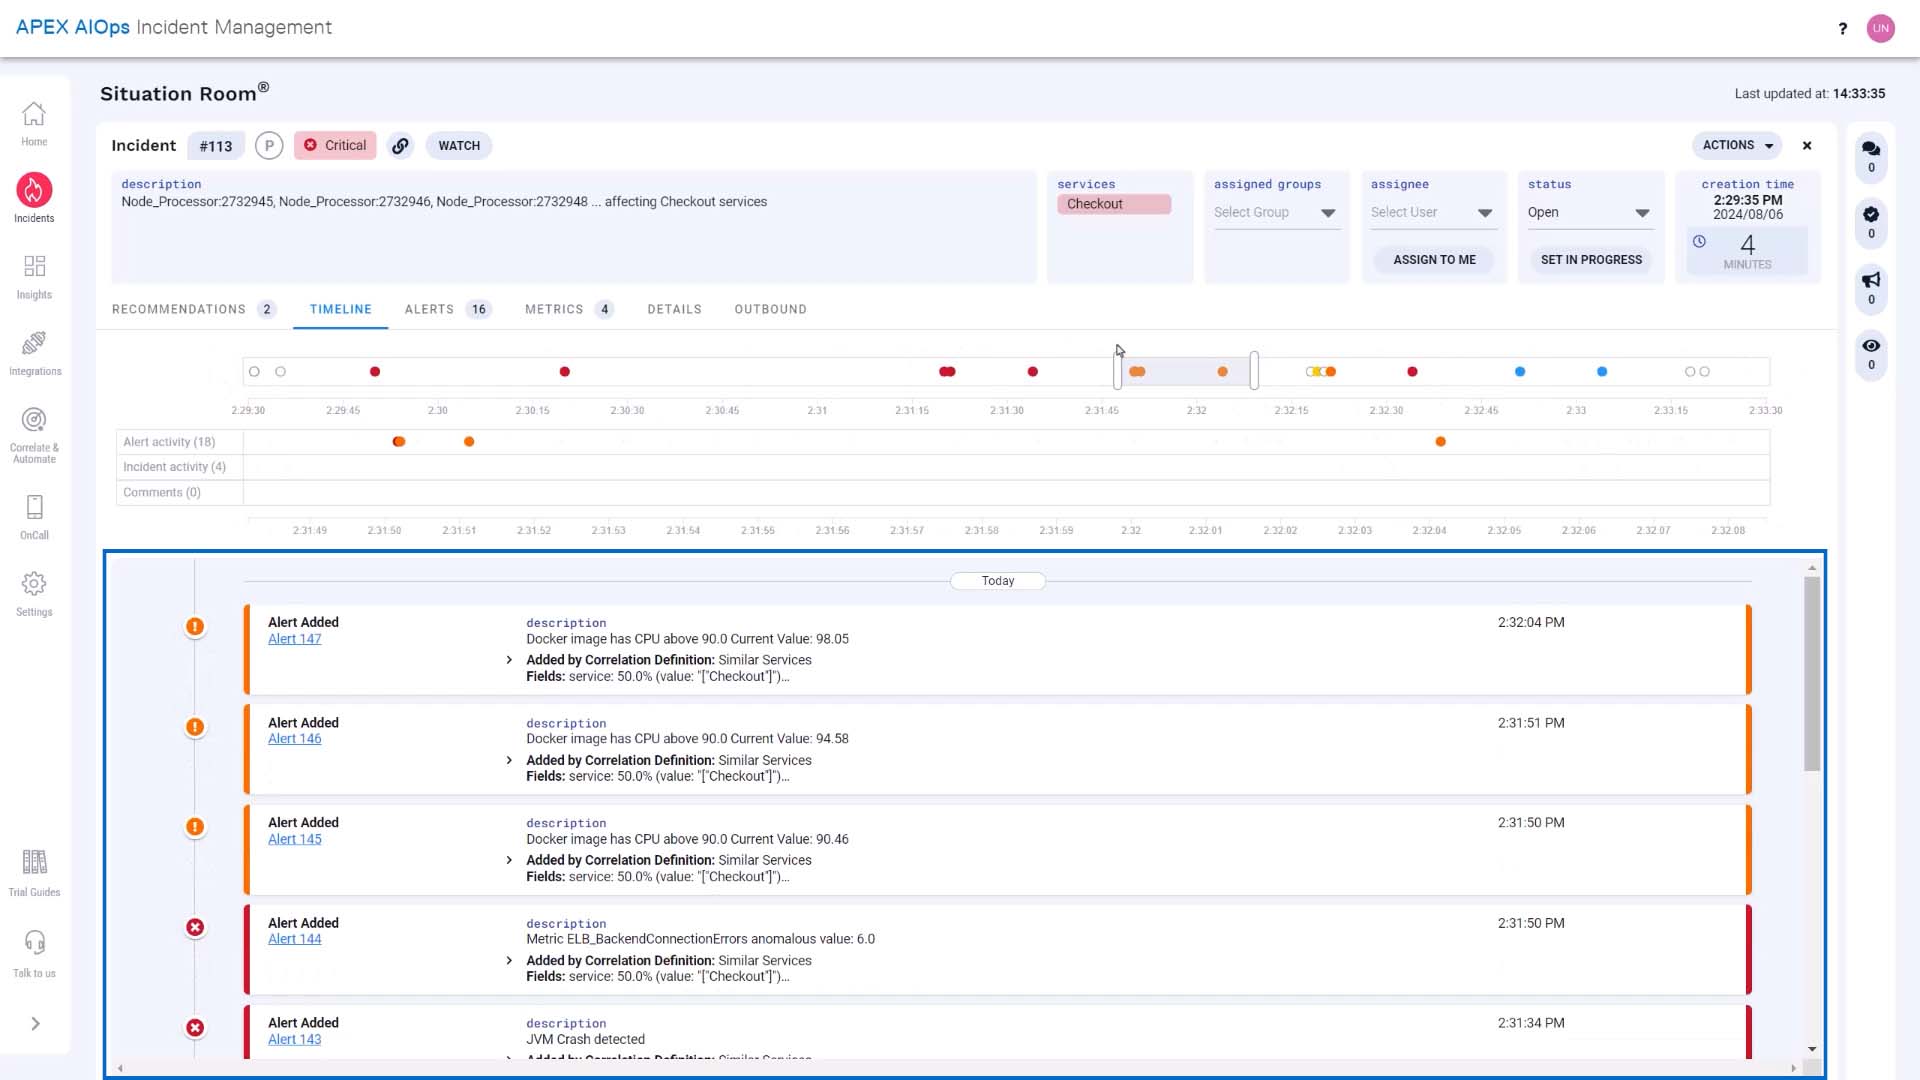
So we click through to Incident Management, which takes us to this incident’s Situation Room.
The Situation Room is where you and your team can collaborate on an incident. This is the timeline for this incident. These sliders let you zoom in on particular areas, and the list below filters to match the time frame you choose.
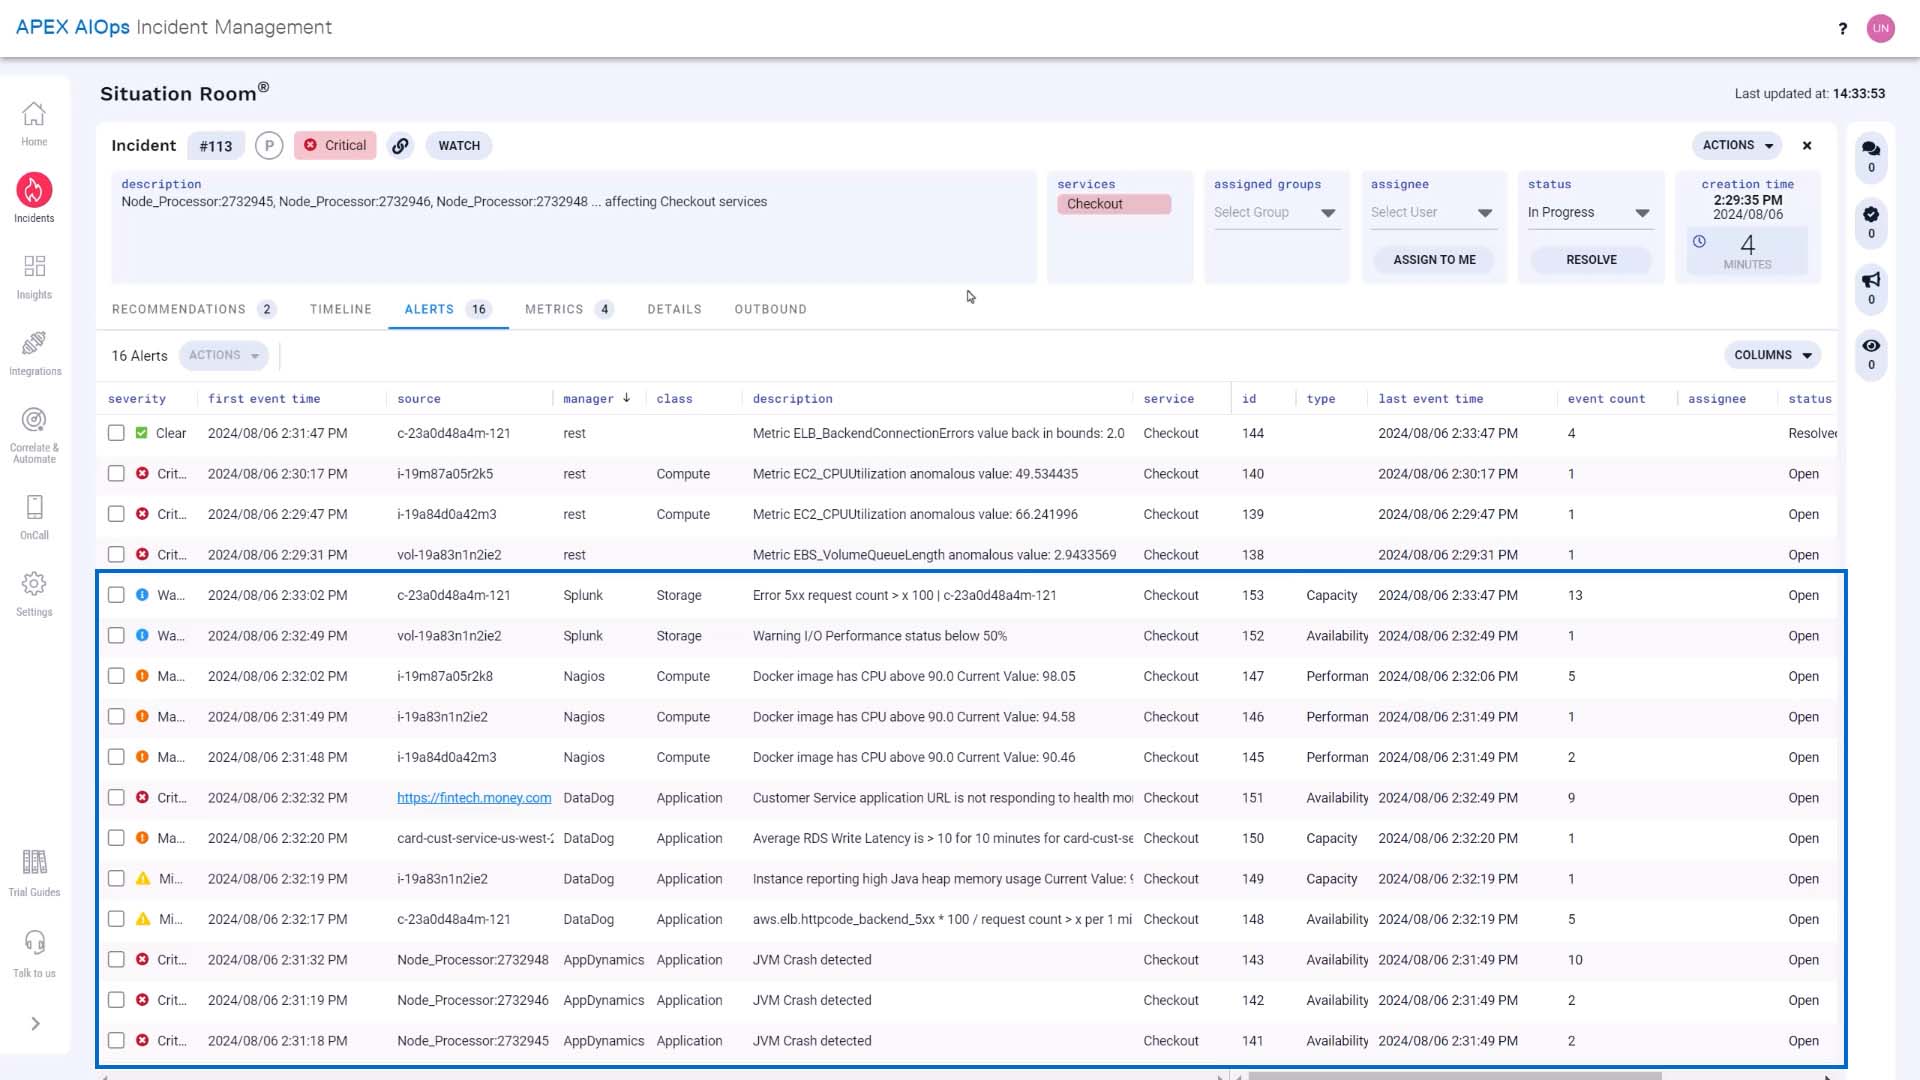
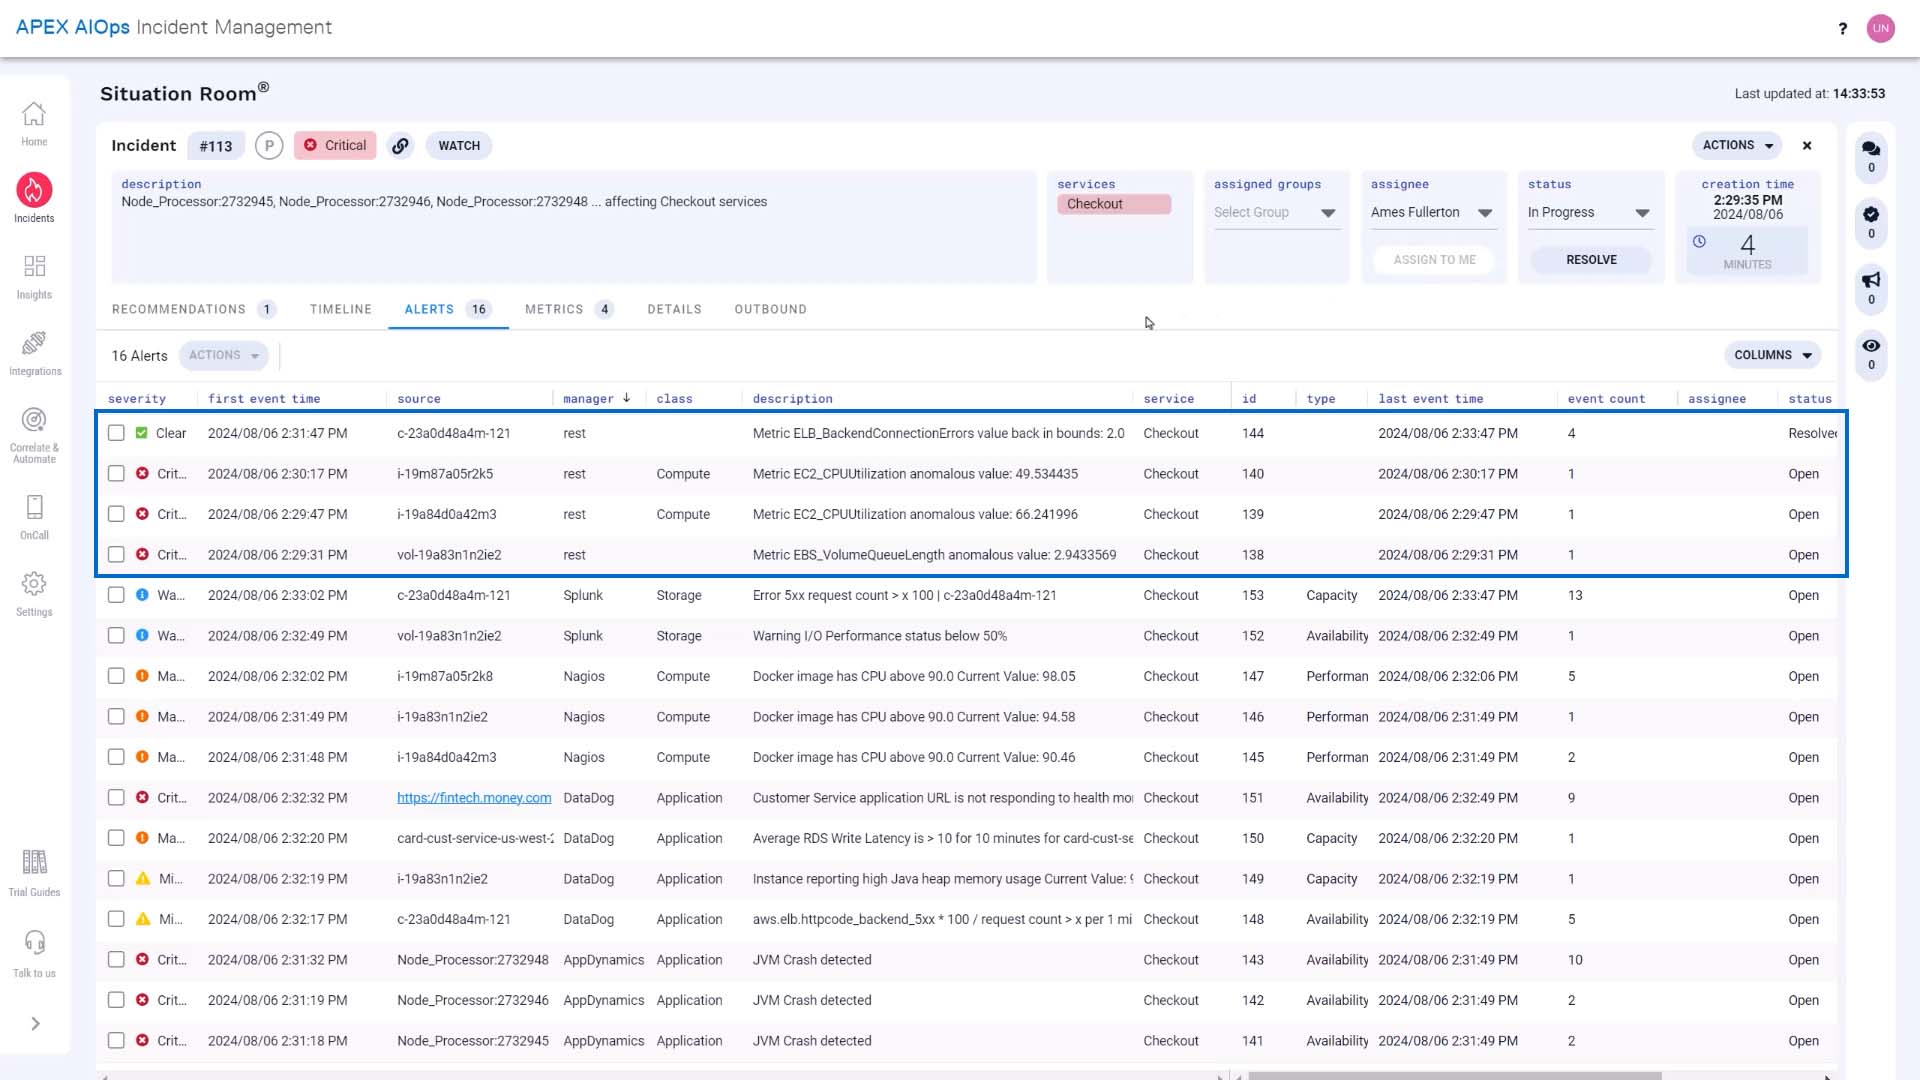
Let’s examine all alerts. These are the alerts that make up this incident. Some of these are alerts from a monitoring system.
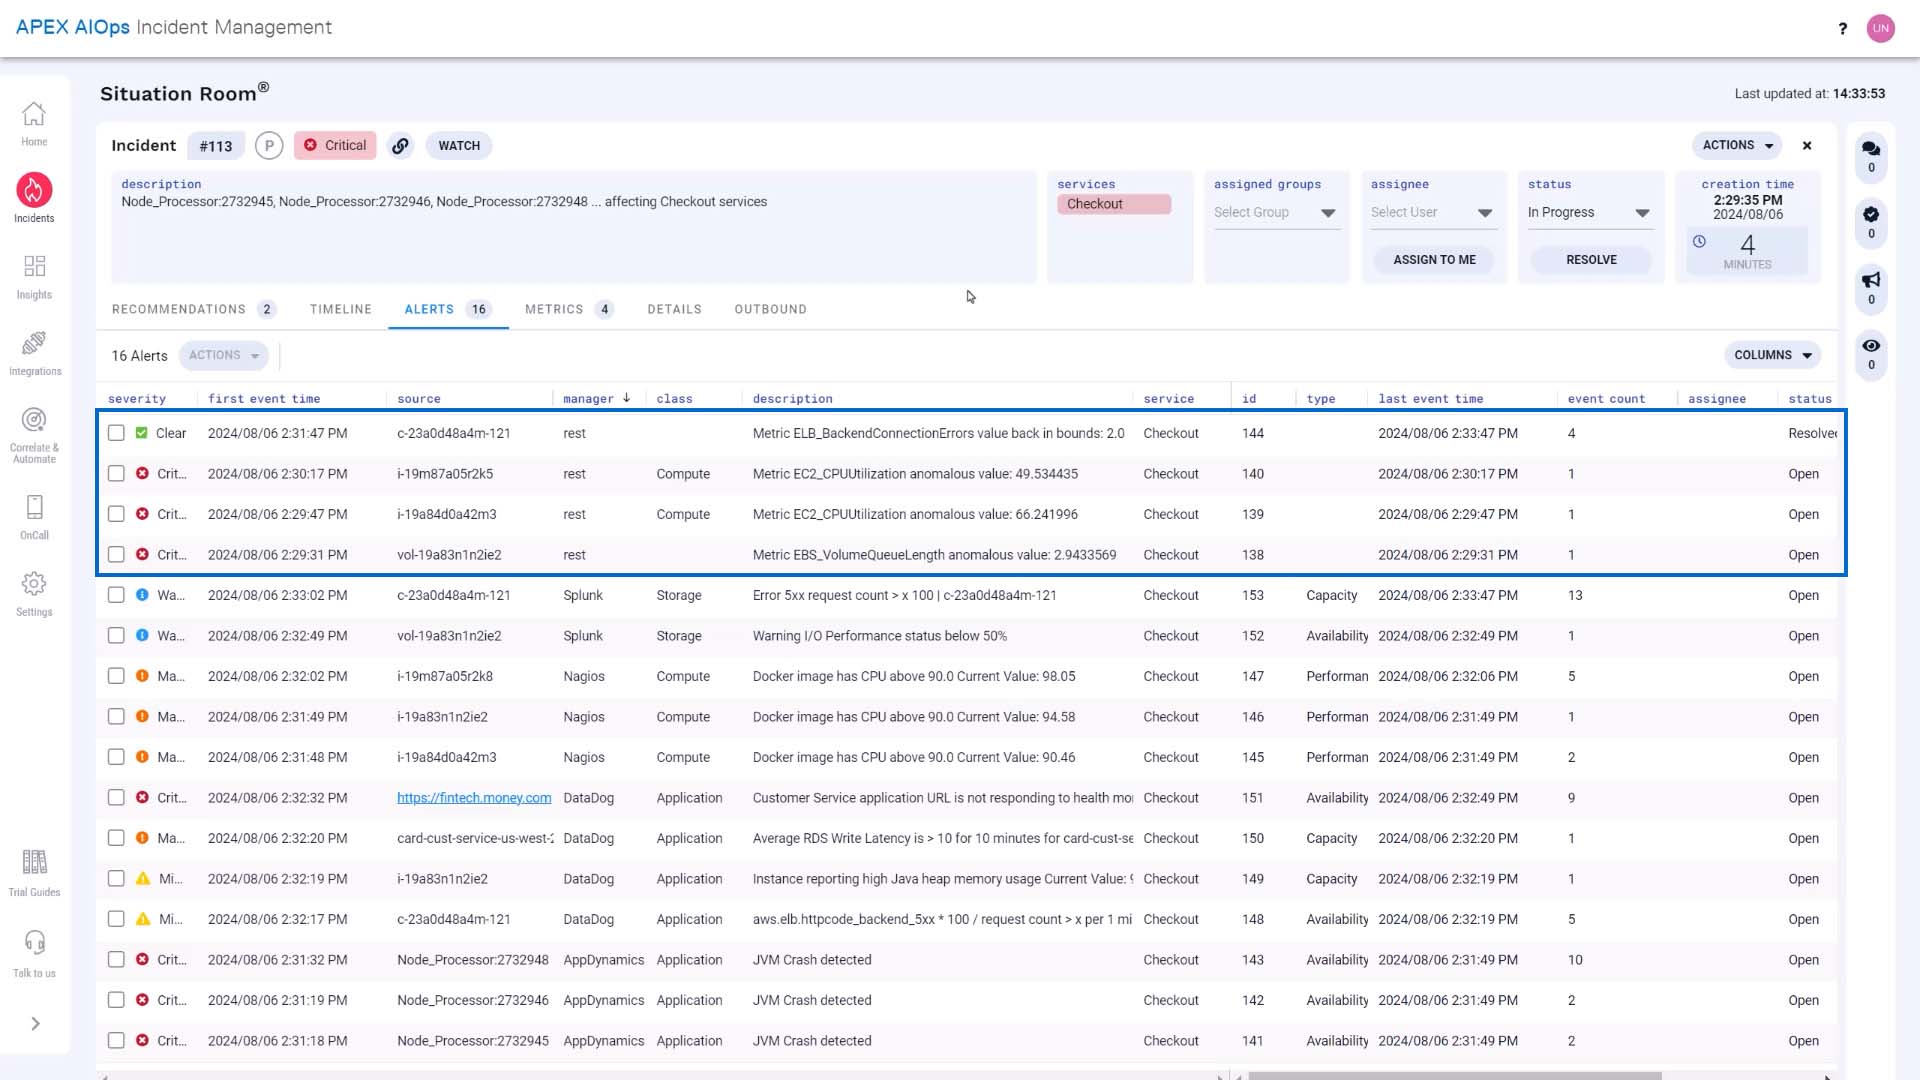
And these are alerts generated by Incident Management based on the metrics it is tracking.
We are going to own this incident.
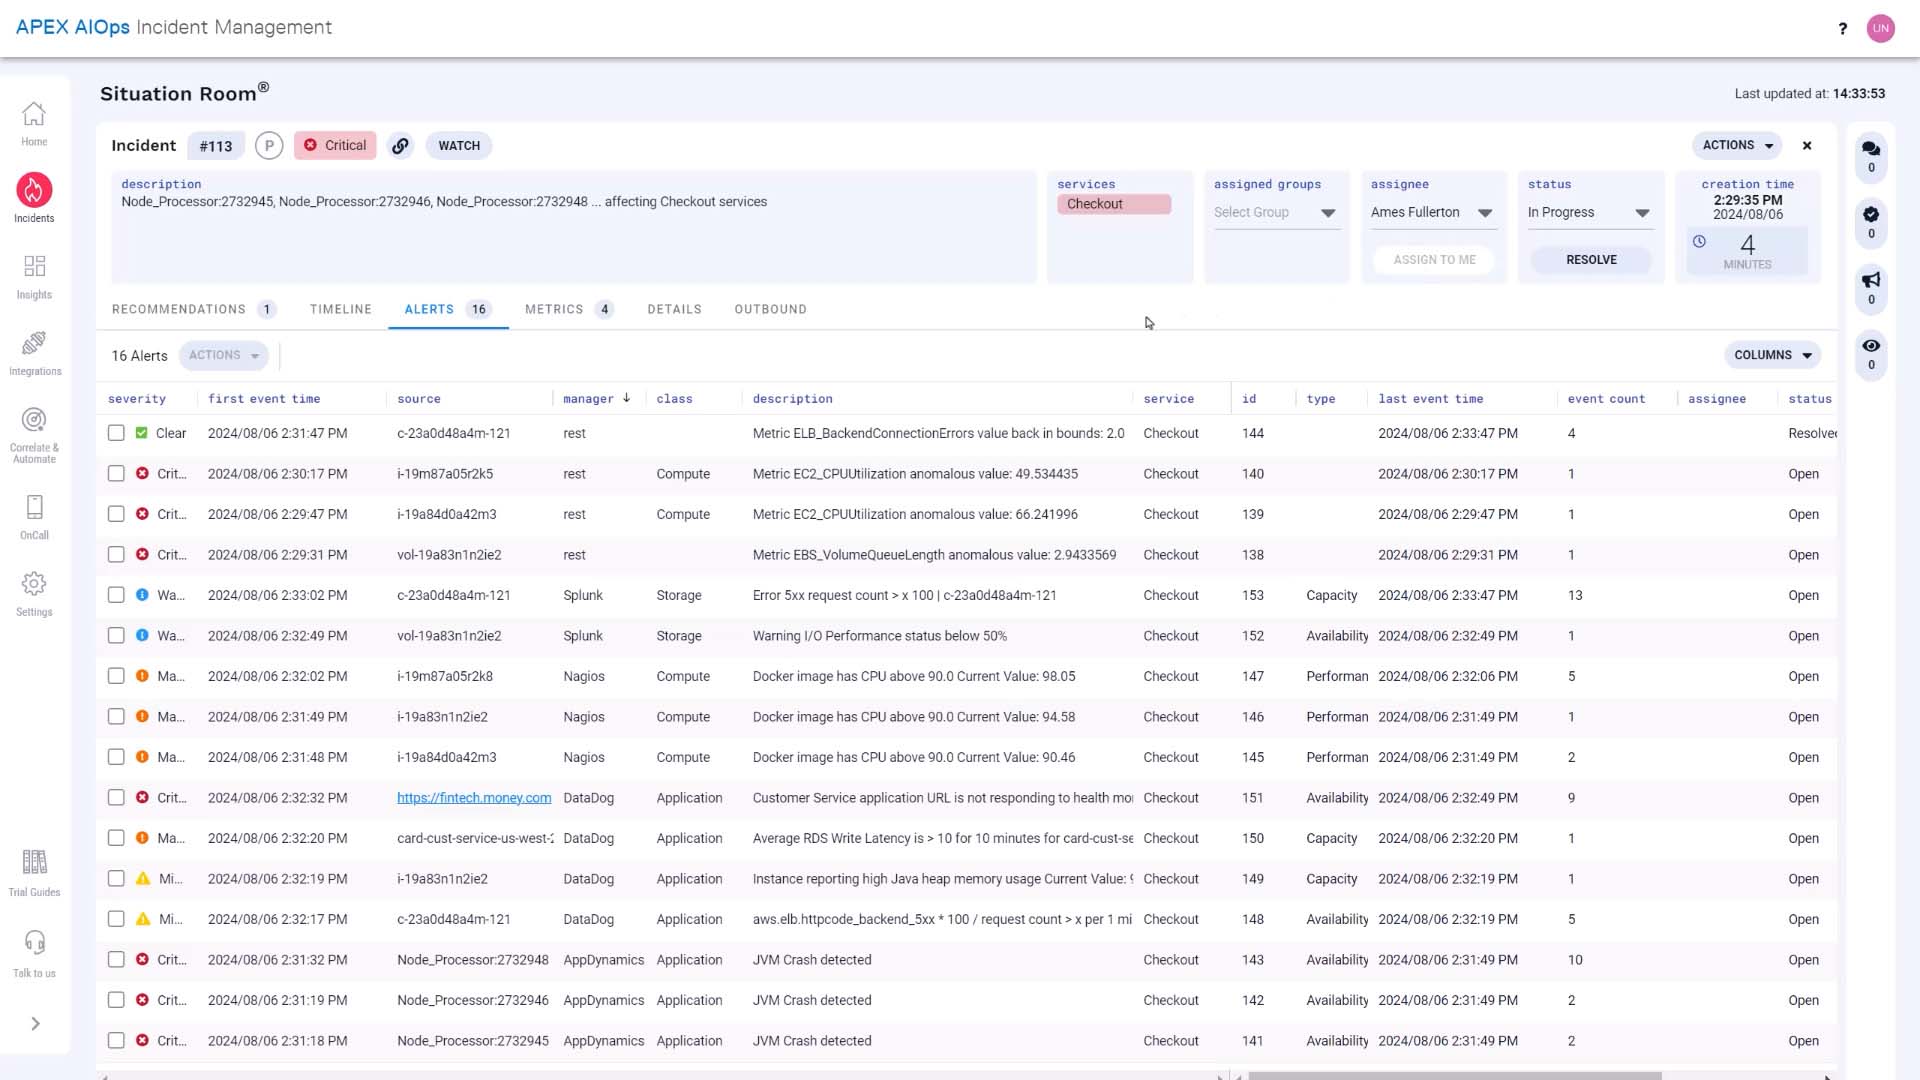
Now we will start our investigation.
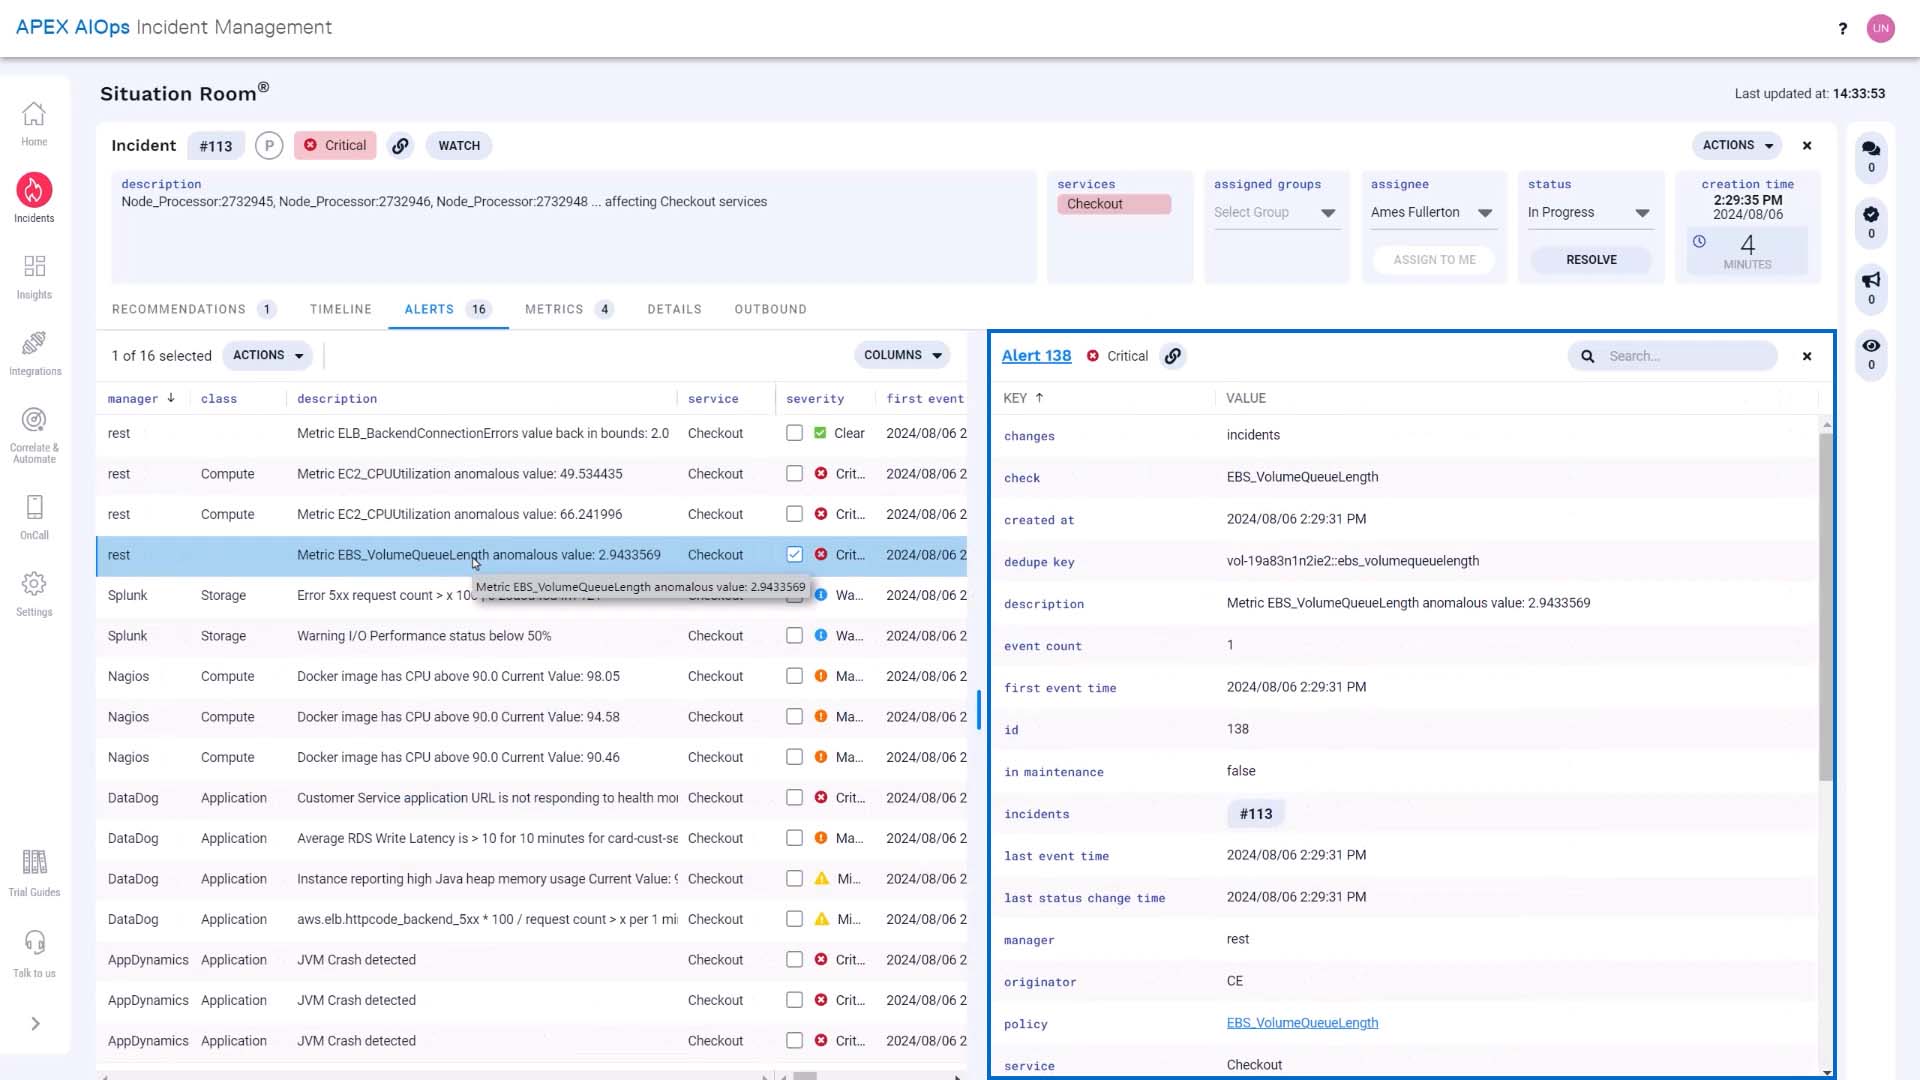
These alerts came in within a few seconds of each other. Let’s look at the details of the alert that first came in.
All attributes of this alert are visible now.
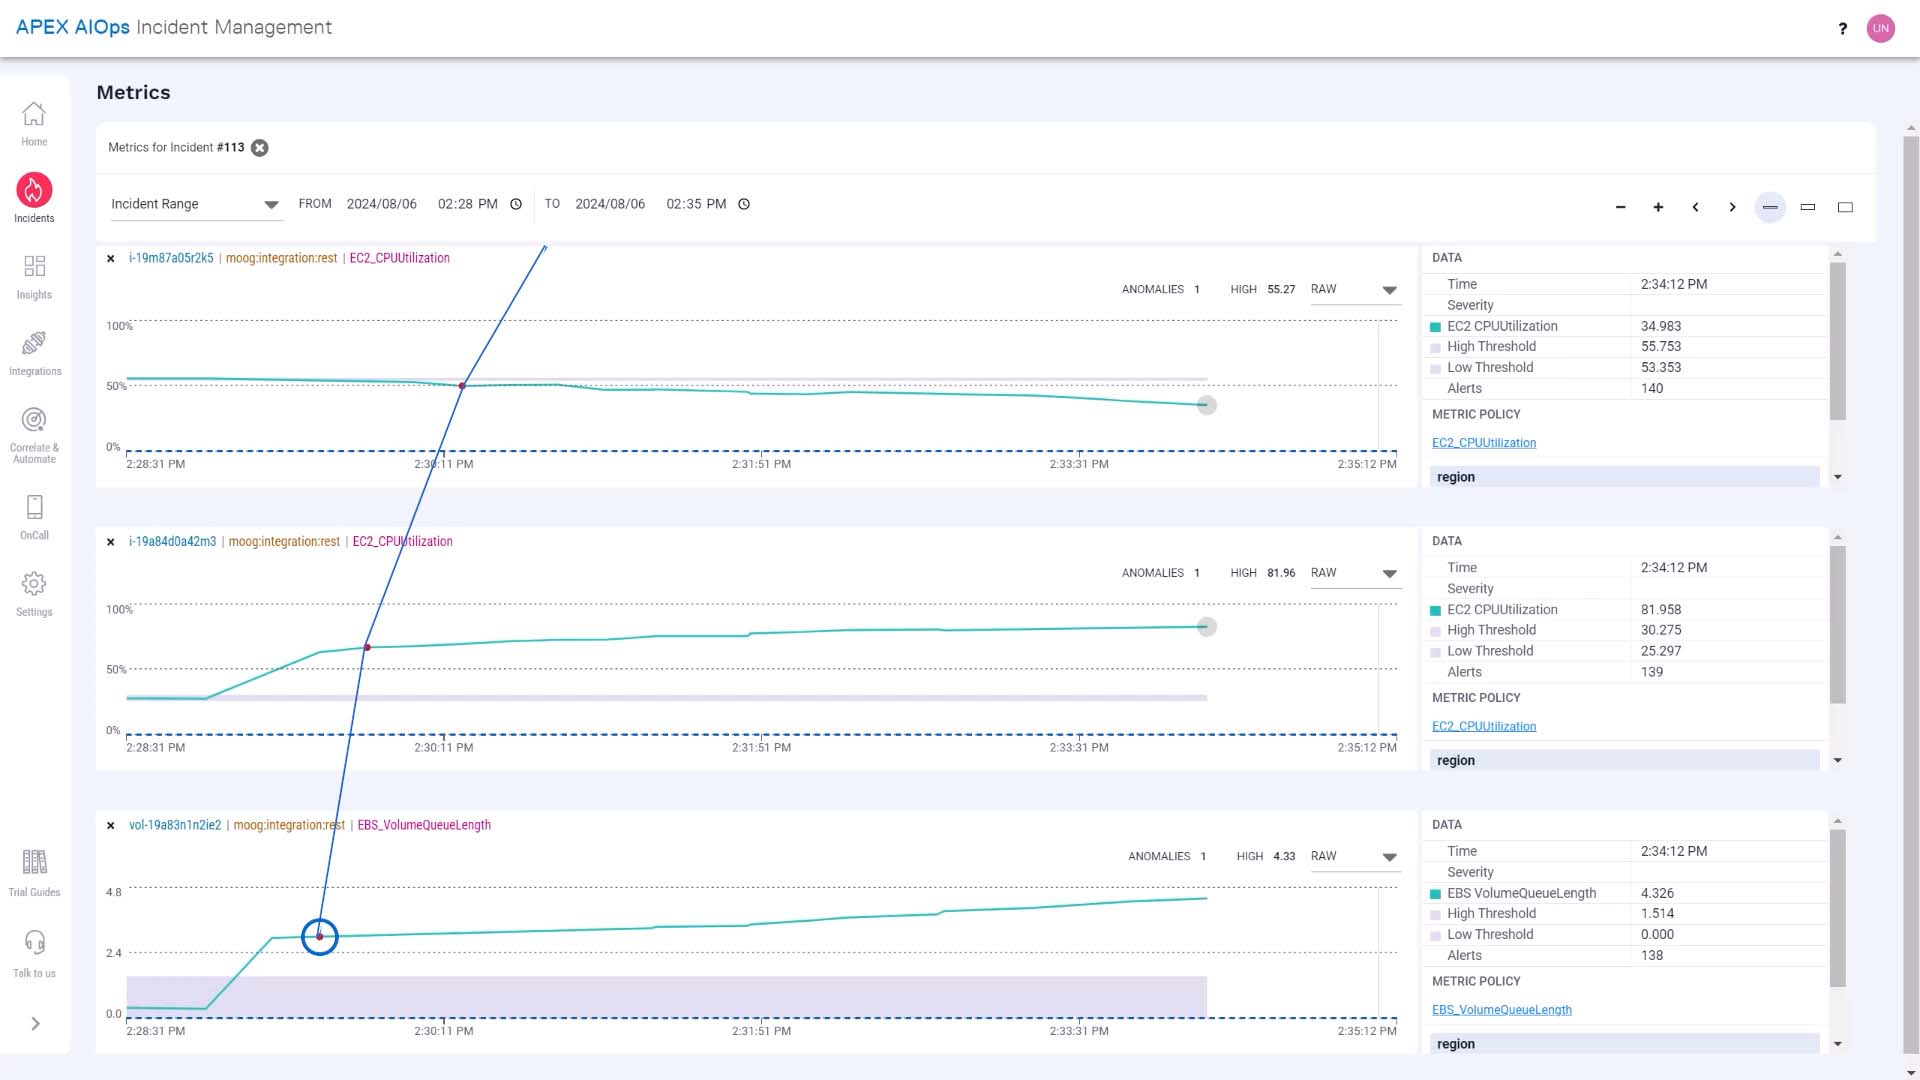
And the metric information of the alert is visually presented here.
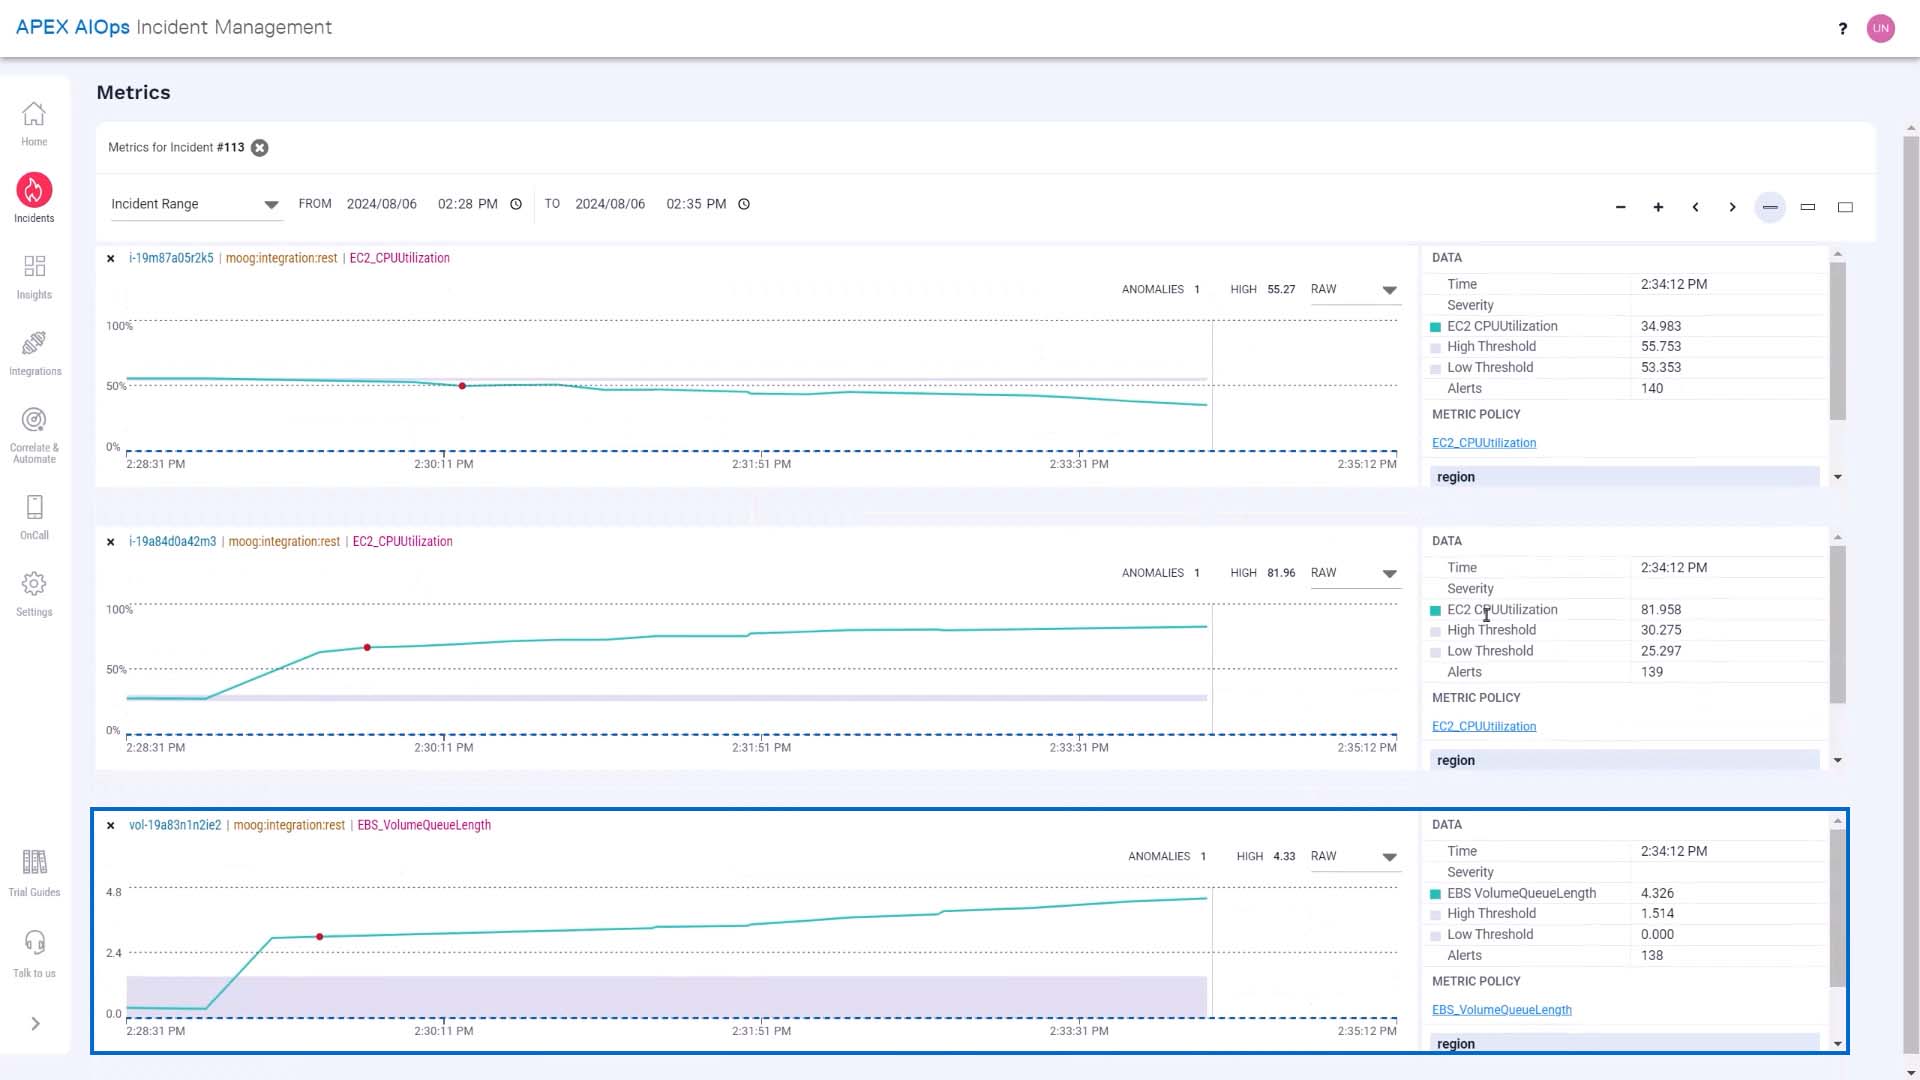
Incident Management shows you the relevant context and their relationship to each other. This way, it’s much easier to grasp how the whole incident unfolded over time.
According to this, the volume queue length metric exceeded the threshold level and triggered a warning alert.
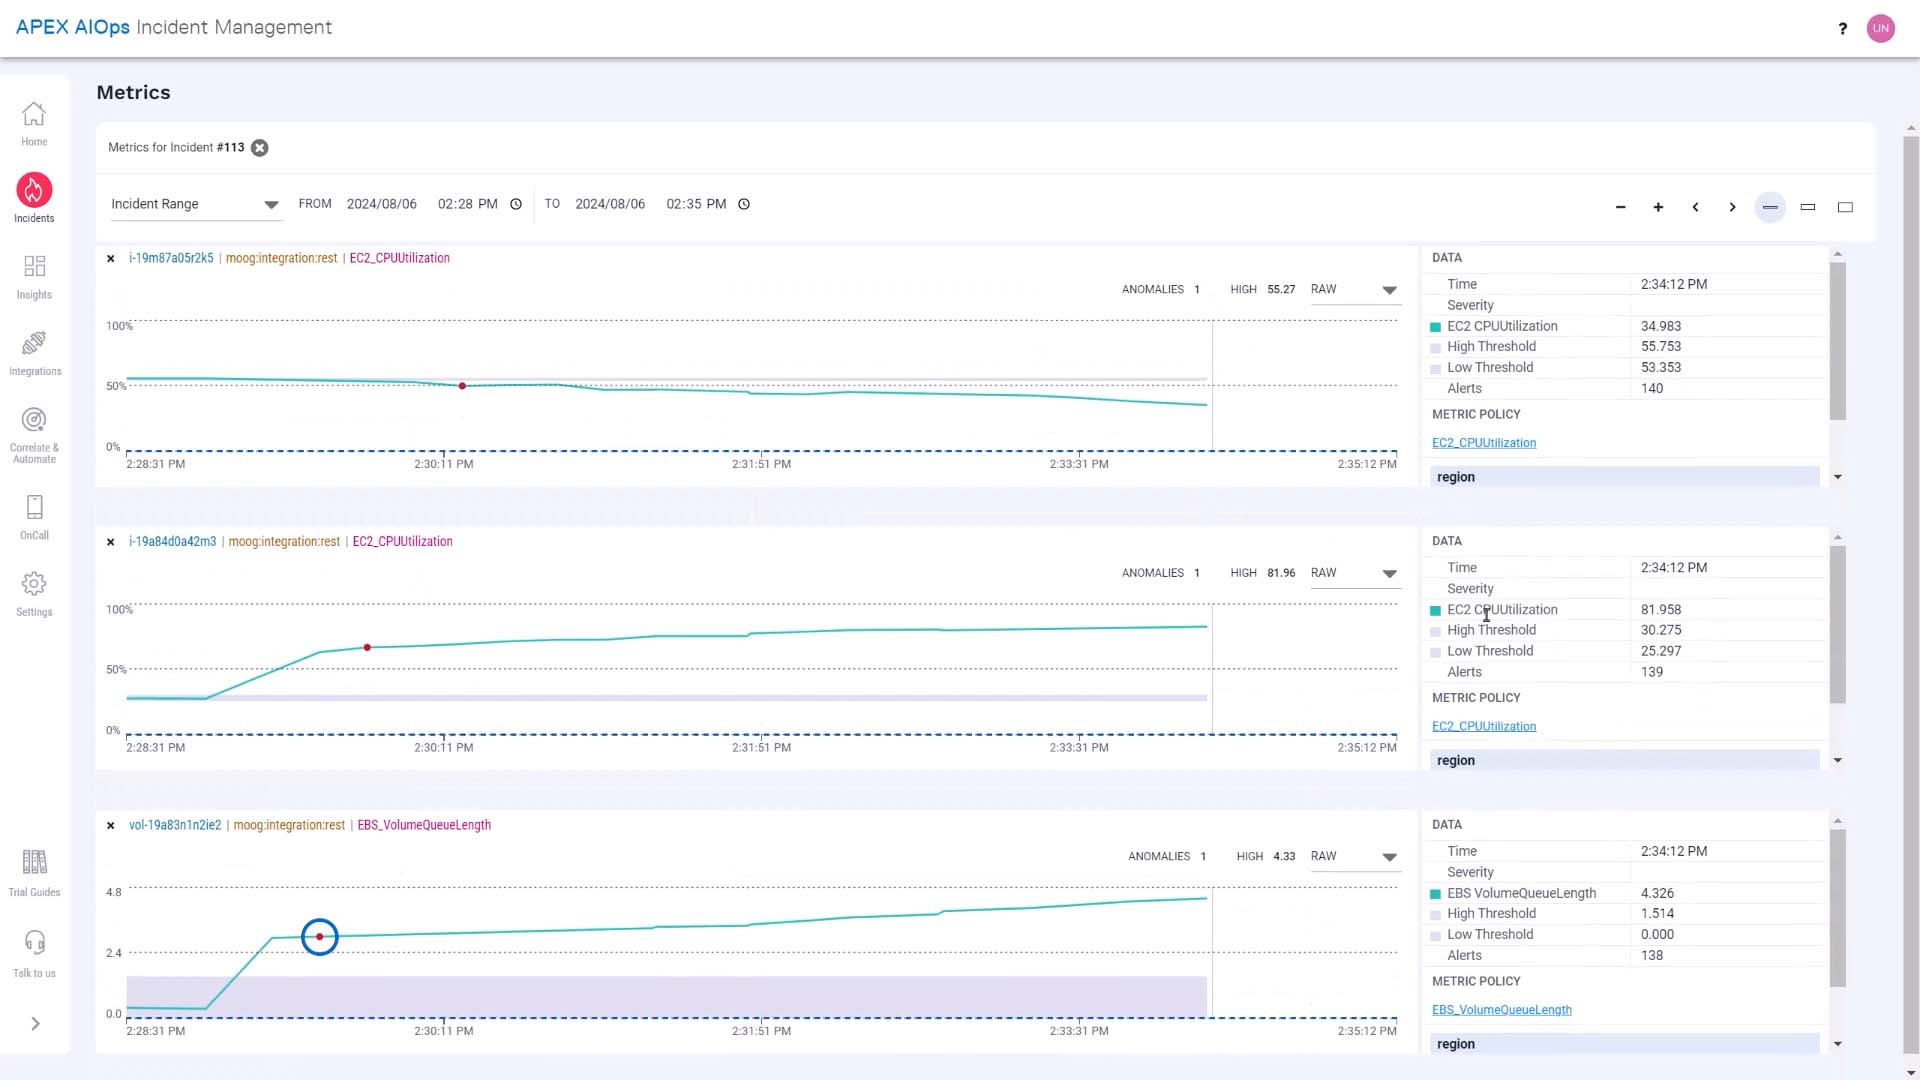
Then the CPU usage metric on our front end server increased and triggered a warning alert...
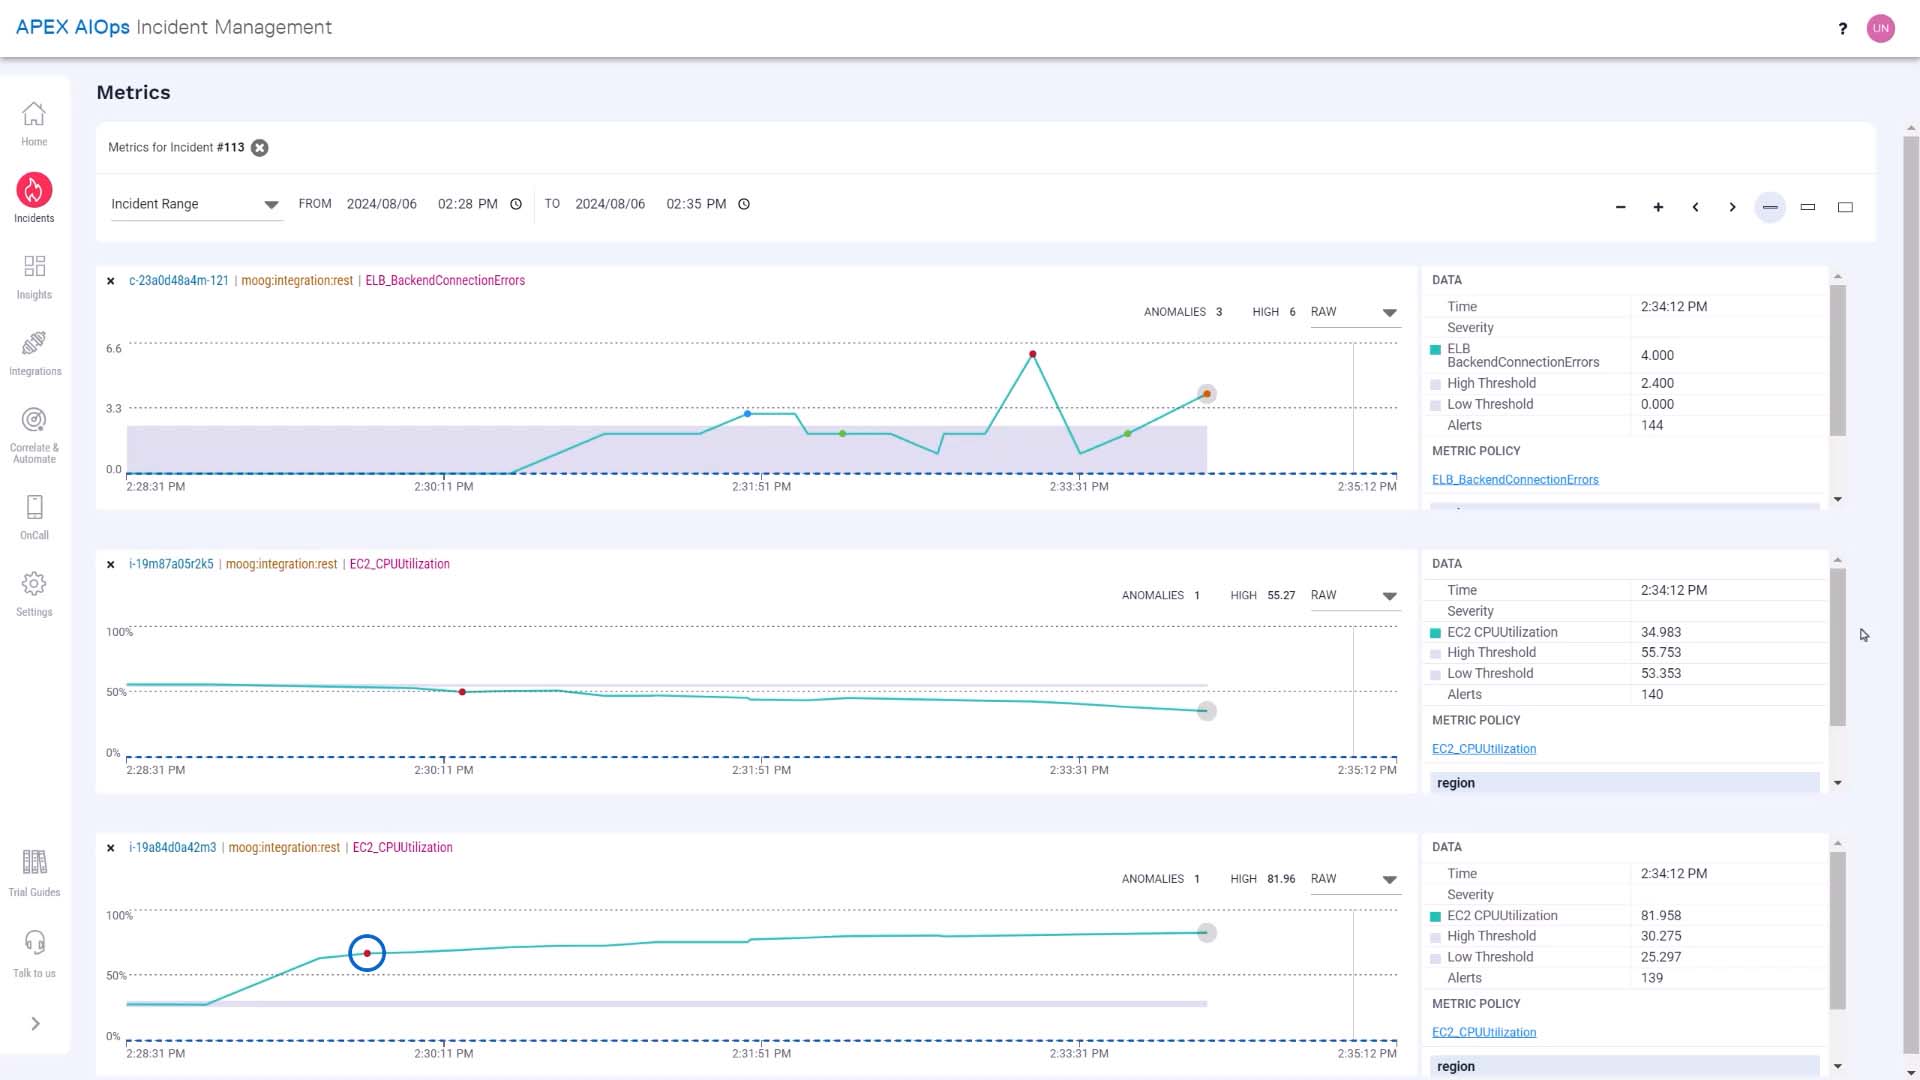
...the activity on the backend server fell...
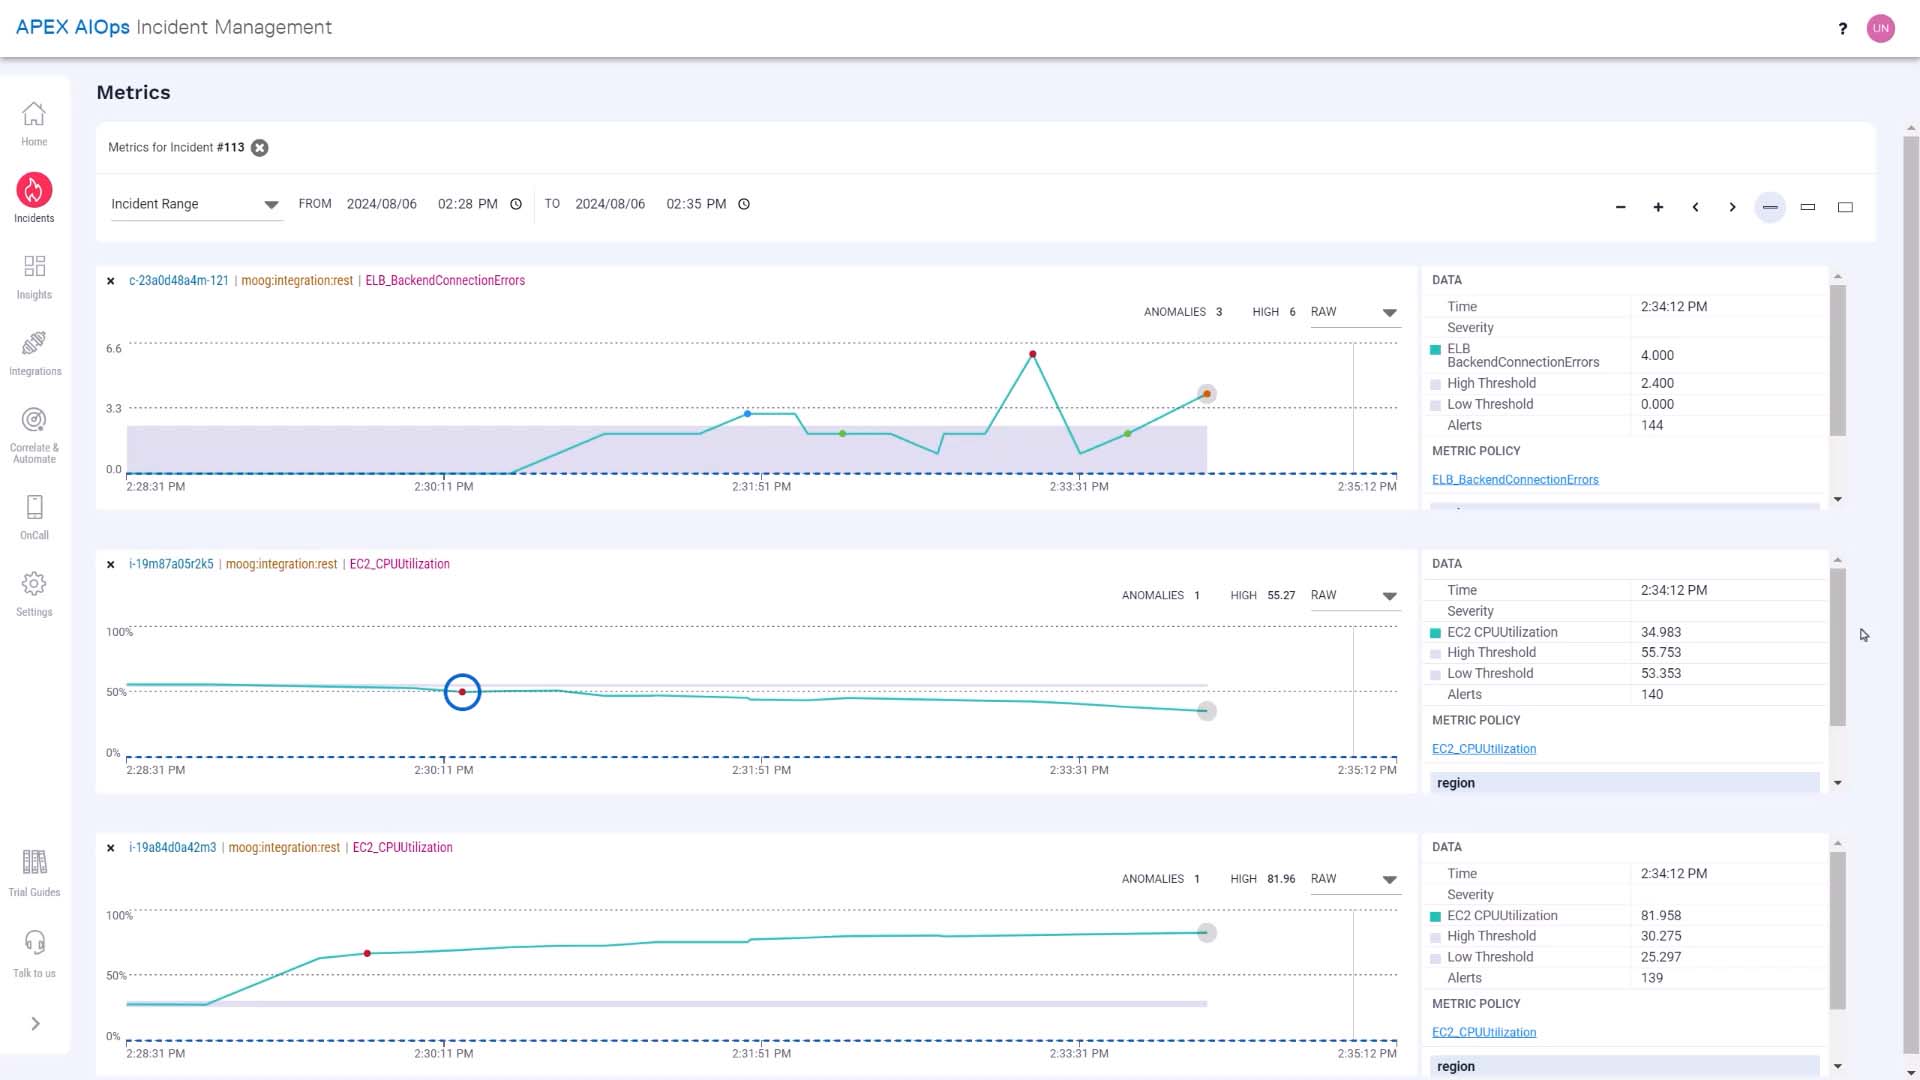
...and we are seeing a backend connection error critical alert.
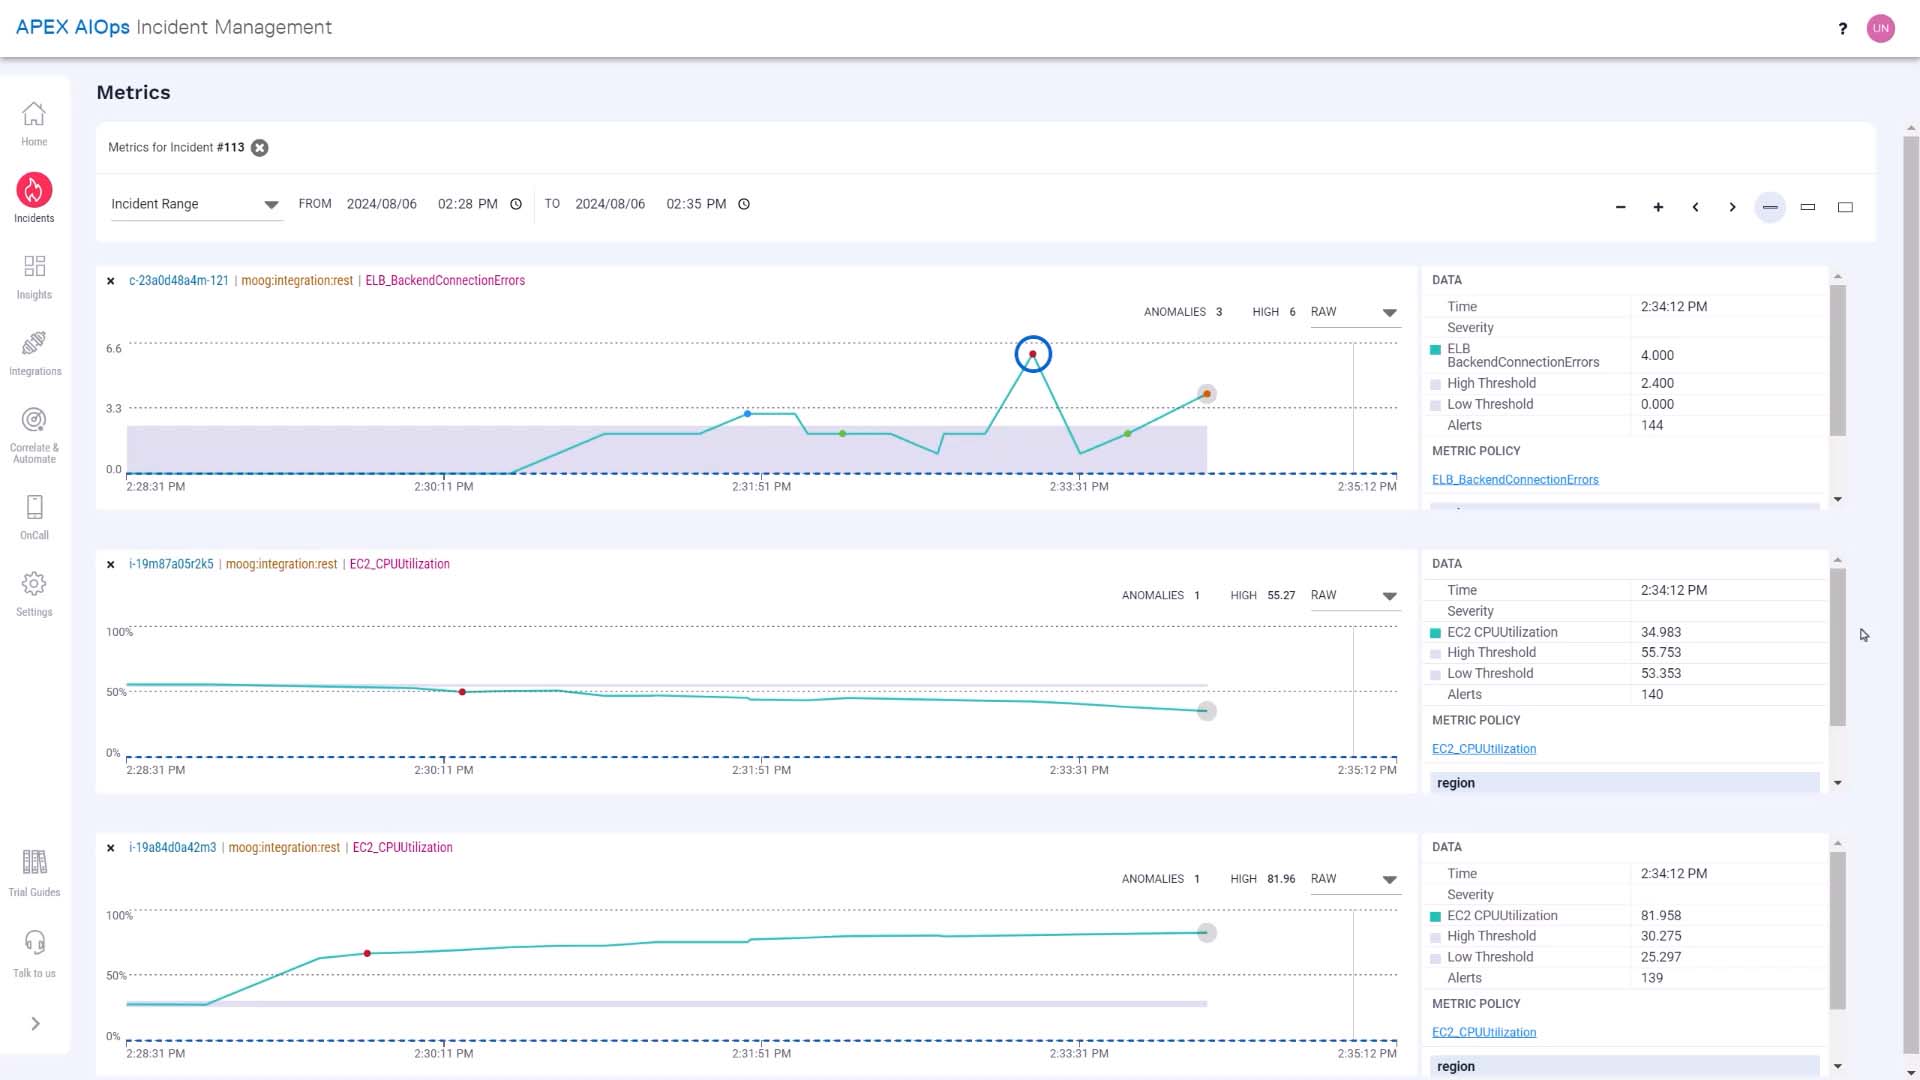
So, could this be the root cause that had a cascading effect to cause other alerts?
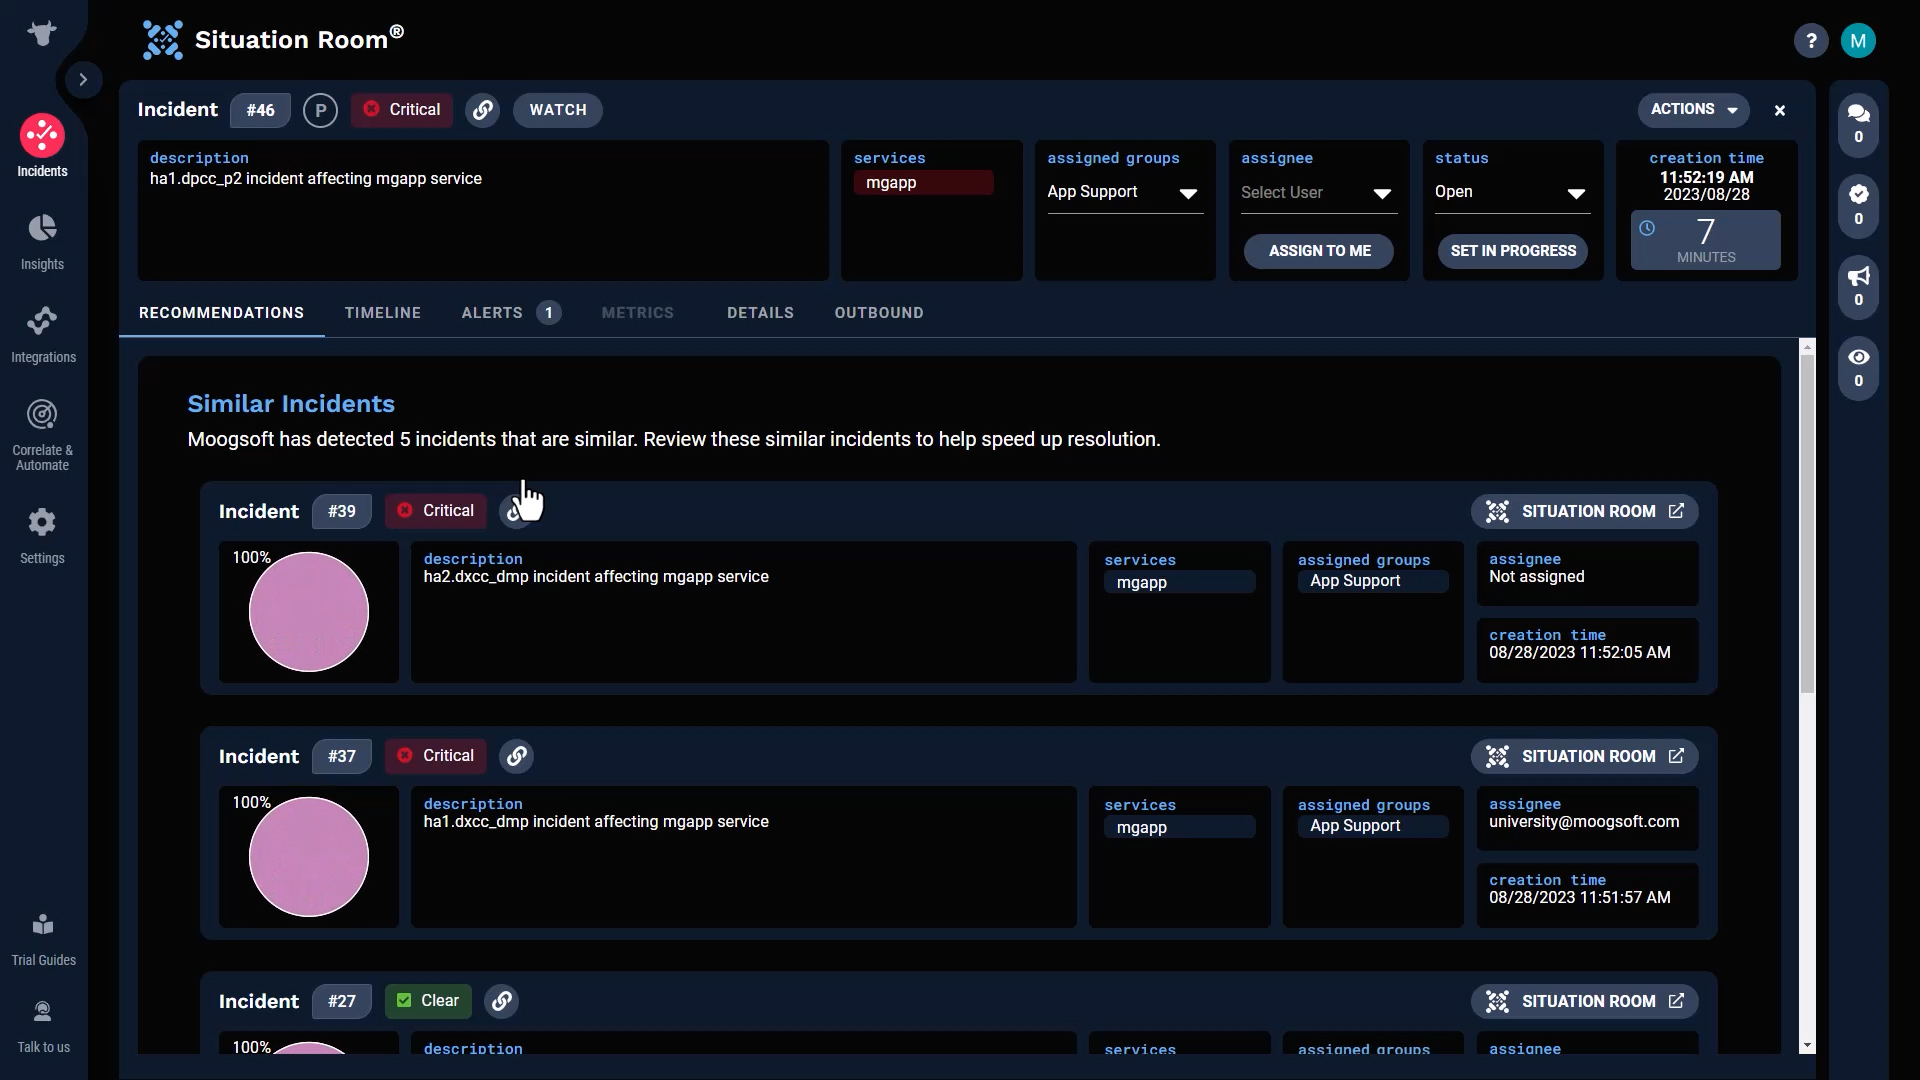
Let’s check out the recommendations tab in the Situation Room for additional insight. Any similar incidents from the past will be surfaced here.
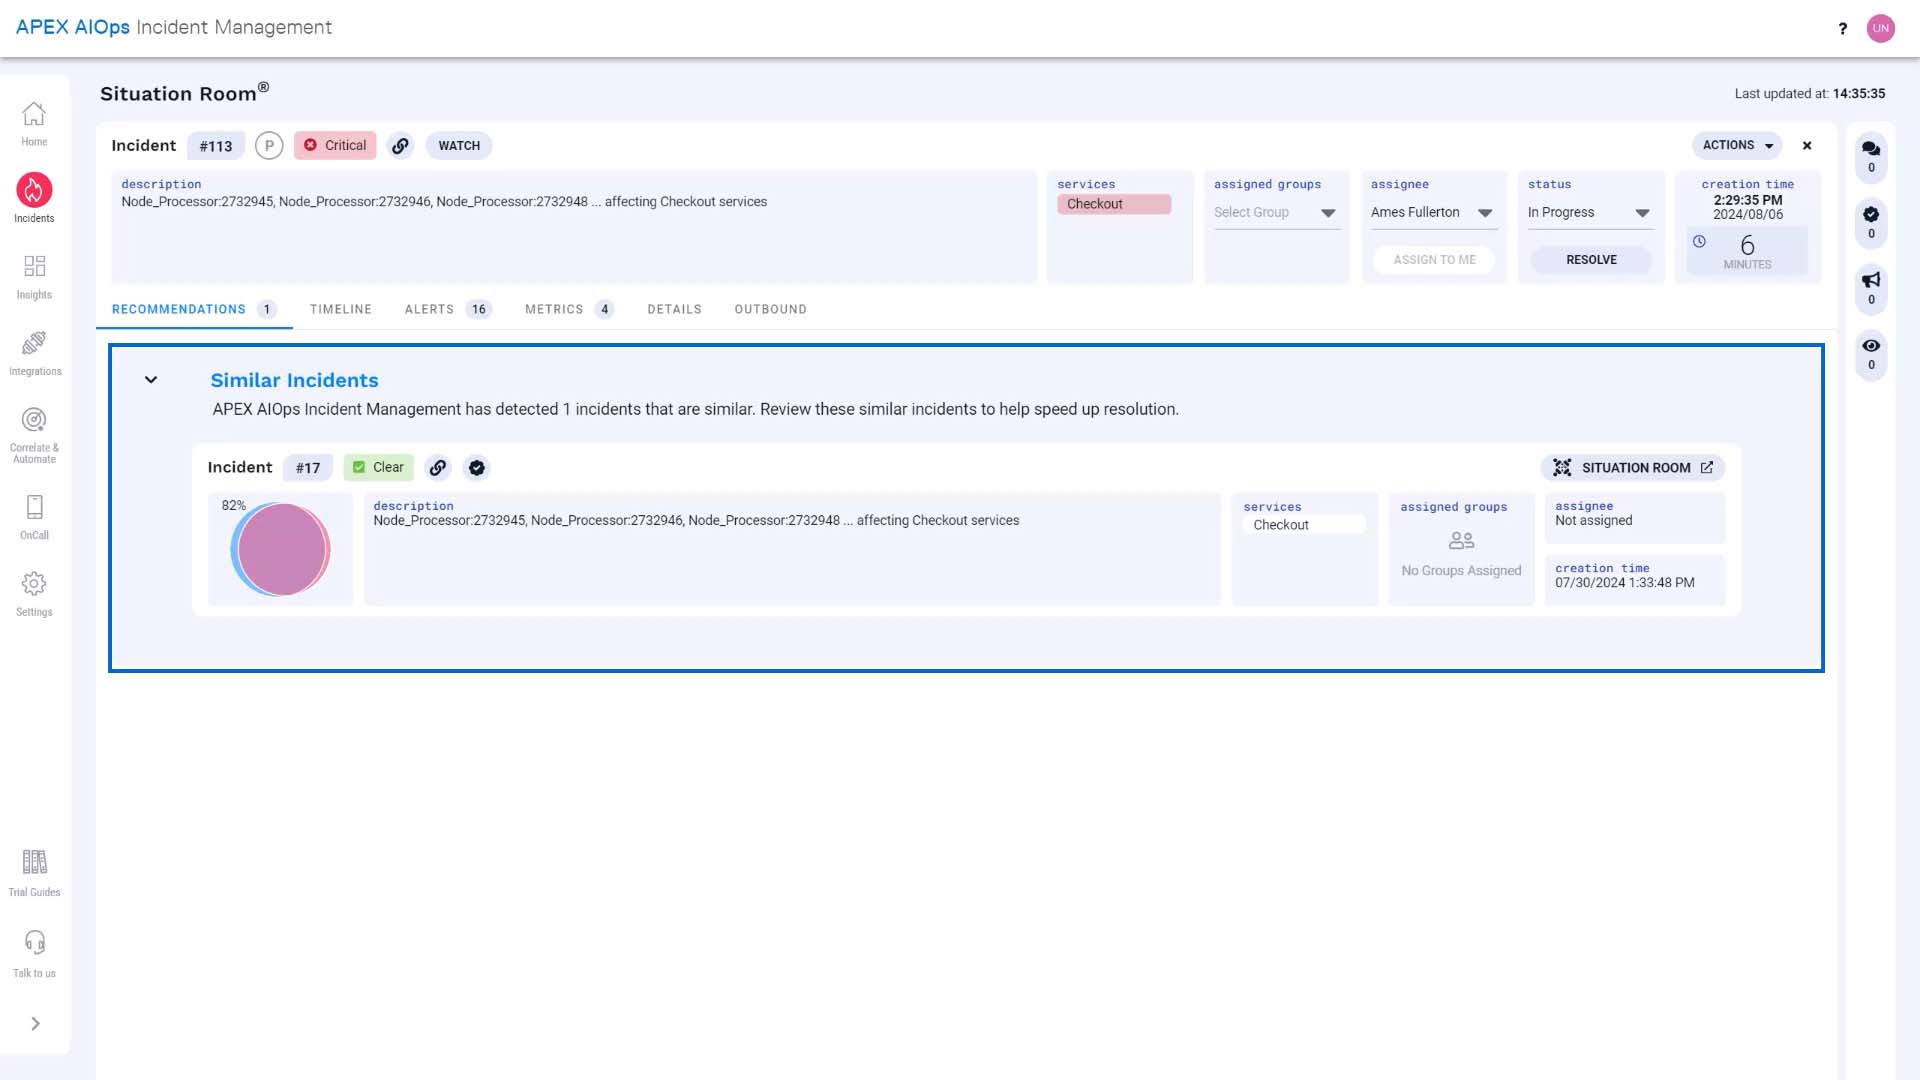
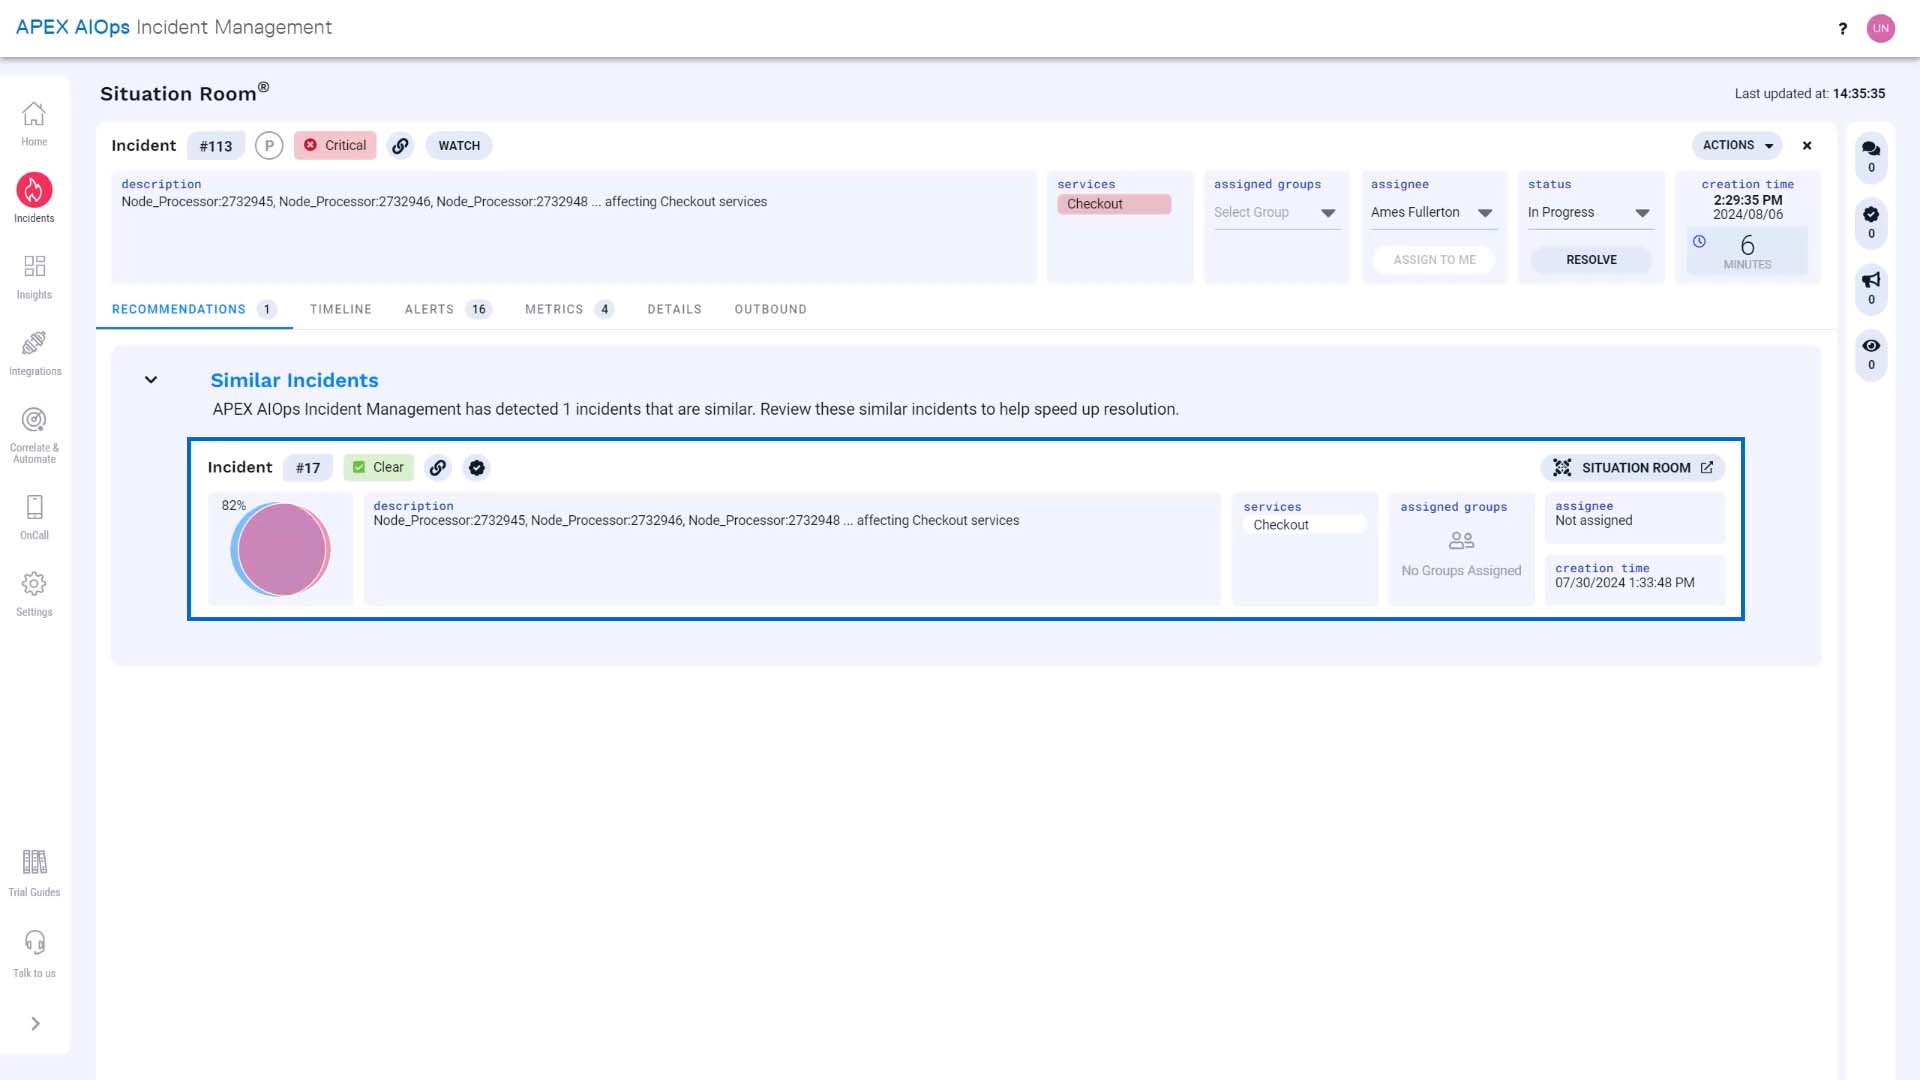
Here's an incident that is 82% similar.
And this icon means it has a resolving step we can review. Great!
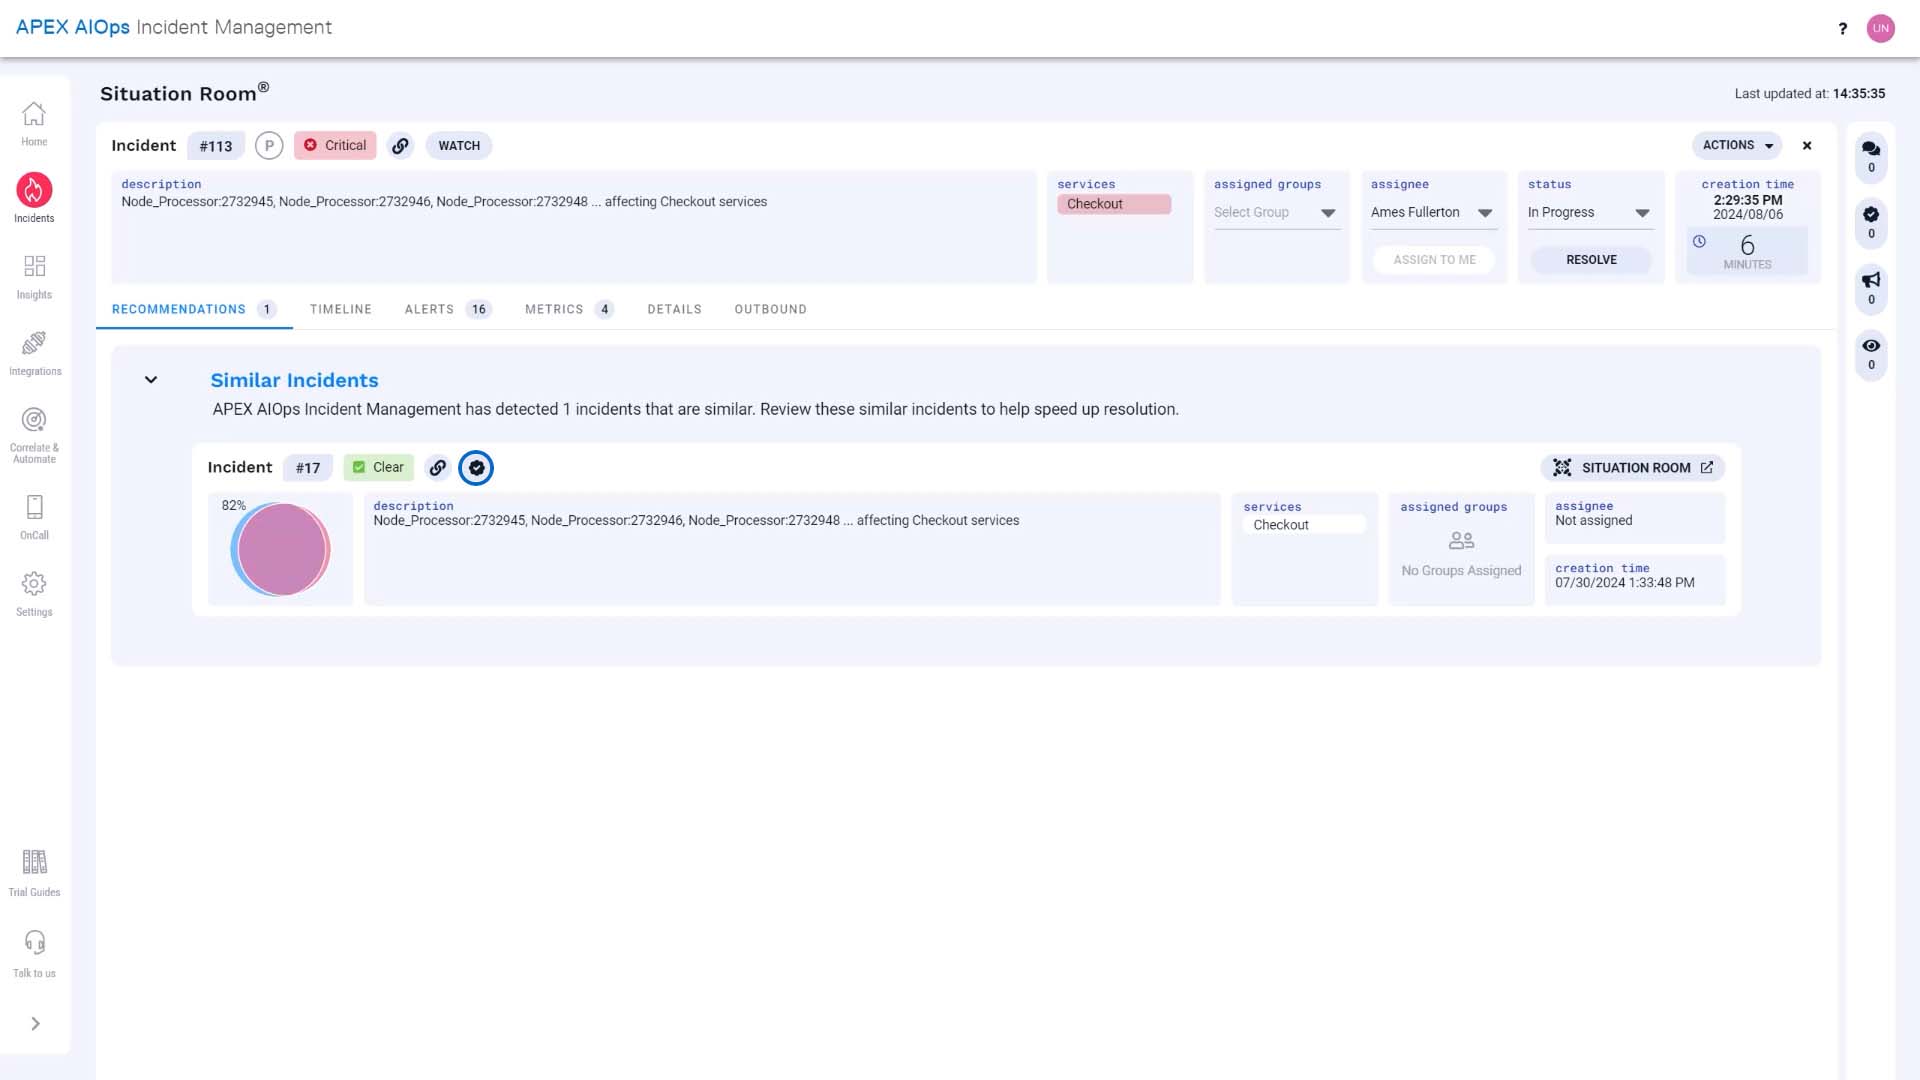
This indicates the similar incident was resolved using a runbook tool.
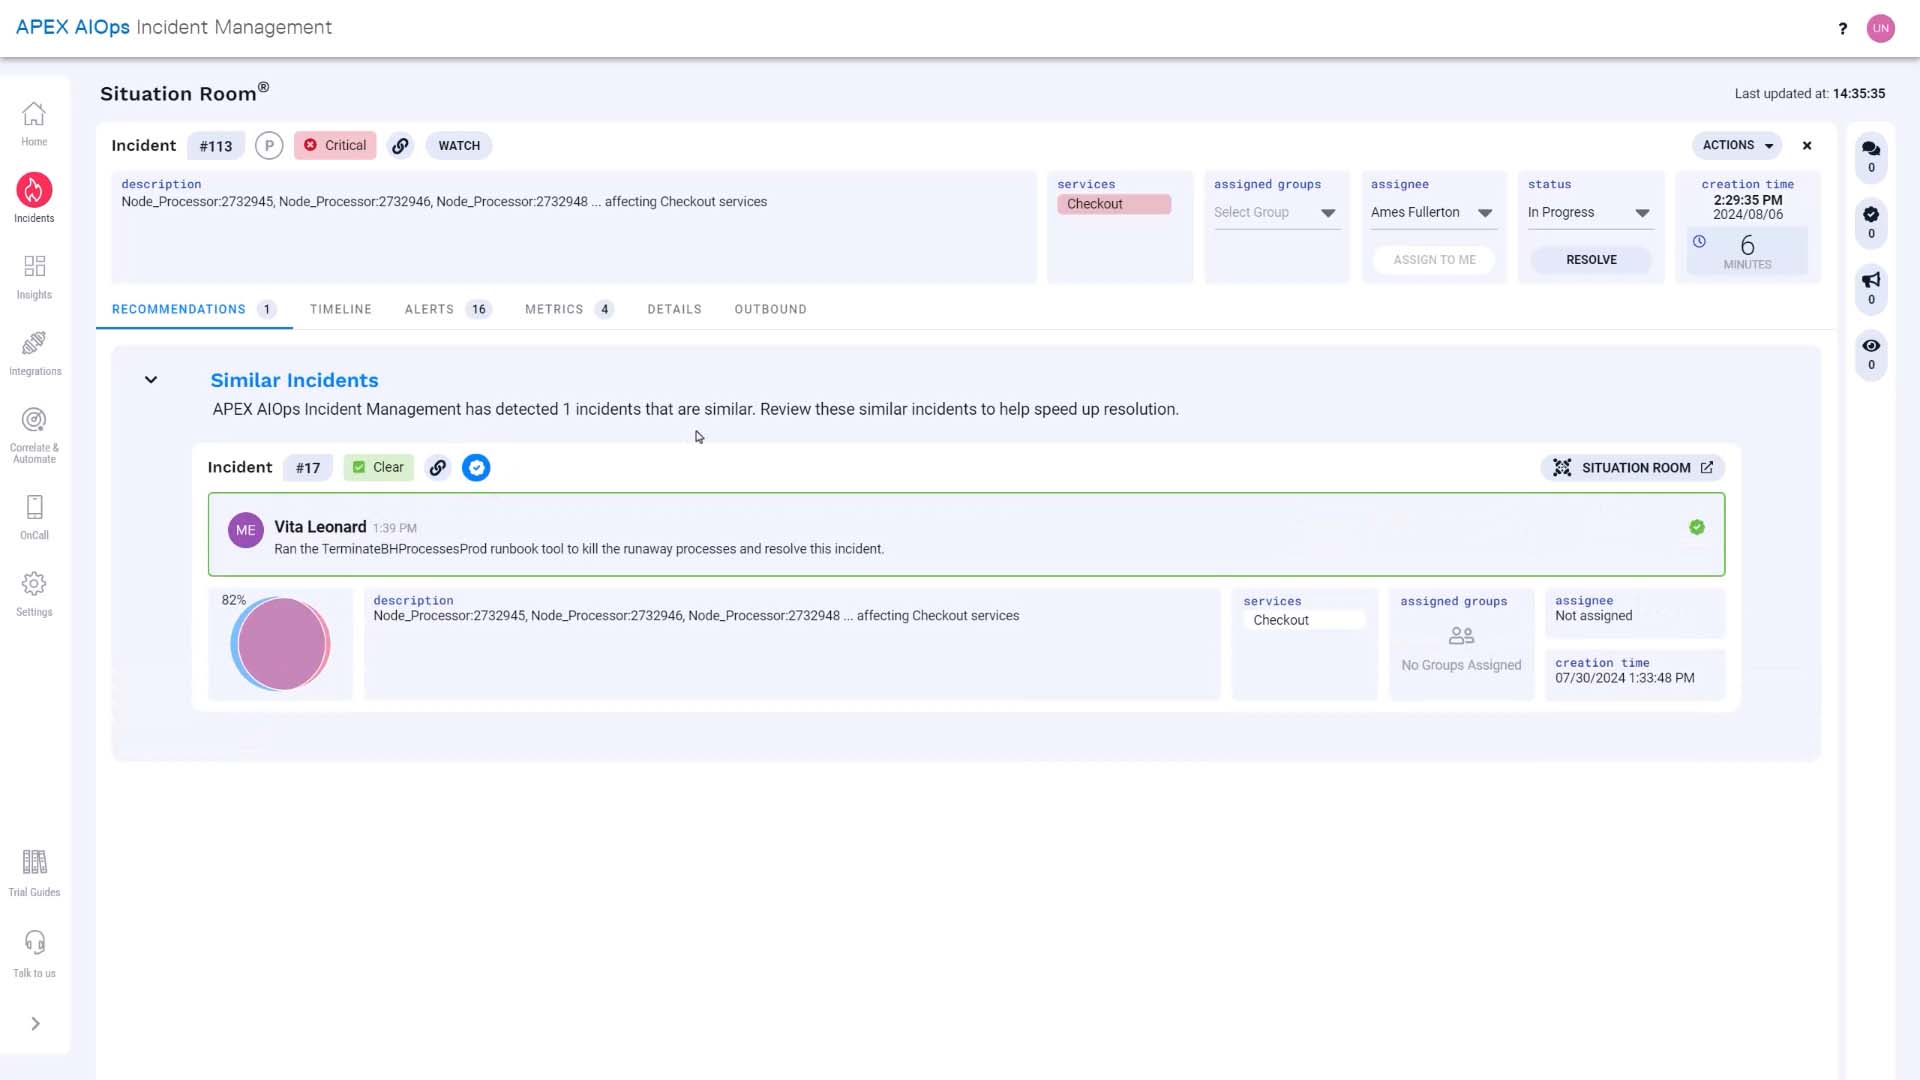
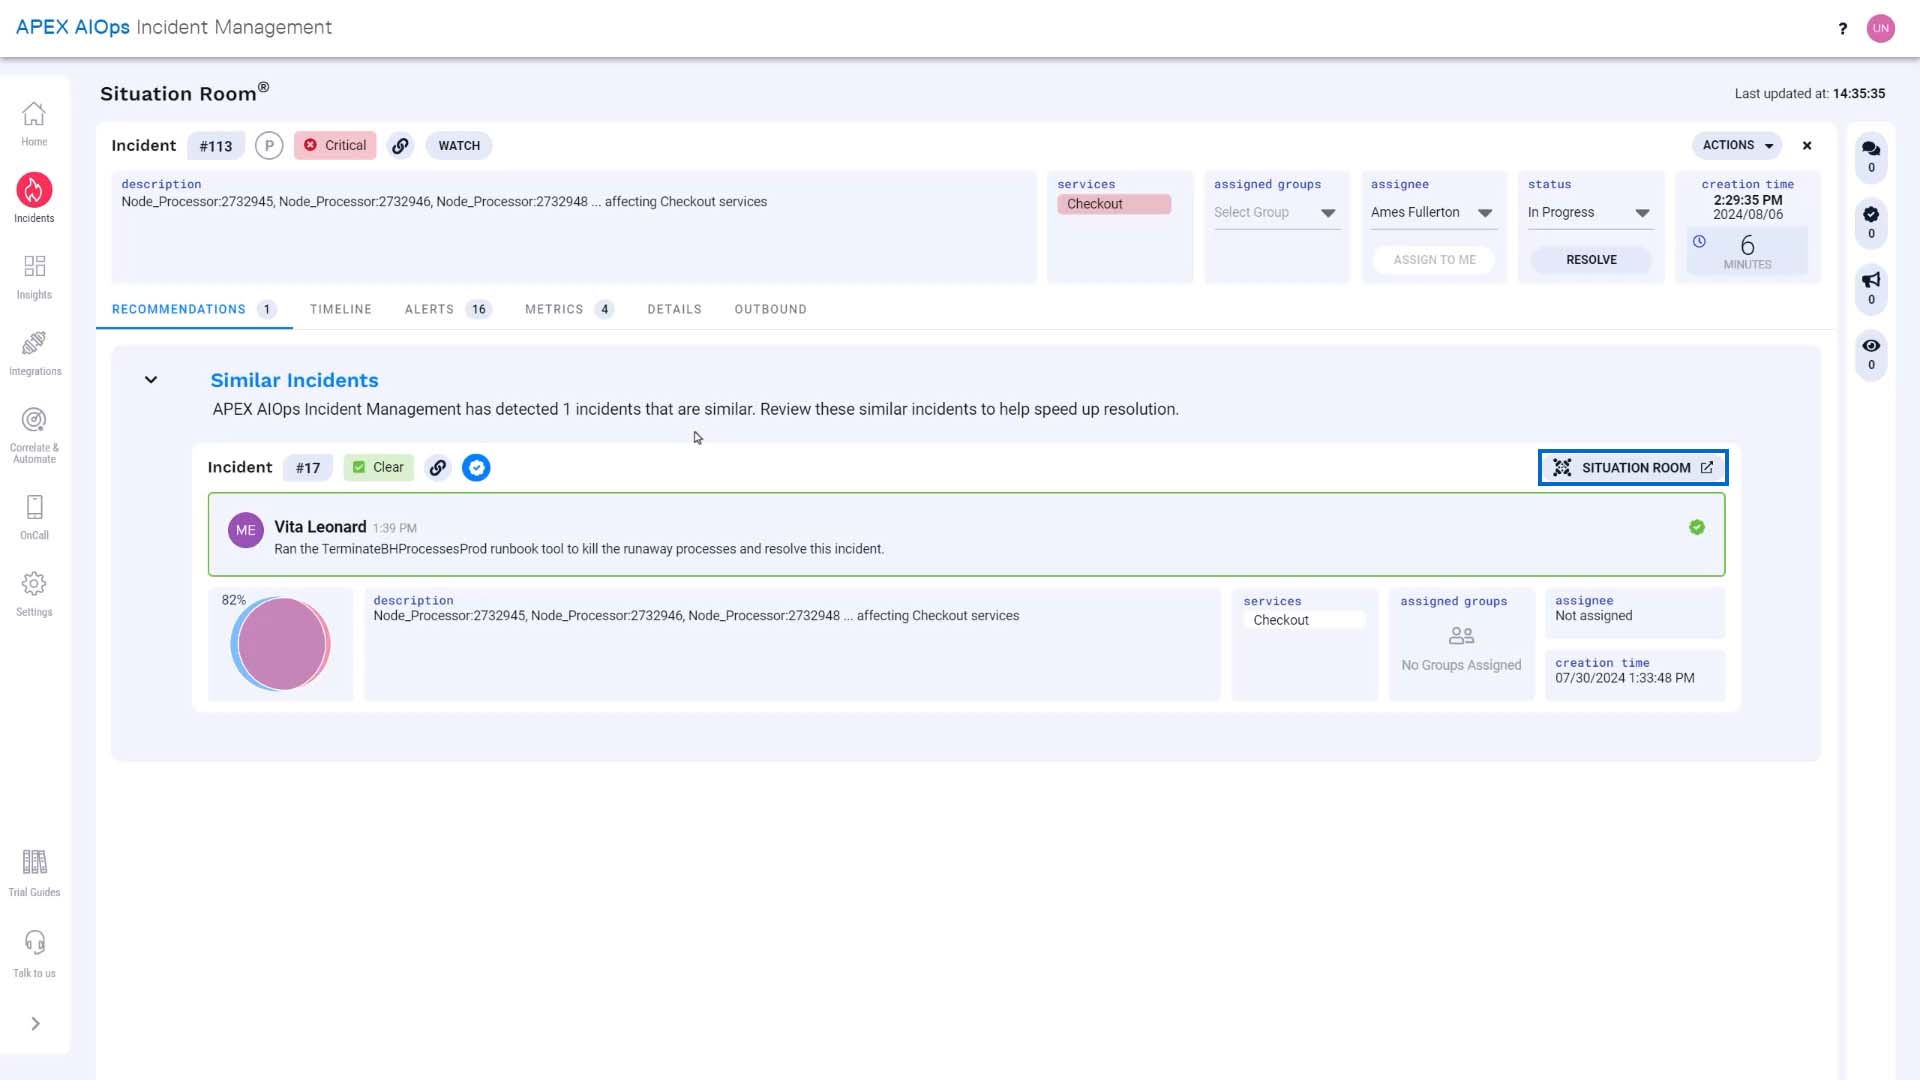
Let’s go to this incident to get more context and confirm we can resolve our incident the same way.
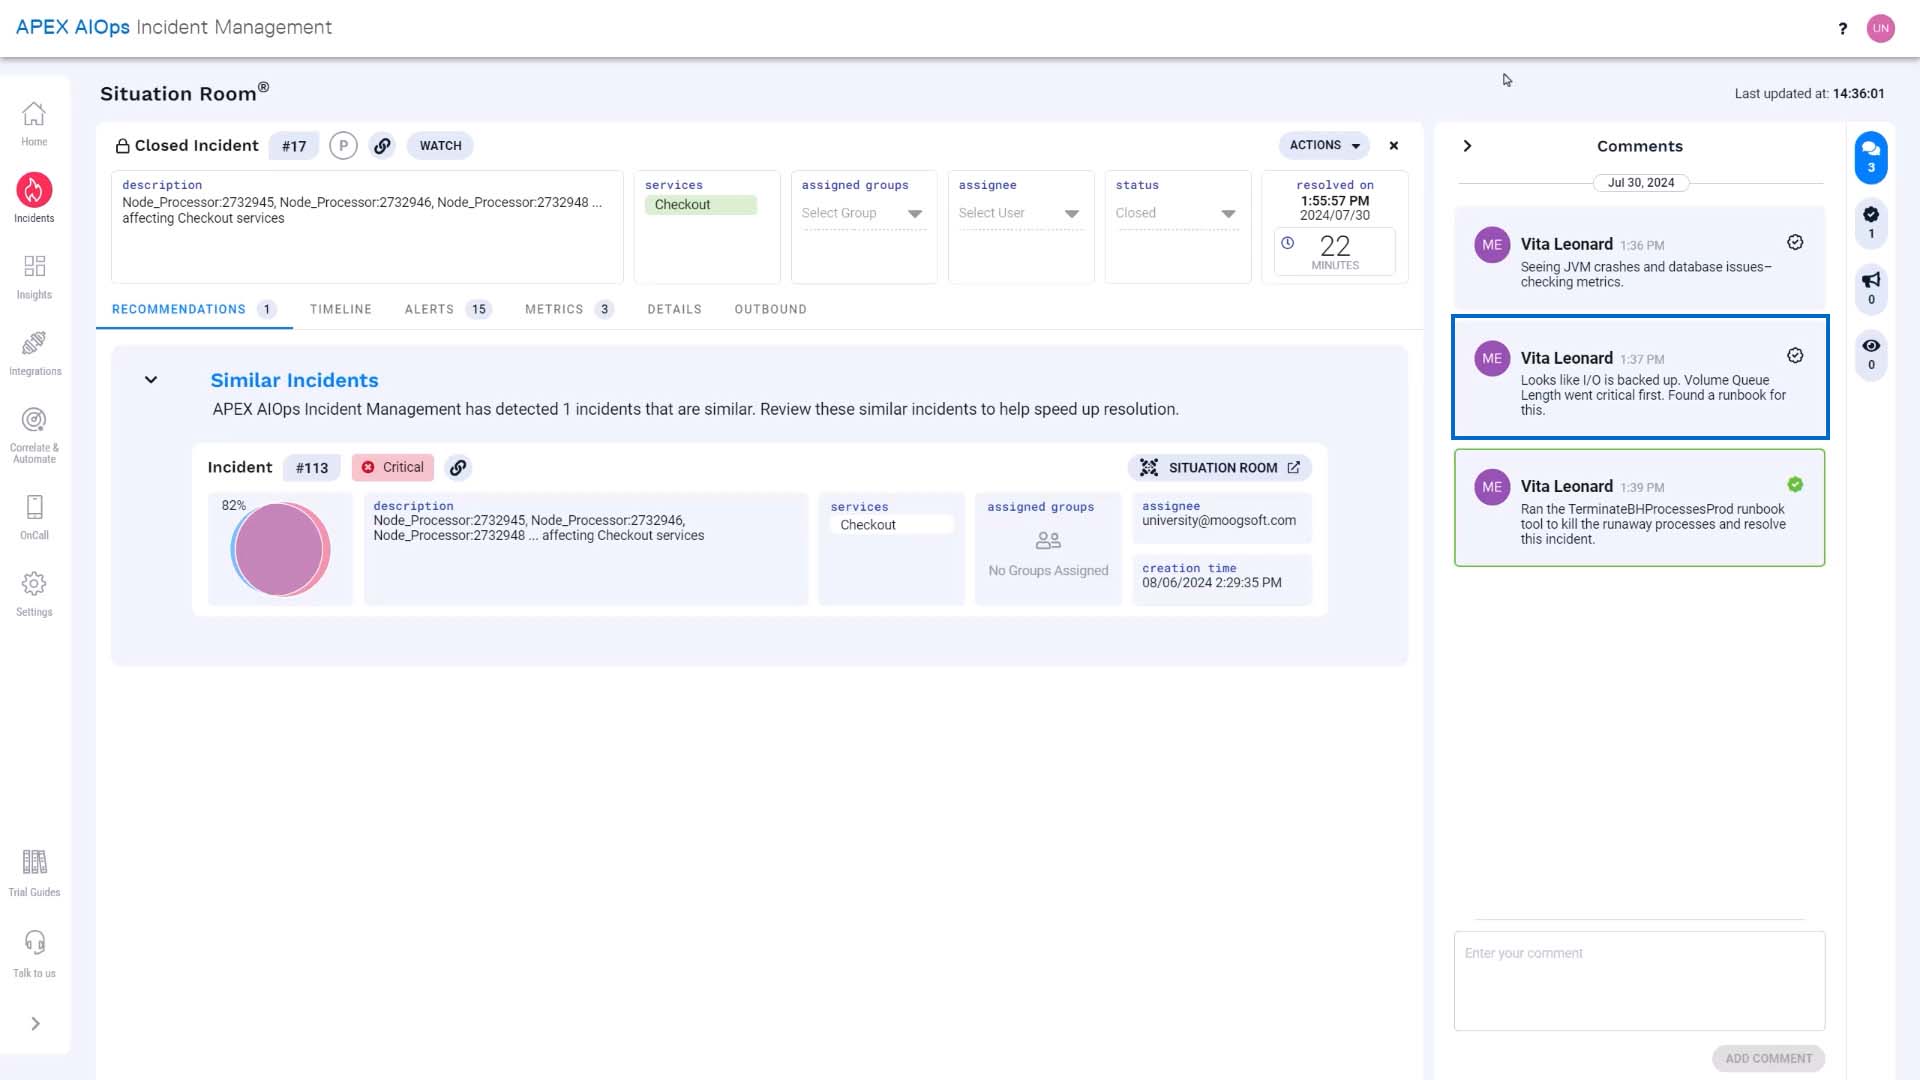
Let’s look at the comments. This incident involved a disk I/O bottleneck that showed up as an increase in Volume Queue Length. Just like our incident.
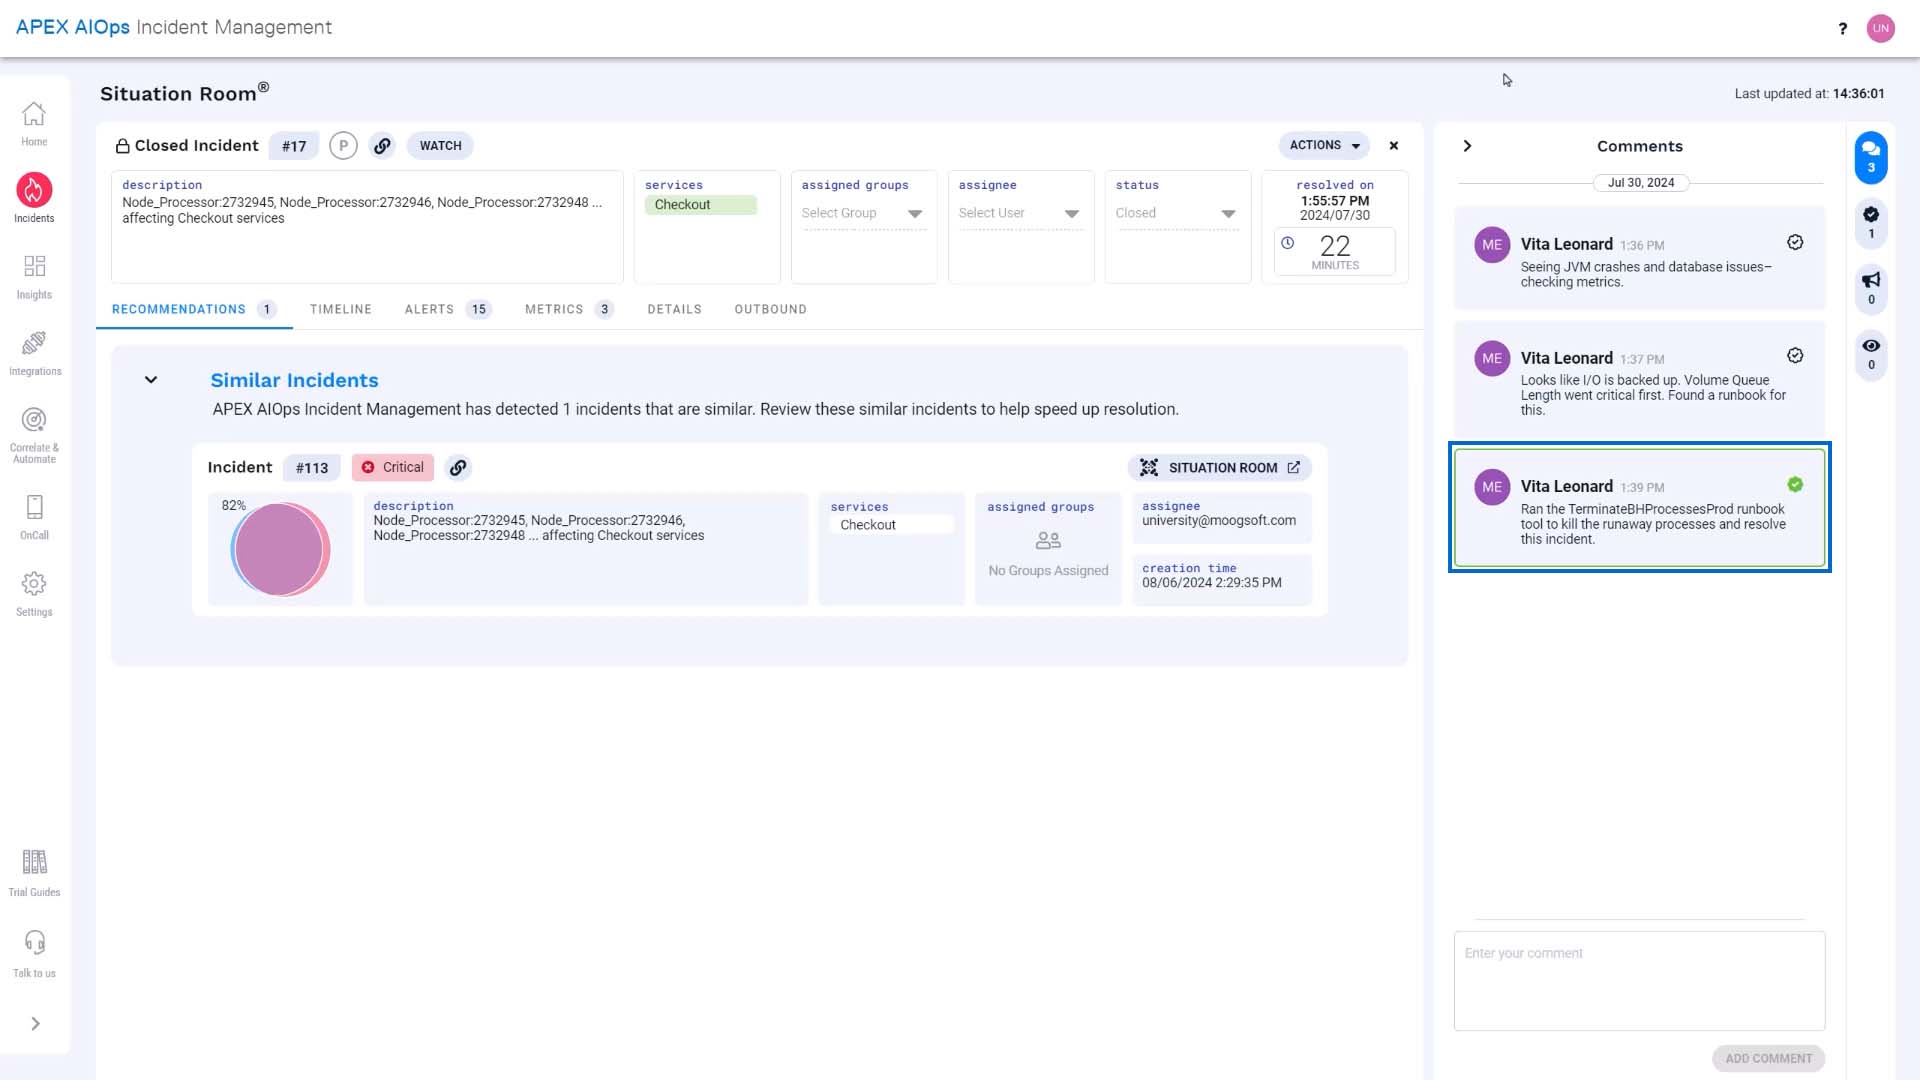
We can use the same runbook tool to terminate runaway processes and free up resources.
Let’s go back to our incident.
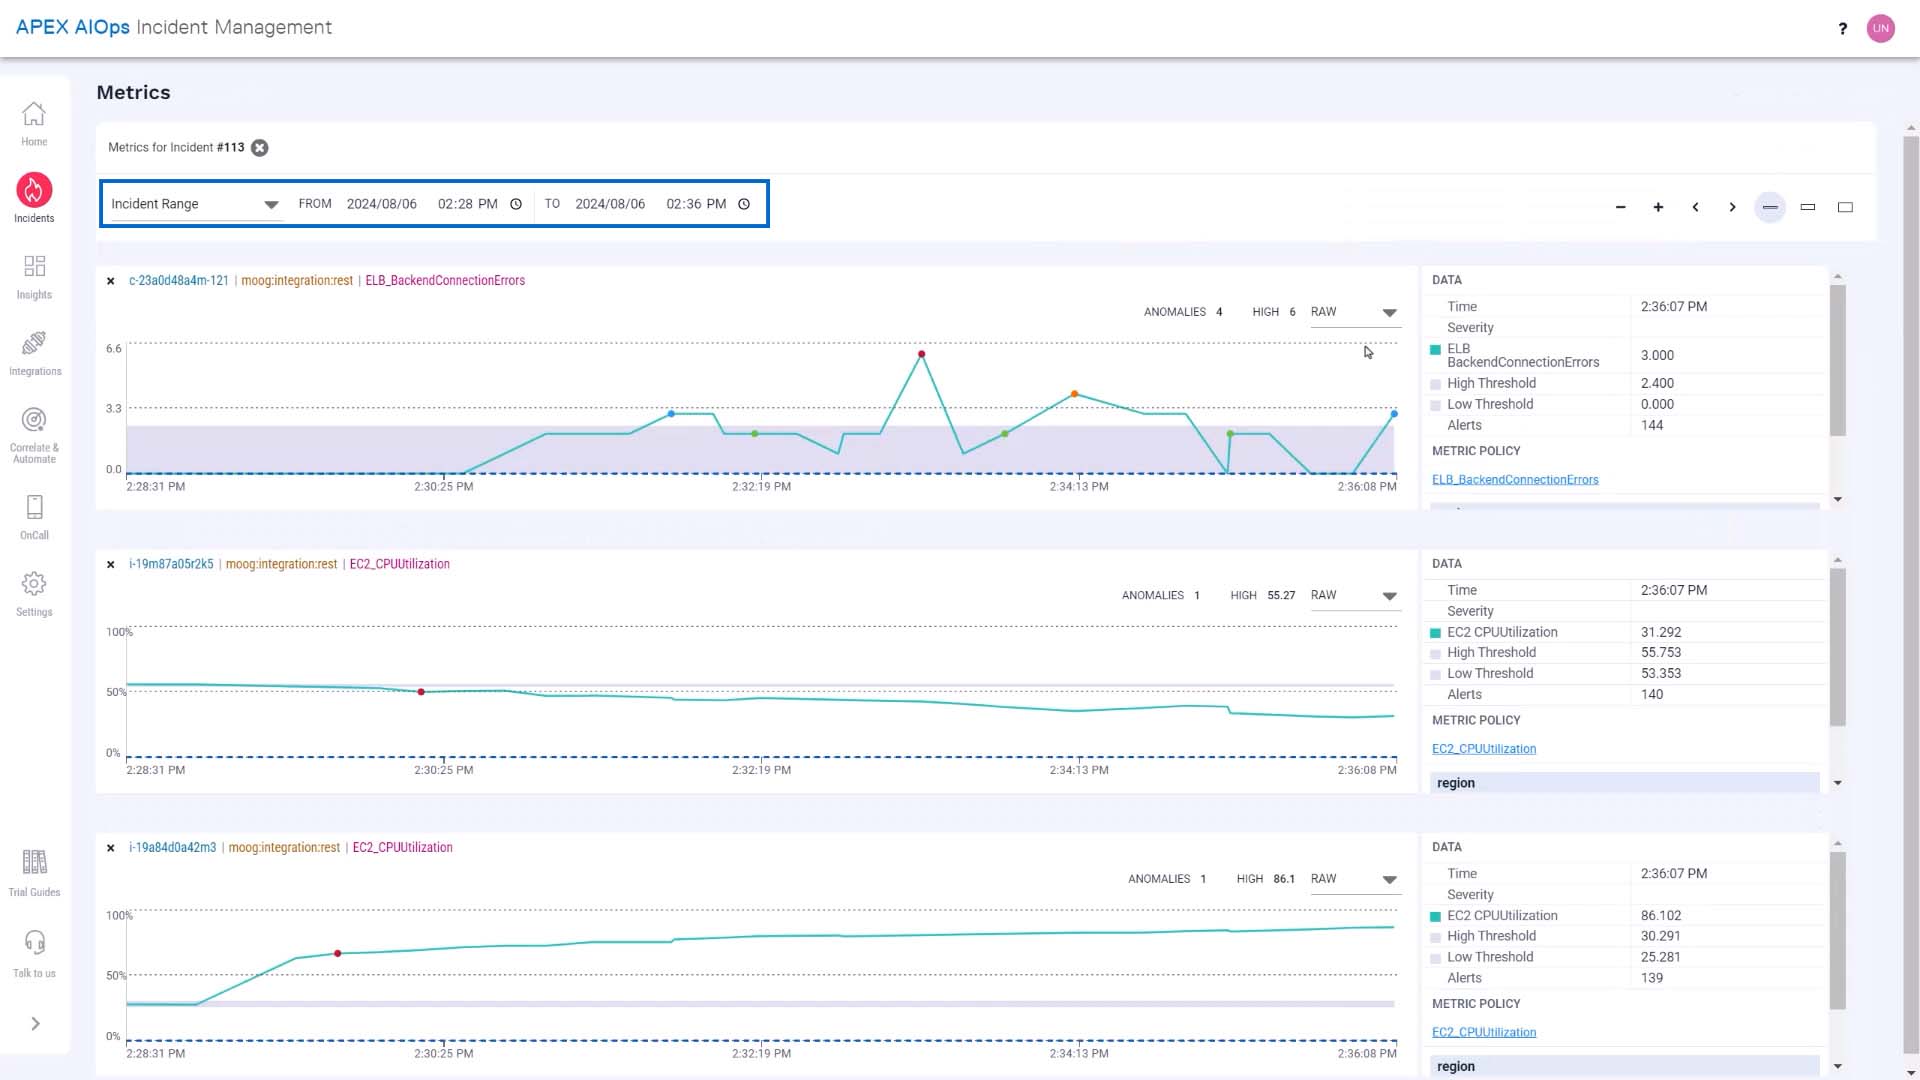
Currently the time window we are seeing is from the moment when the first alert in the incident occurred. We want to see what happens to the metrics when we run the tool. So let’s change the time frame. Now, the metrics are going to be updated in real time.
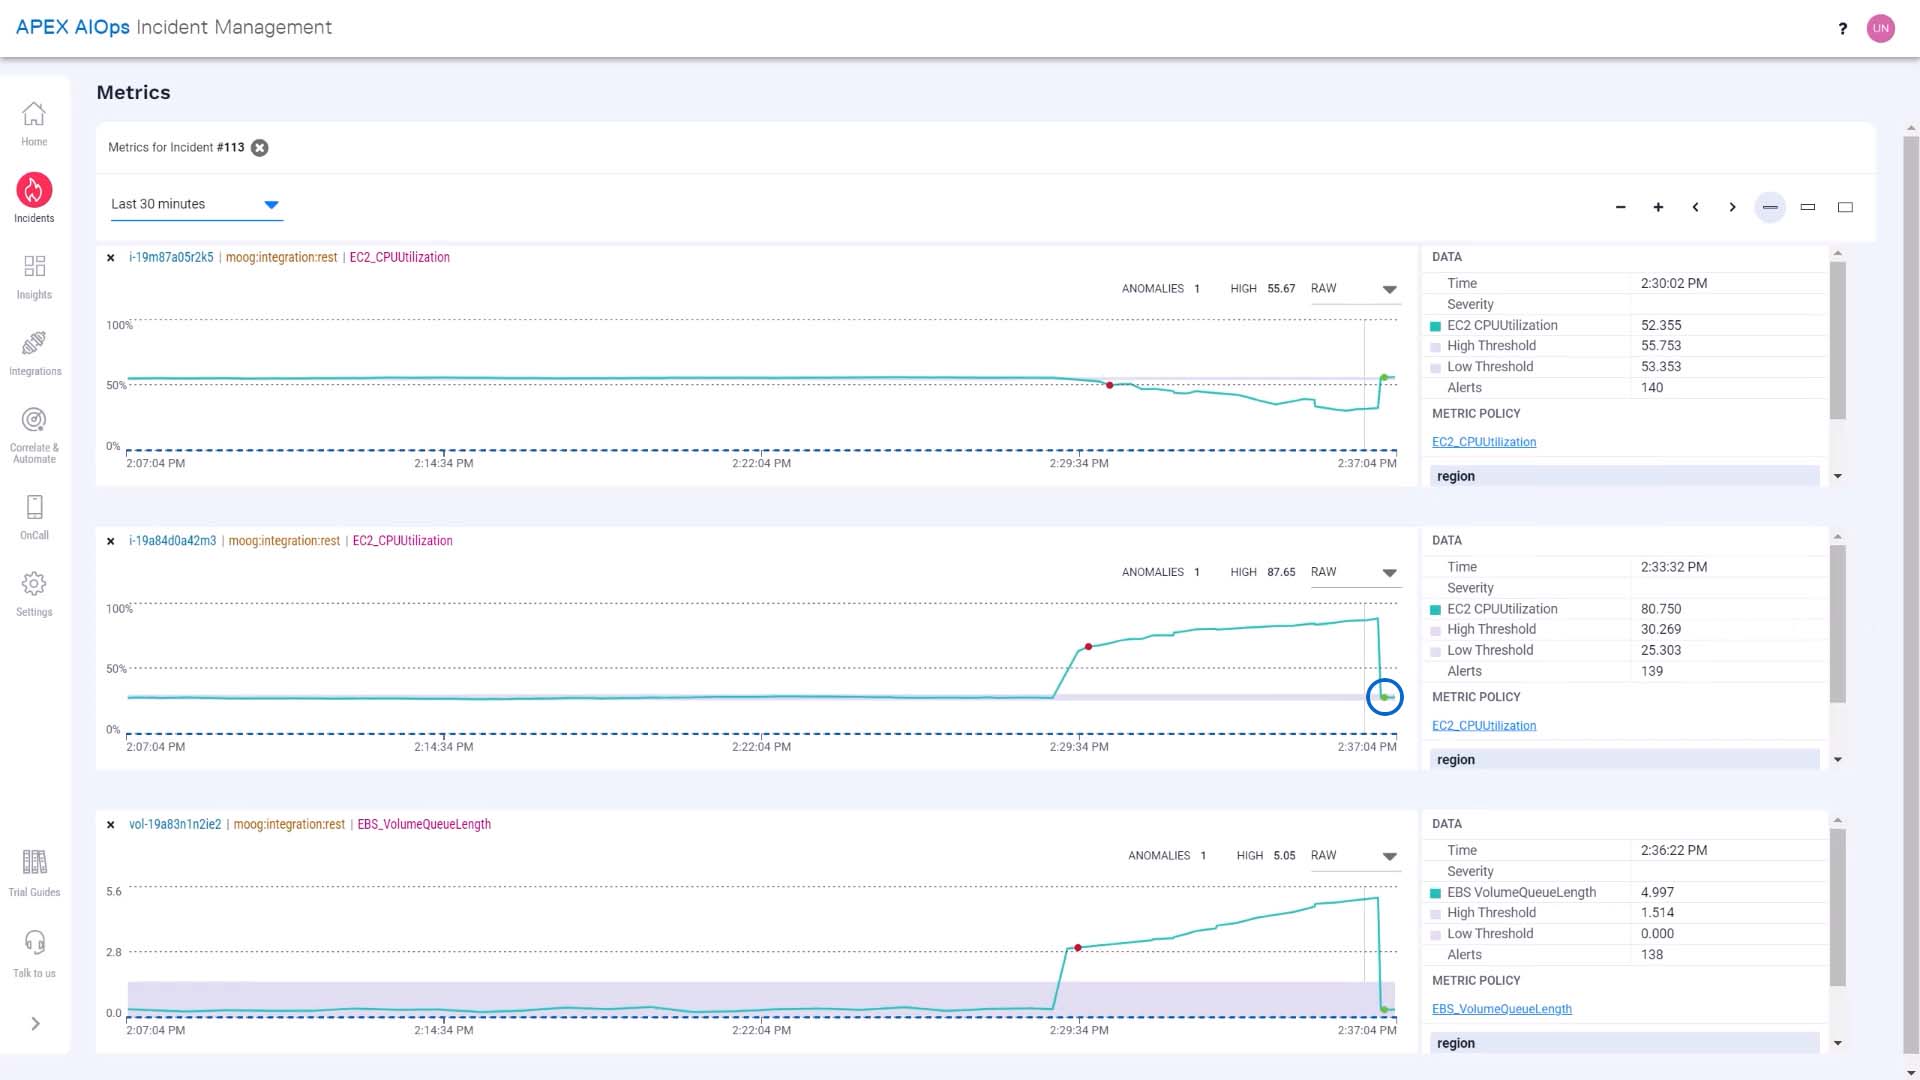
We’ve run the tool, and with the runaway processes that were overloading I/O killed, the CPU load on the front-end web server is back to normal...
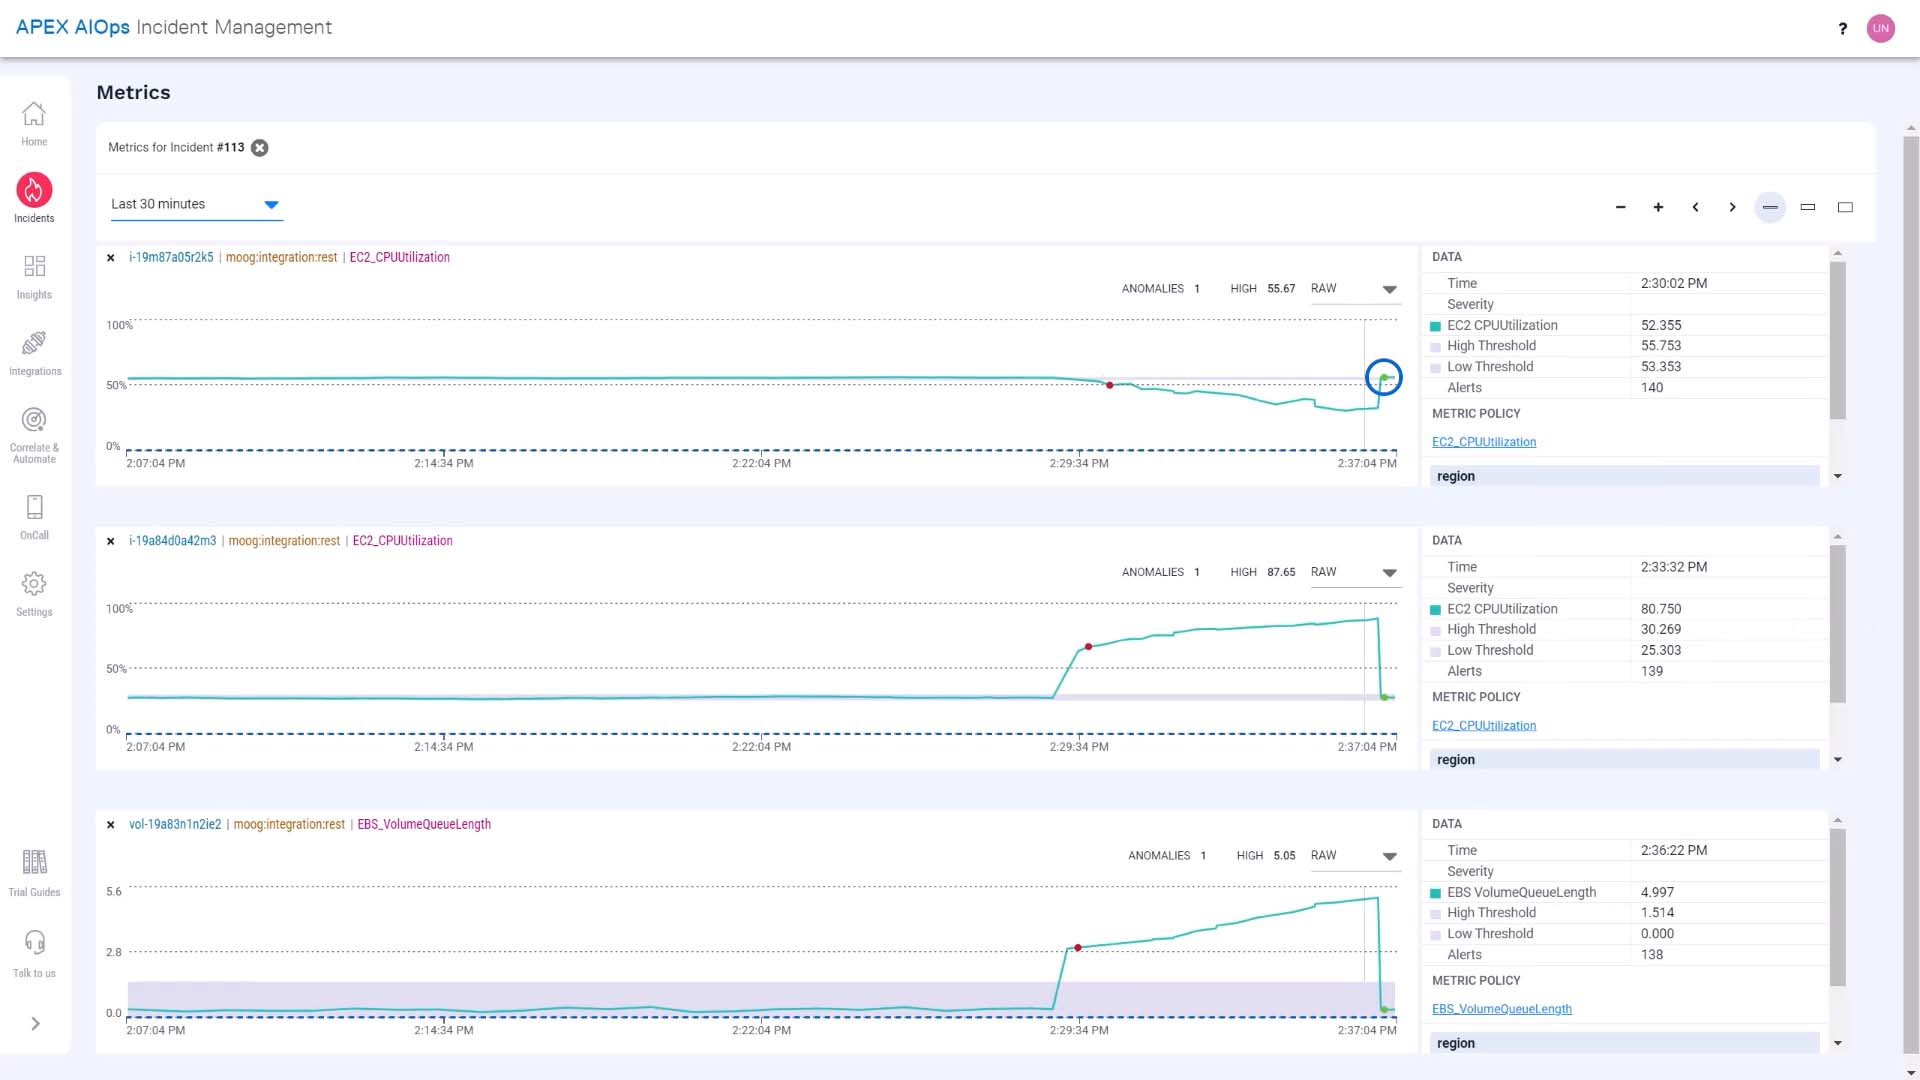
...and activity has resumed on the back end server as well.
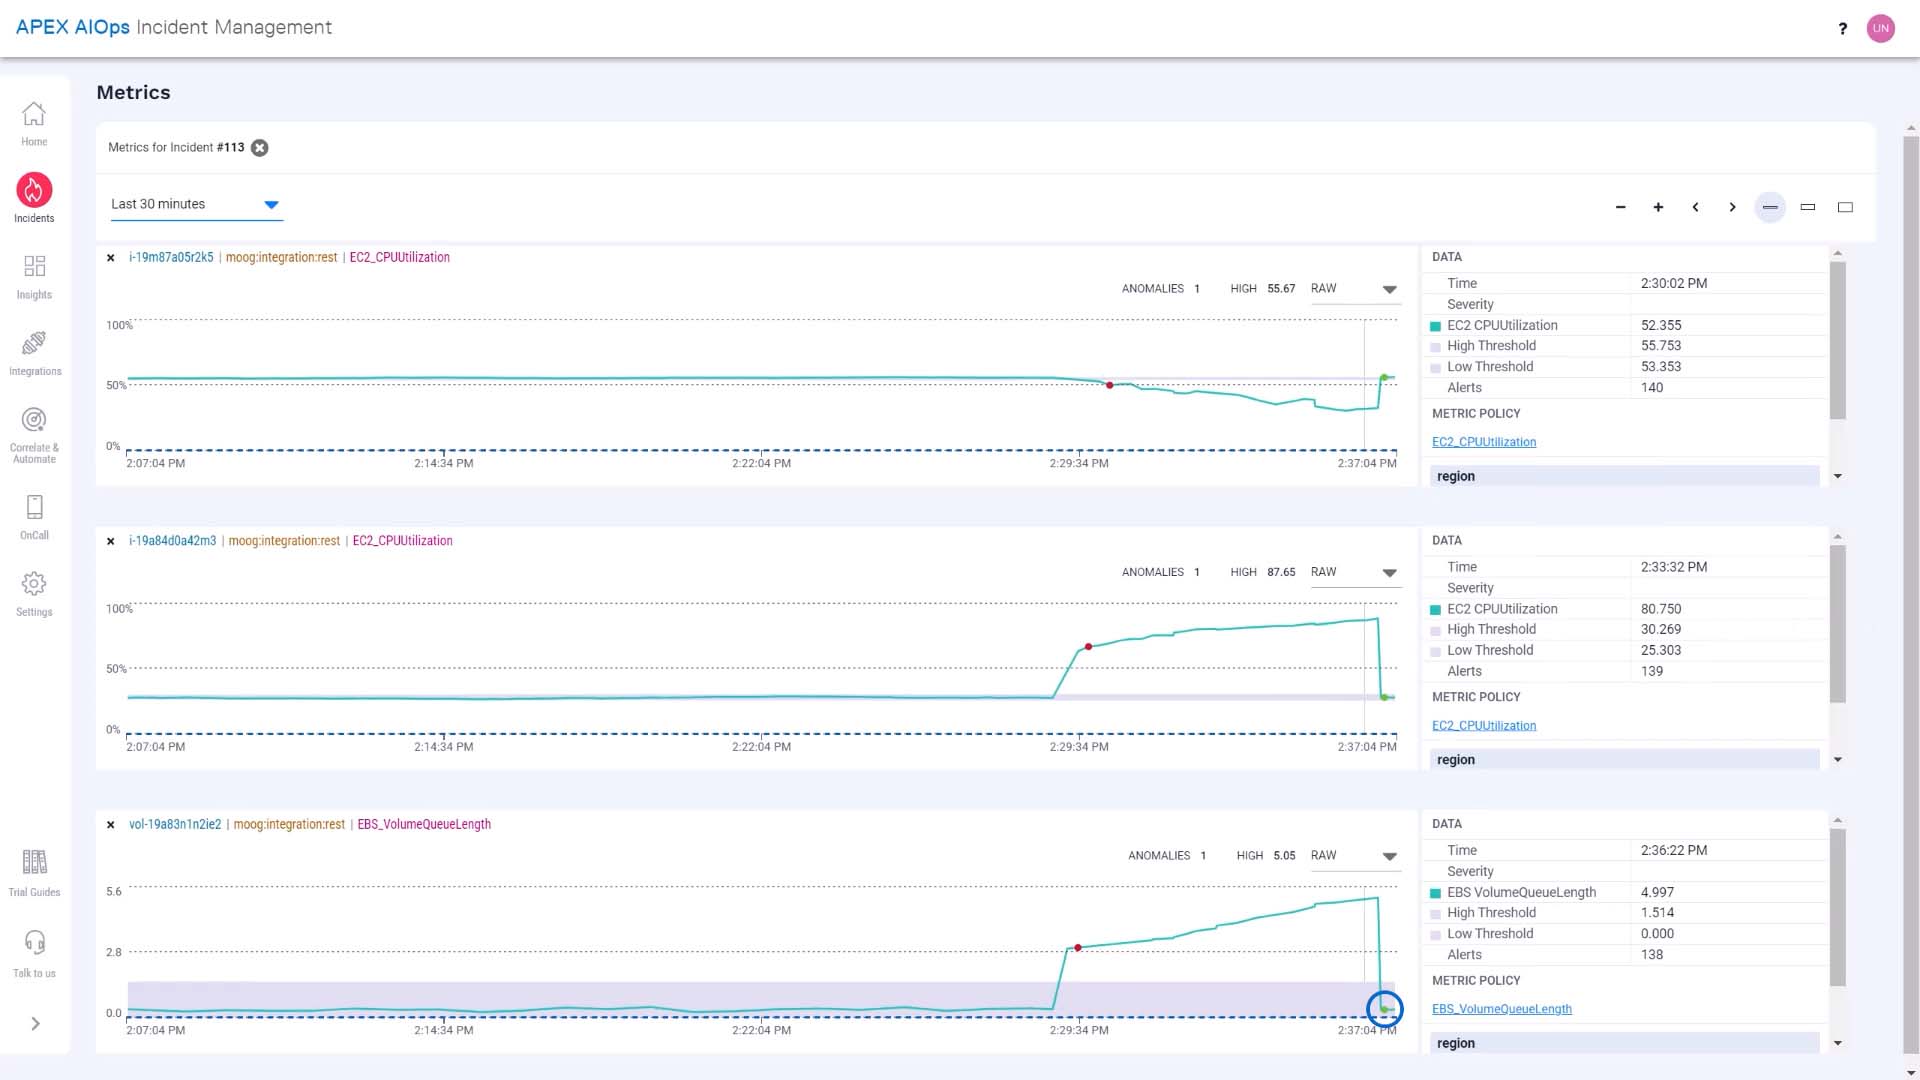
Nice! The anomaly has resolved and now the metrics are within the normal range previously learned by the system. Good job!
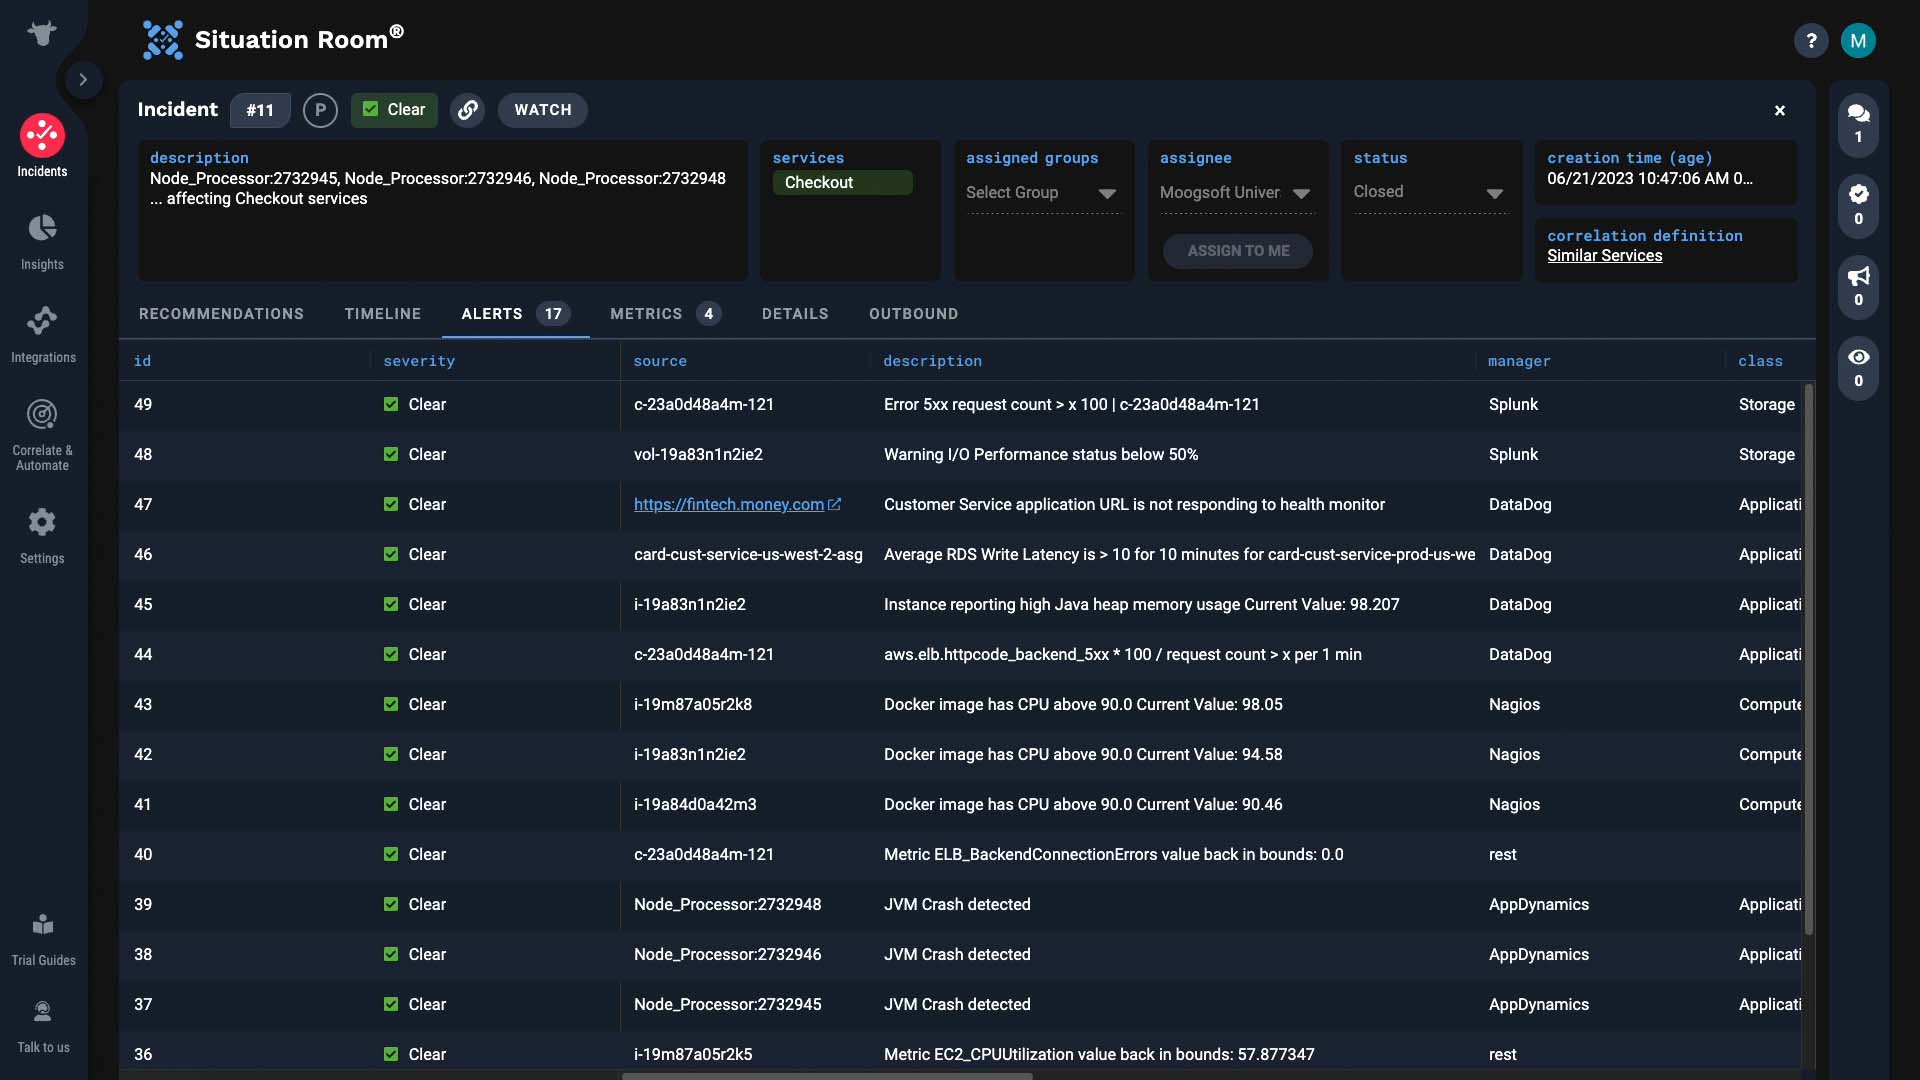
Now the alerts in our incident are all clear, as well as the incident itself.
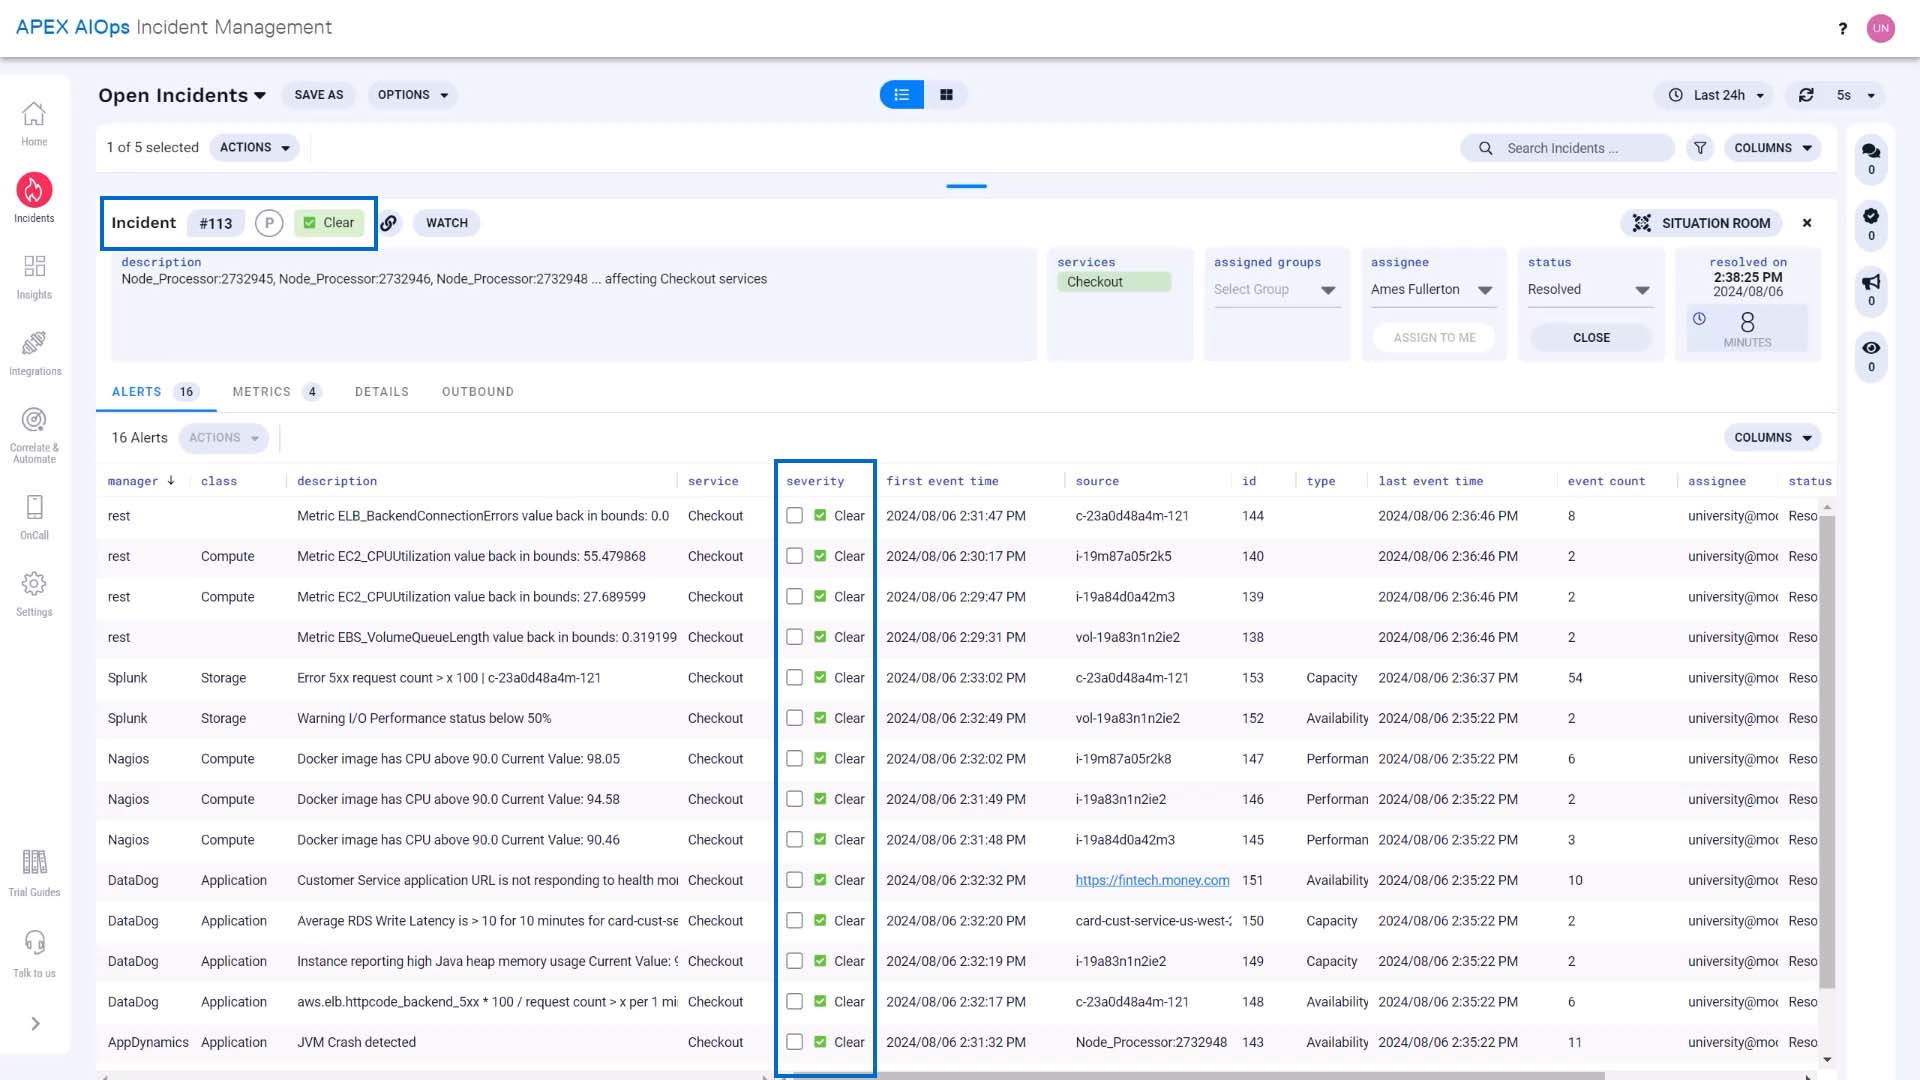
The incident status has been changed to resolved. We'll document our solution, and the case is closed!
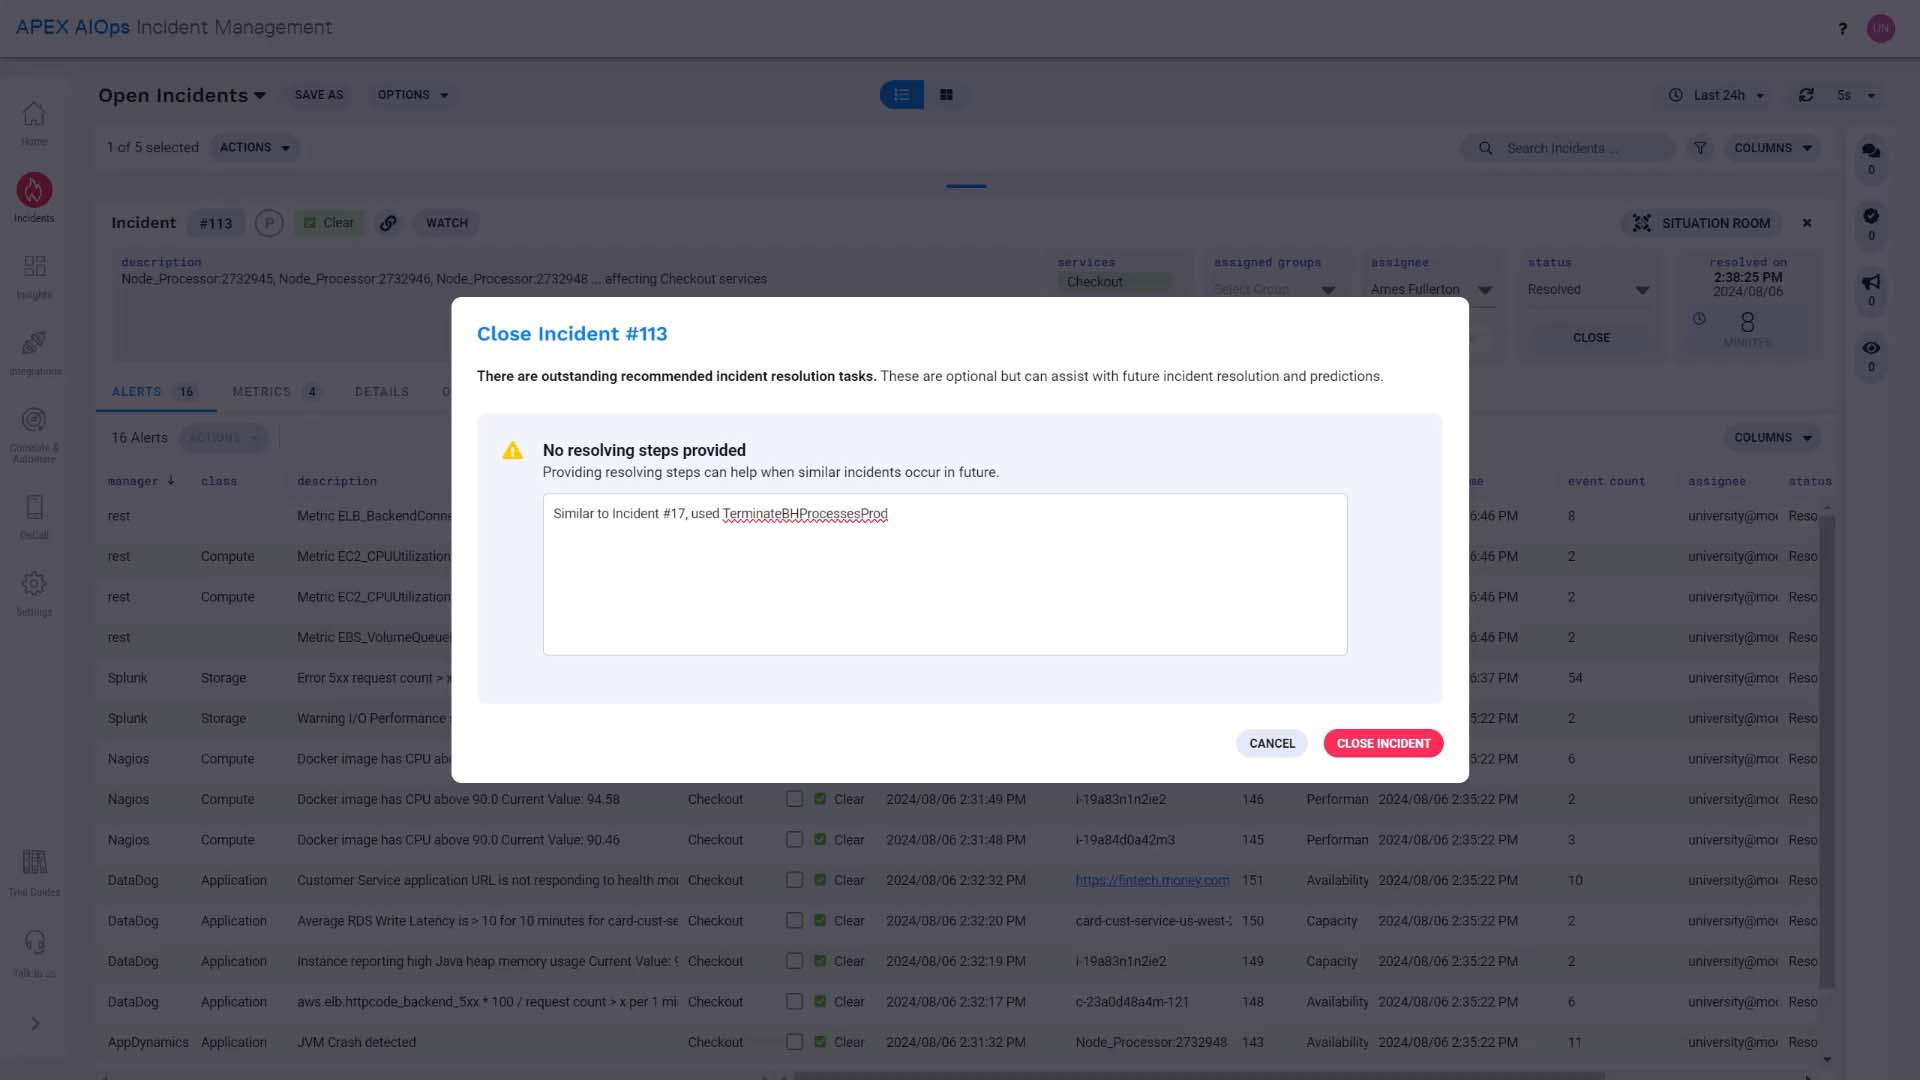
Just like that, we have resolved our first incident in Incident Management. Now it’s your turn to experience this workflow yourself!
Thanks for watching!
BASIC | 2 MIN
Learn how to manage your incident queue and dashboard.
Use case walkthrough: Queue and dashboards in APEX AIOps Incident Management ►
This video explains how you can use the queue and dashboards to view incidents in APEX AIOps Incident Management.
*Please note Moogsoft is now part of Dell's IT Operations solution called APEX AIOps, and changed its name to APEX AIOps Incident Management. The UI in this video may differ slightly but the content covered is still relevant.
How do you know what’s coming down the pipeline for you to work on in Incident Management? This is the default incident list. This includes all open incidents, regardless of the nature of the issues or assignments.
Your operational procedure may be as simple as just looking at this list and picking an unassigned ticket.
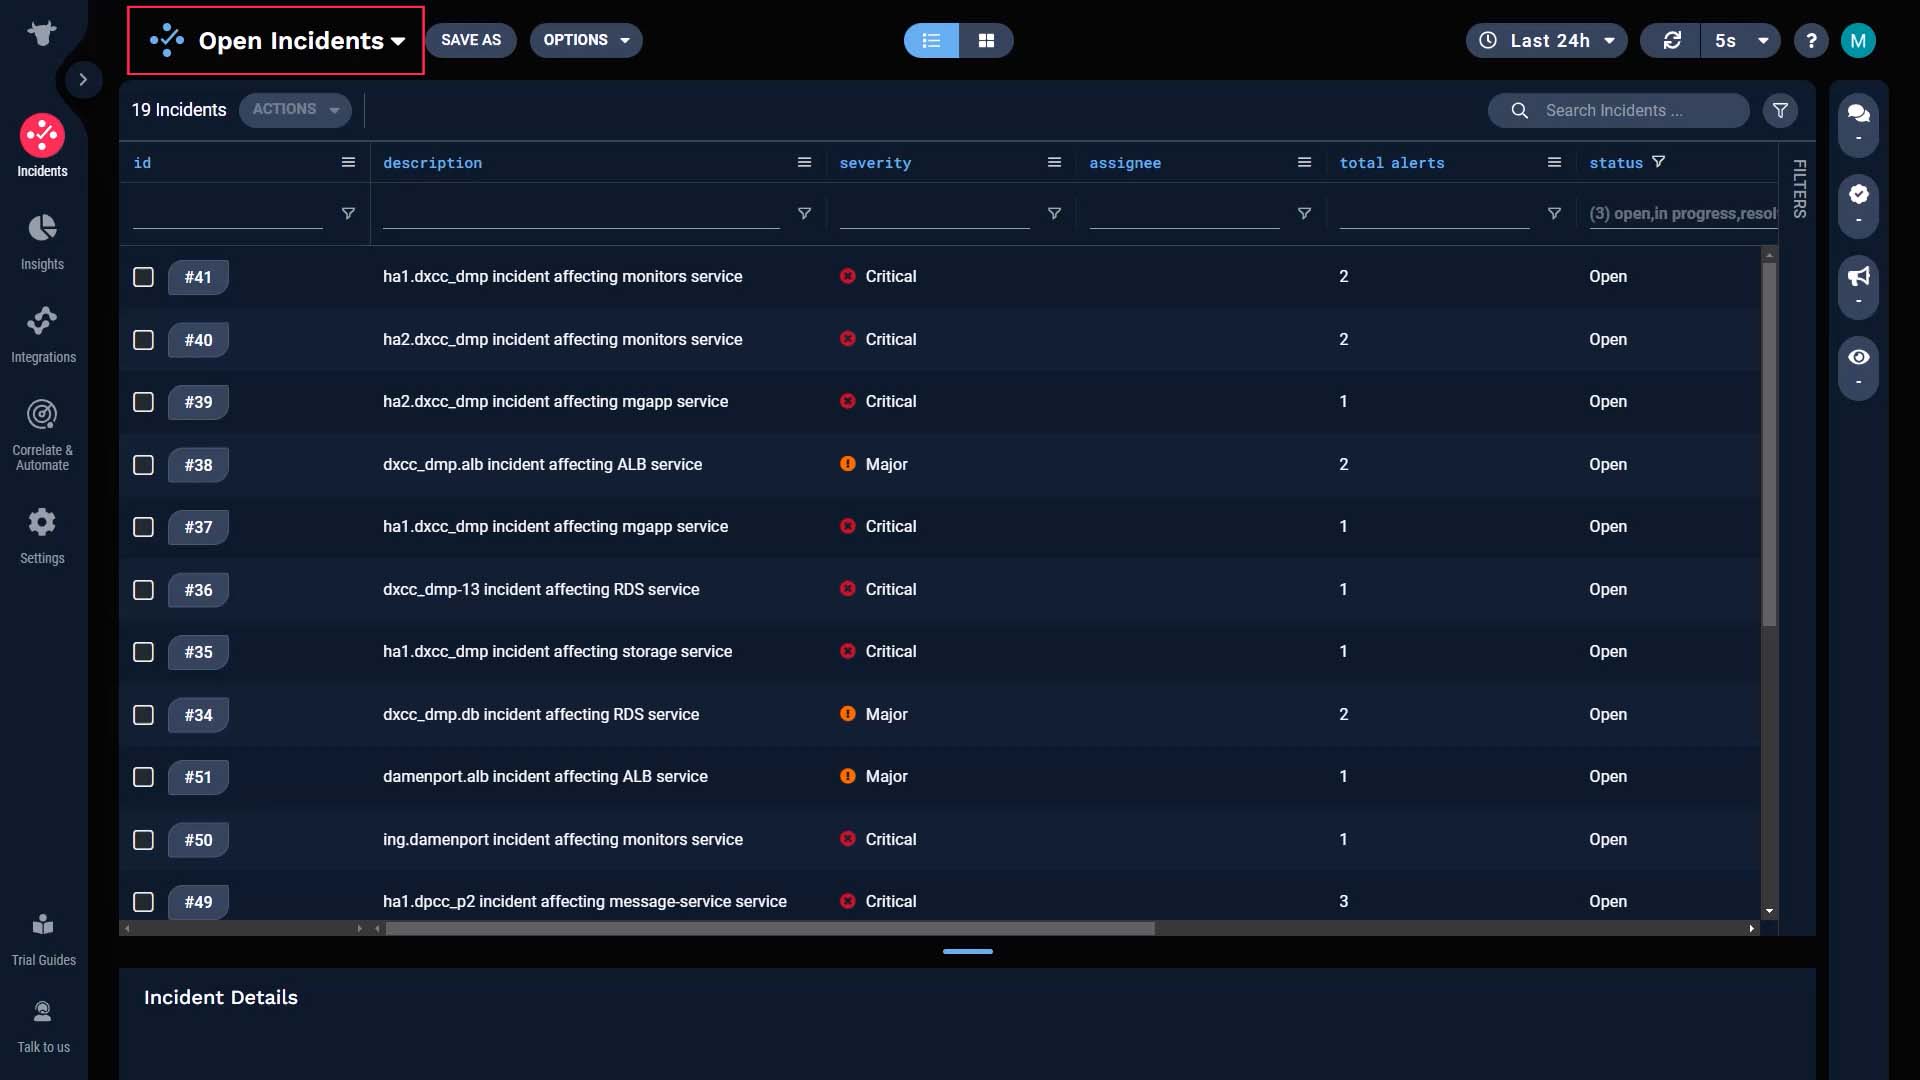
But most likely, you have a queue specific to your team. In this example, we have access to the Application Support team’s incidents view.
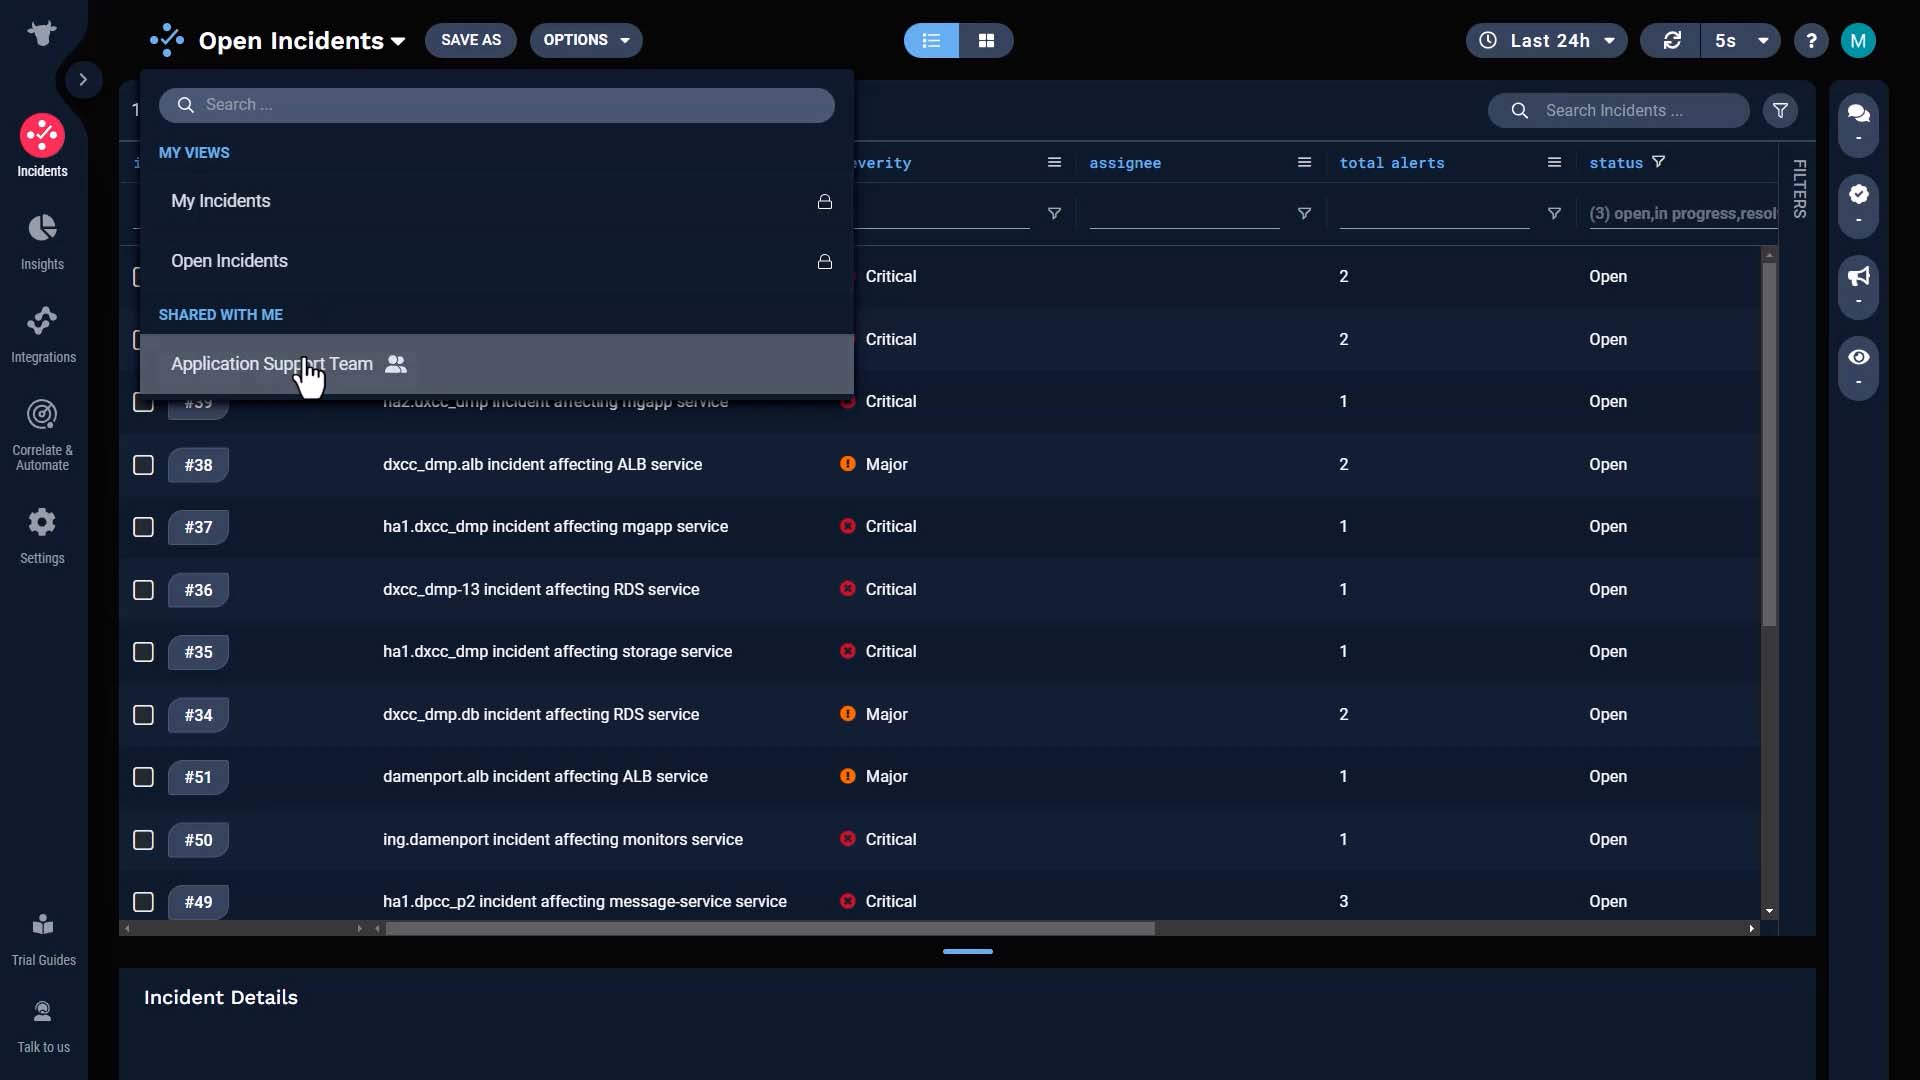
So basically this is a list of application-related incidents. Your administrator may have set up a workflow to set the team assignment based on the impacted services, or there may be someone triaging incoming incidents and routing the applicable ones to your team.
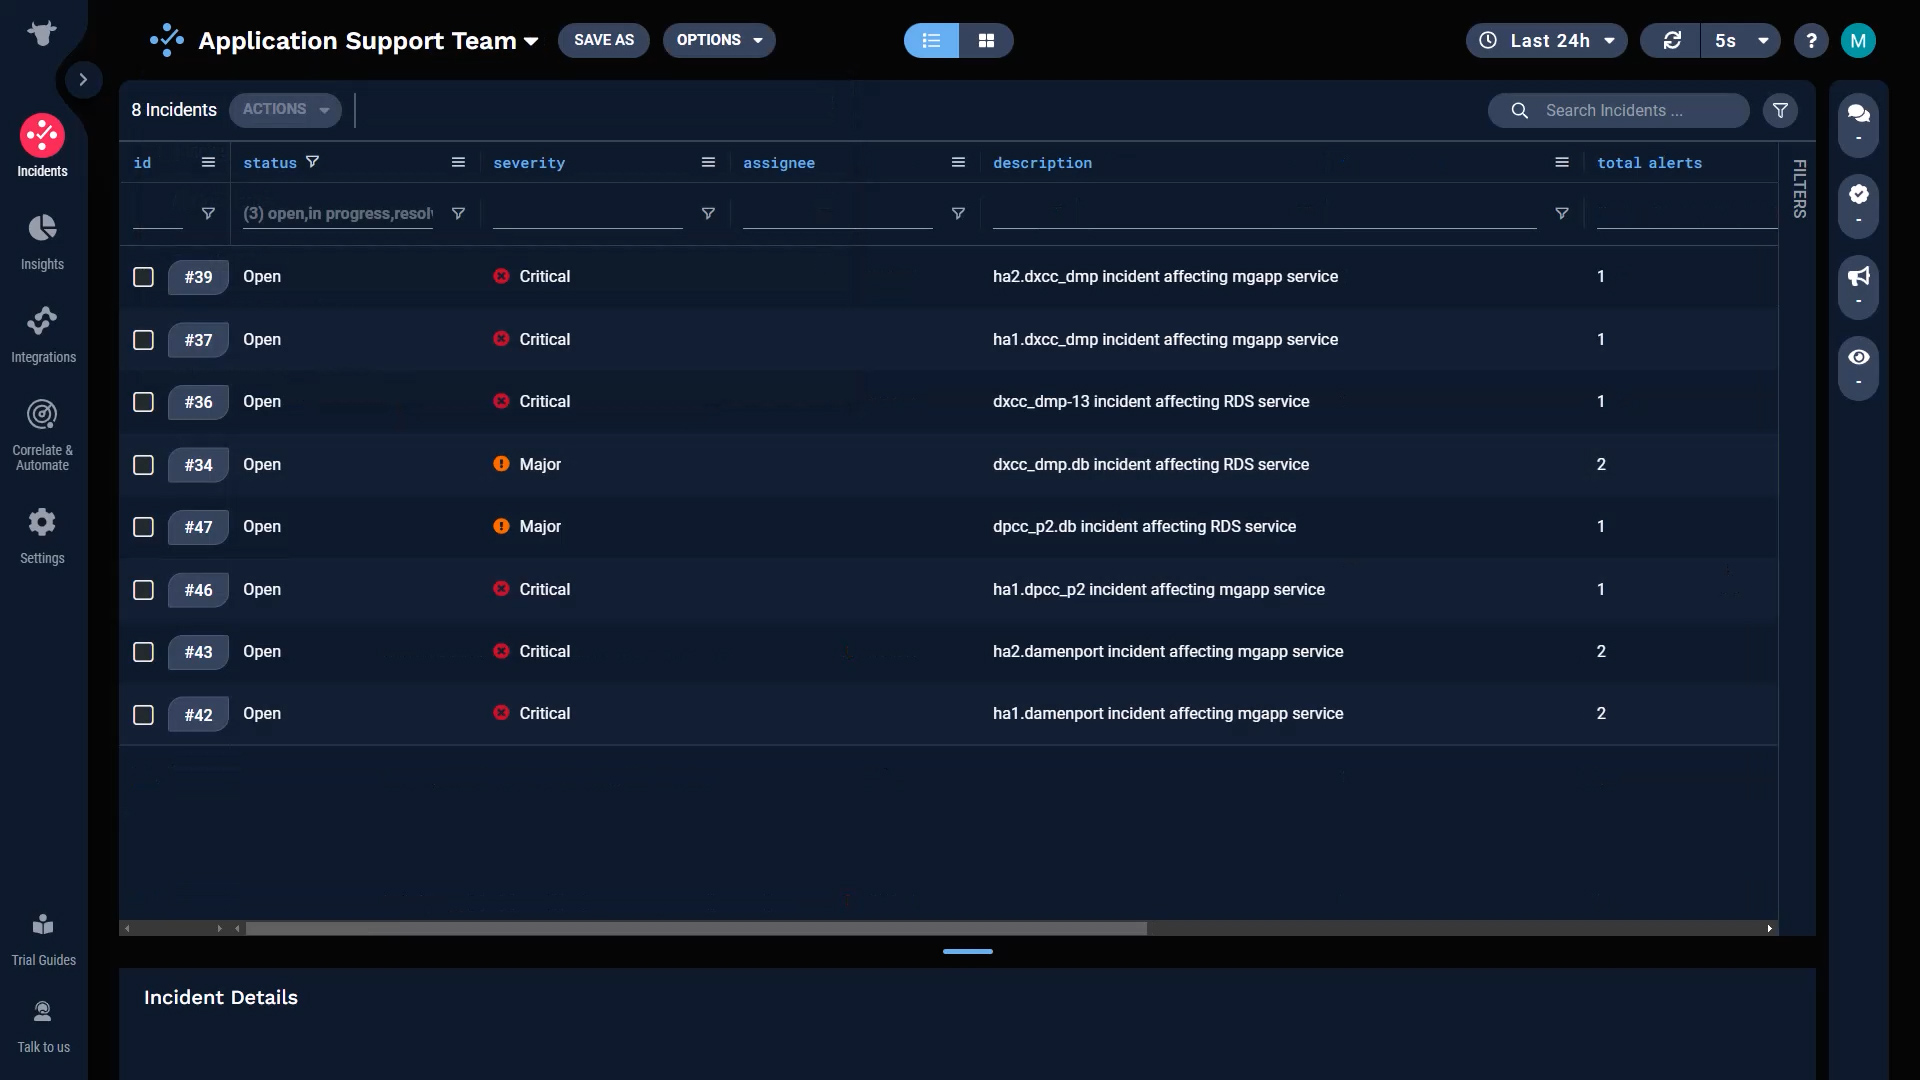
And you can make this your default view without affecting other users.
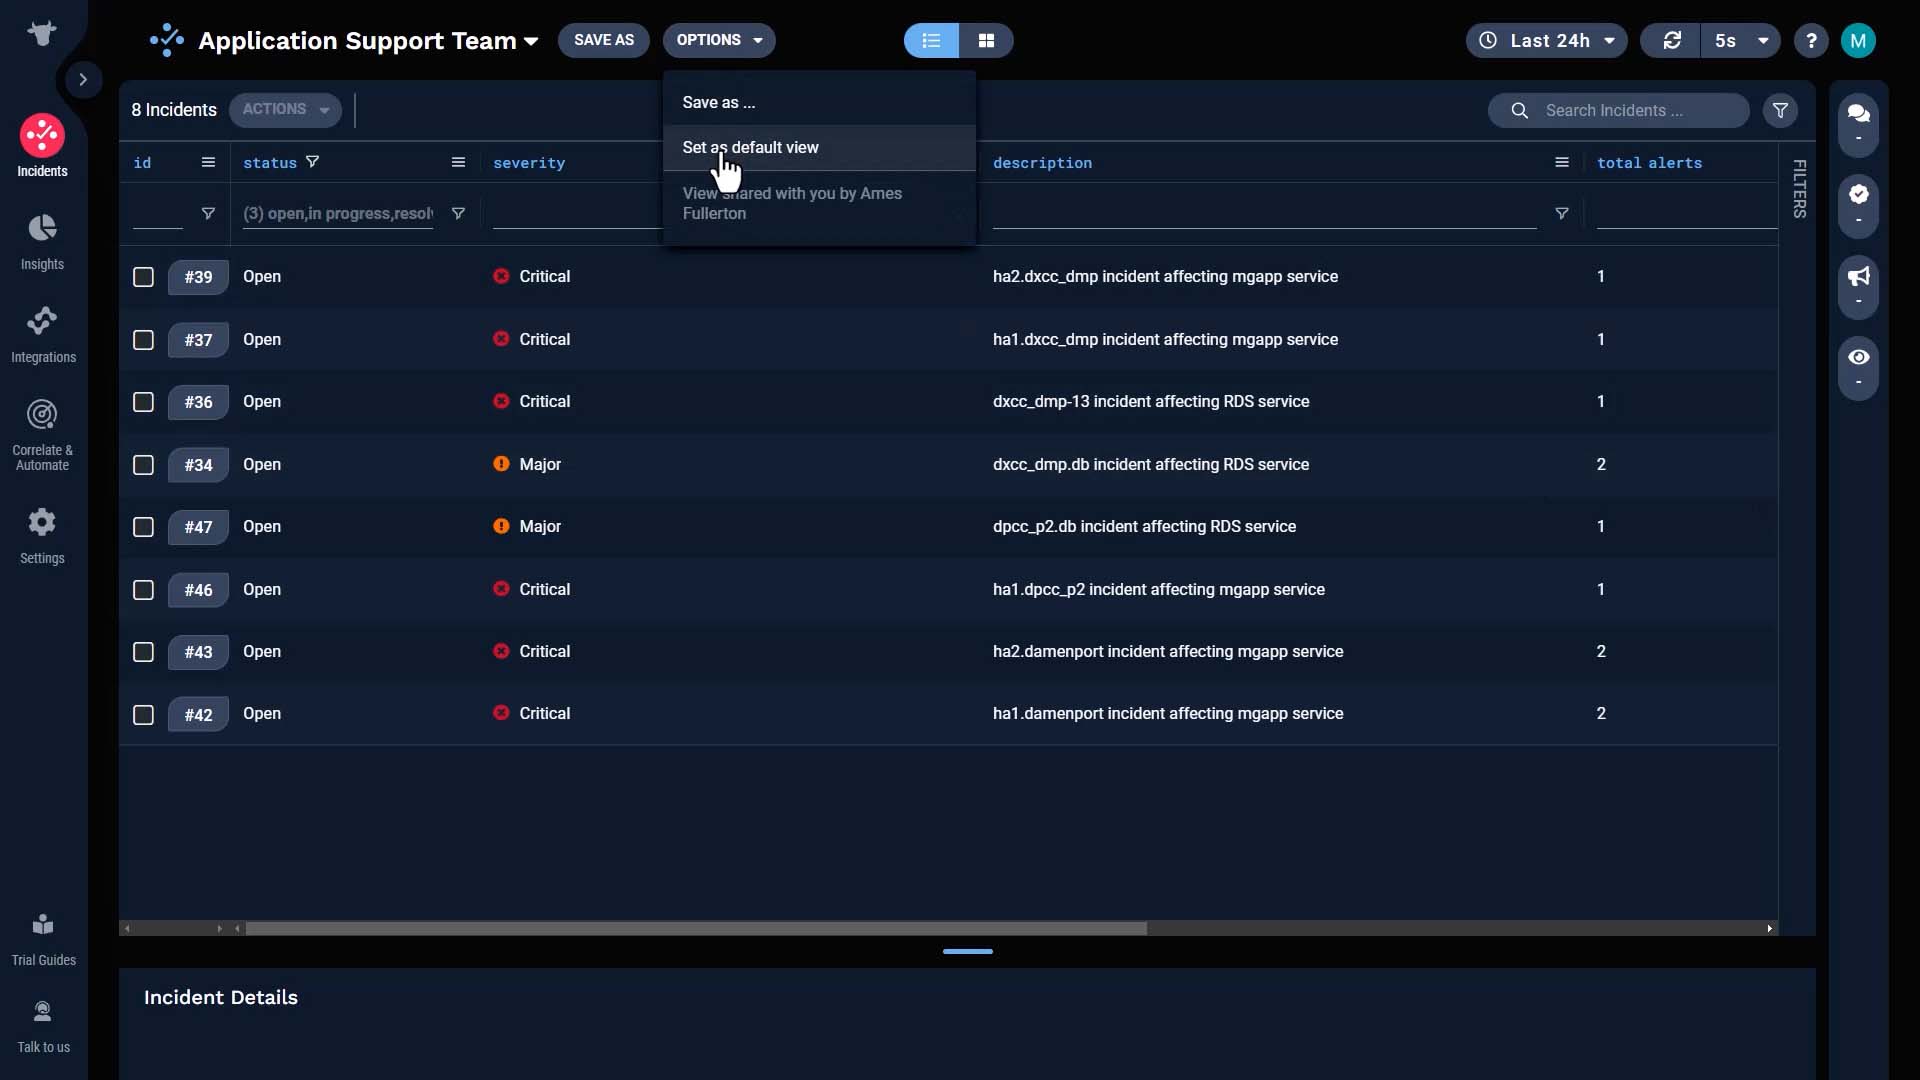
Let’s say we are going to work on this one.
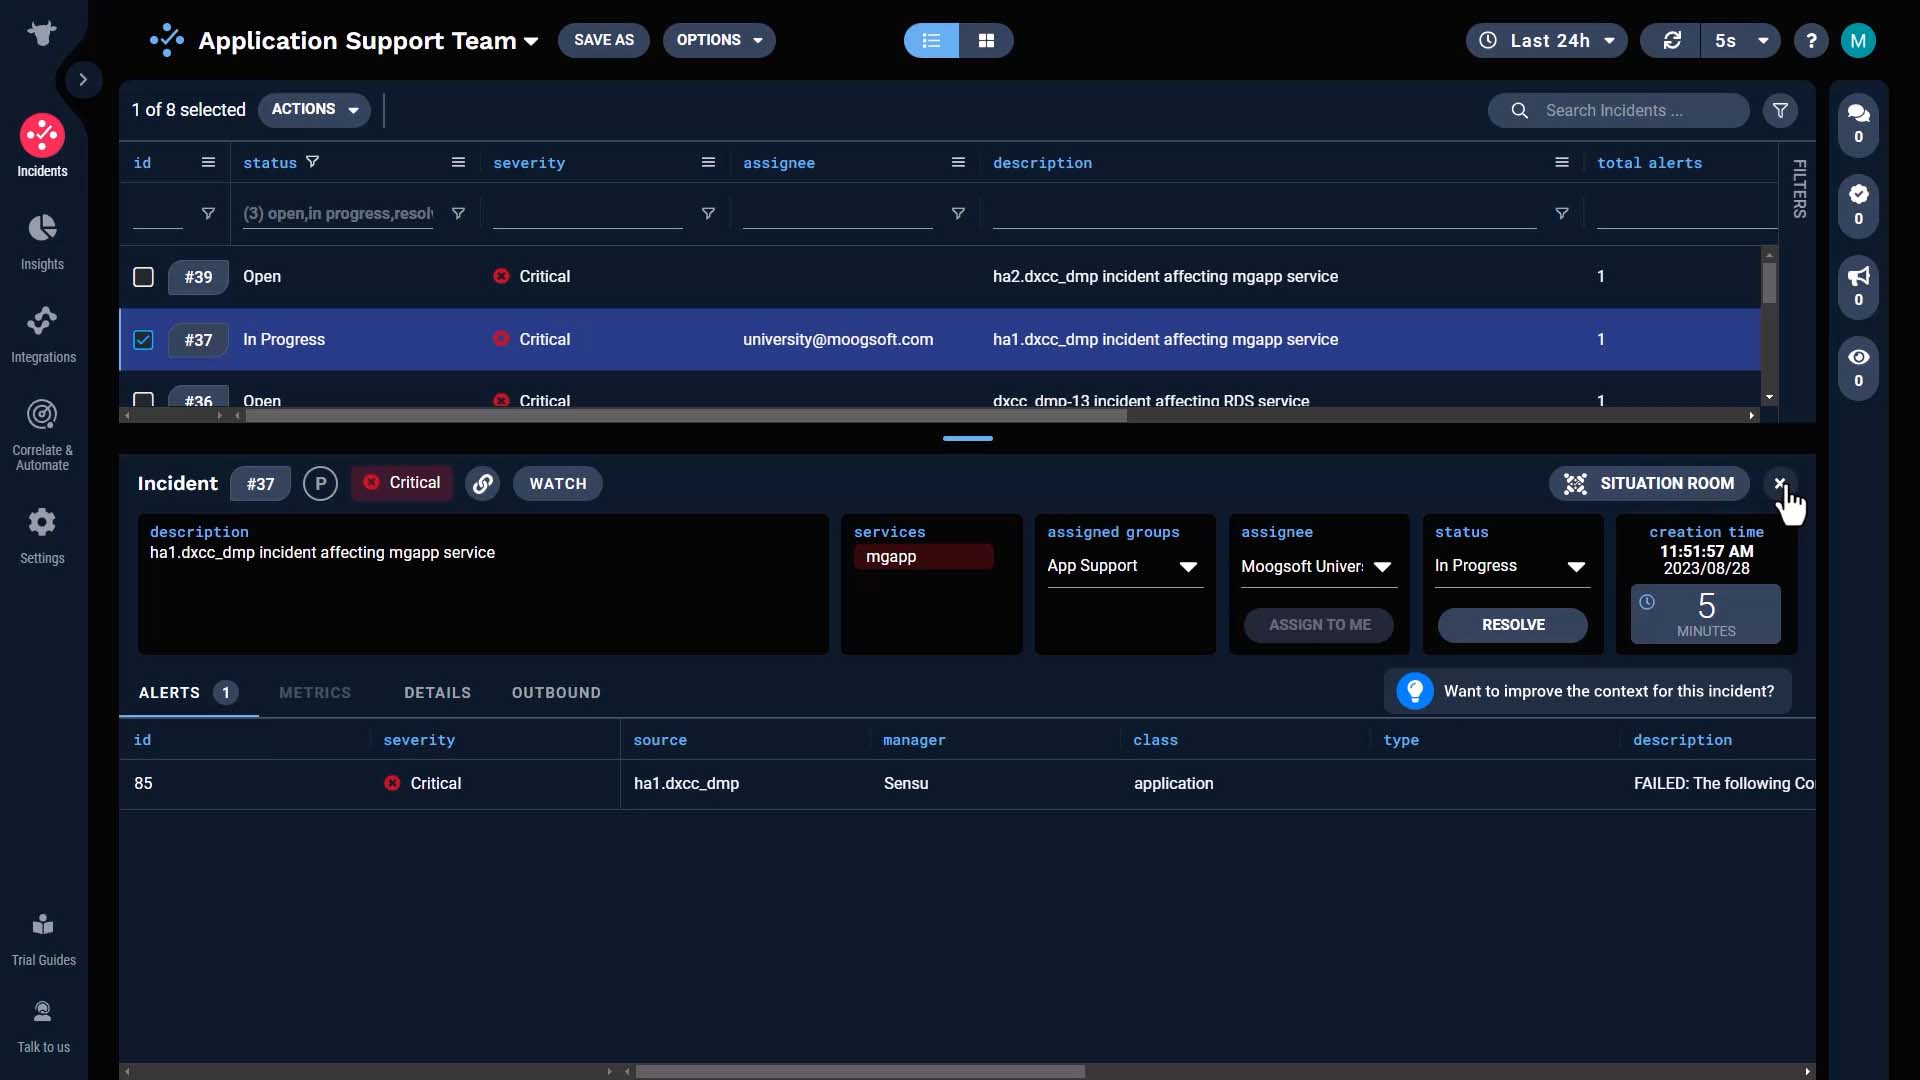
There’s a list view that only shows the incidents you are assigned to.
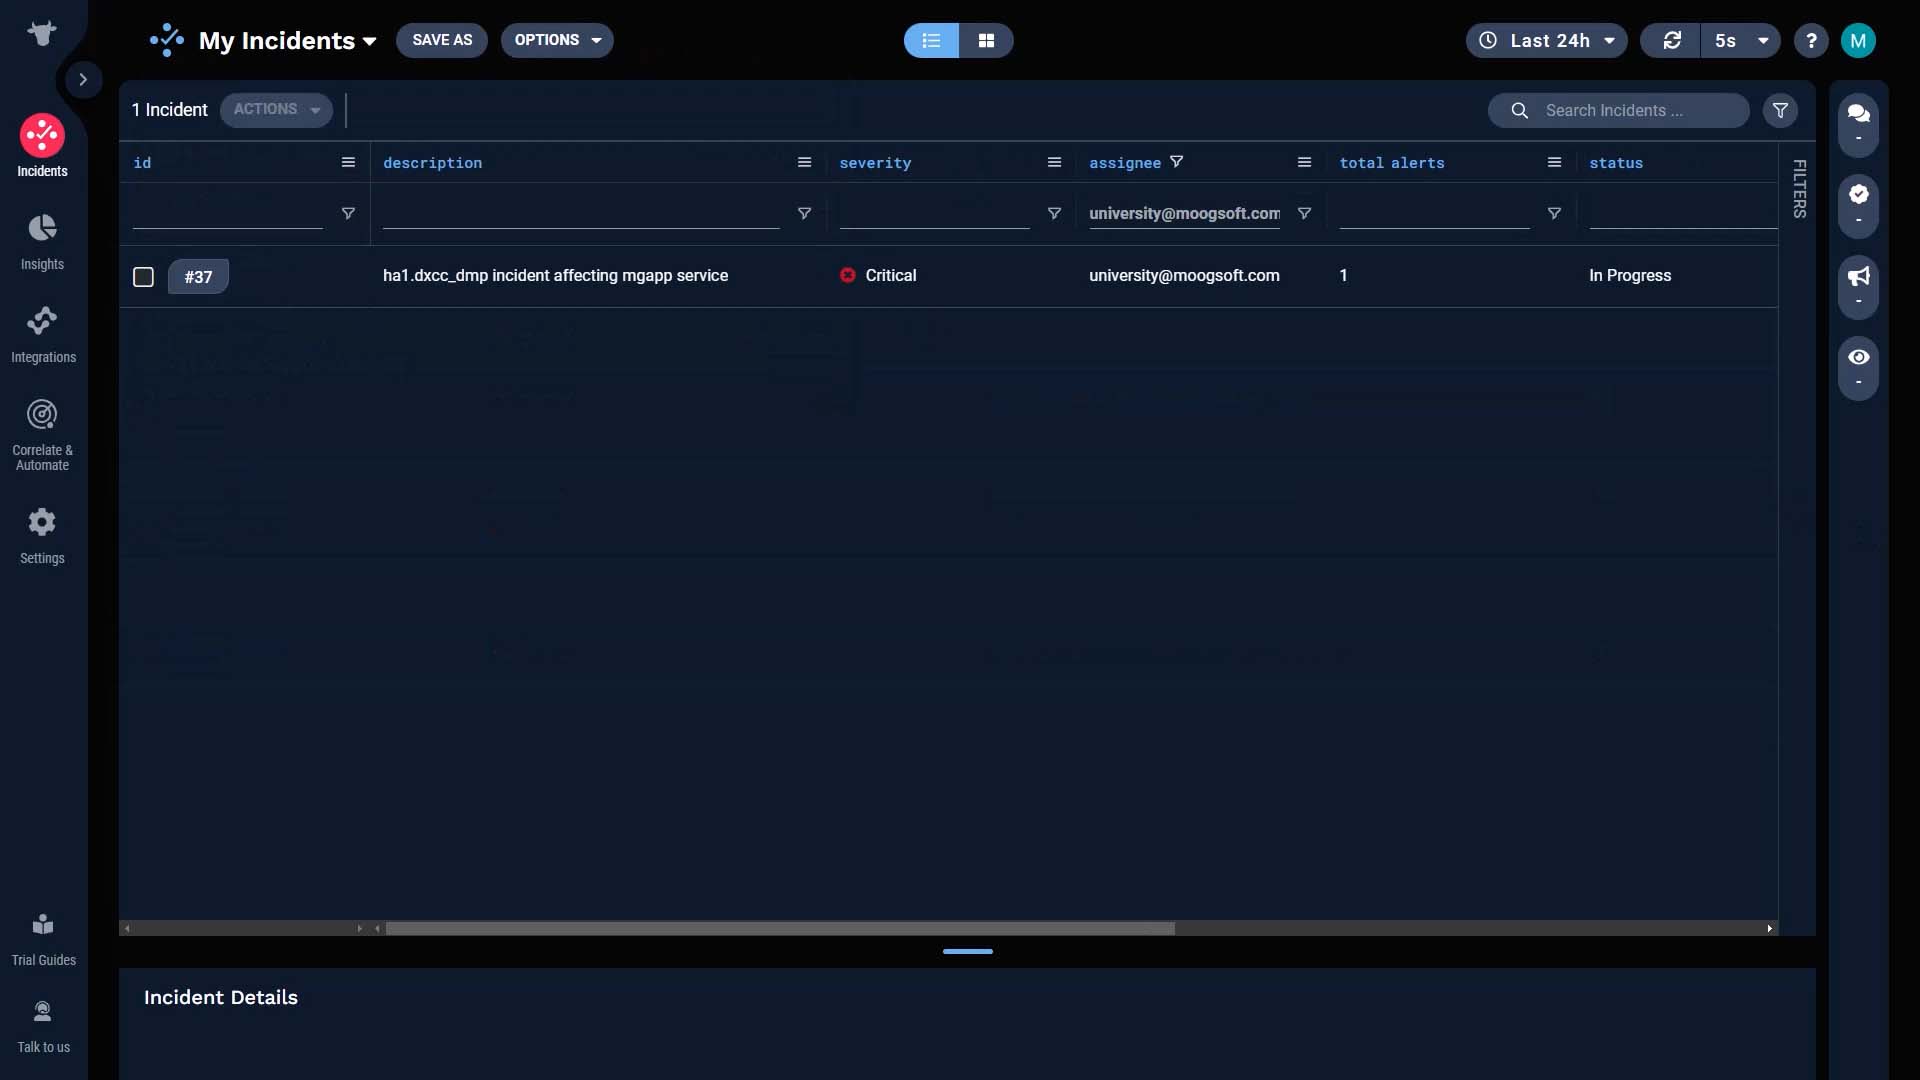
If you want to filter the list further you can do so here.
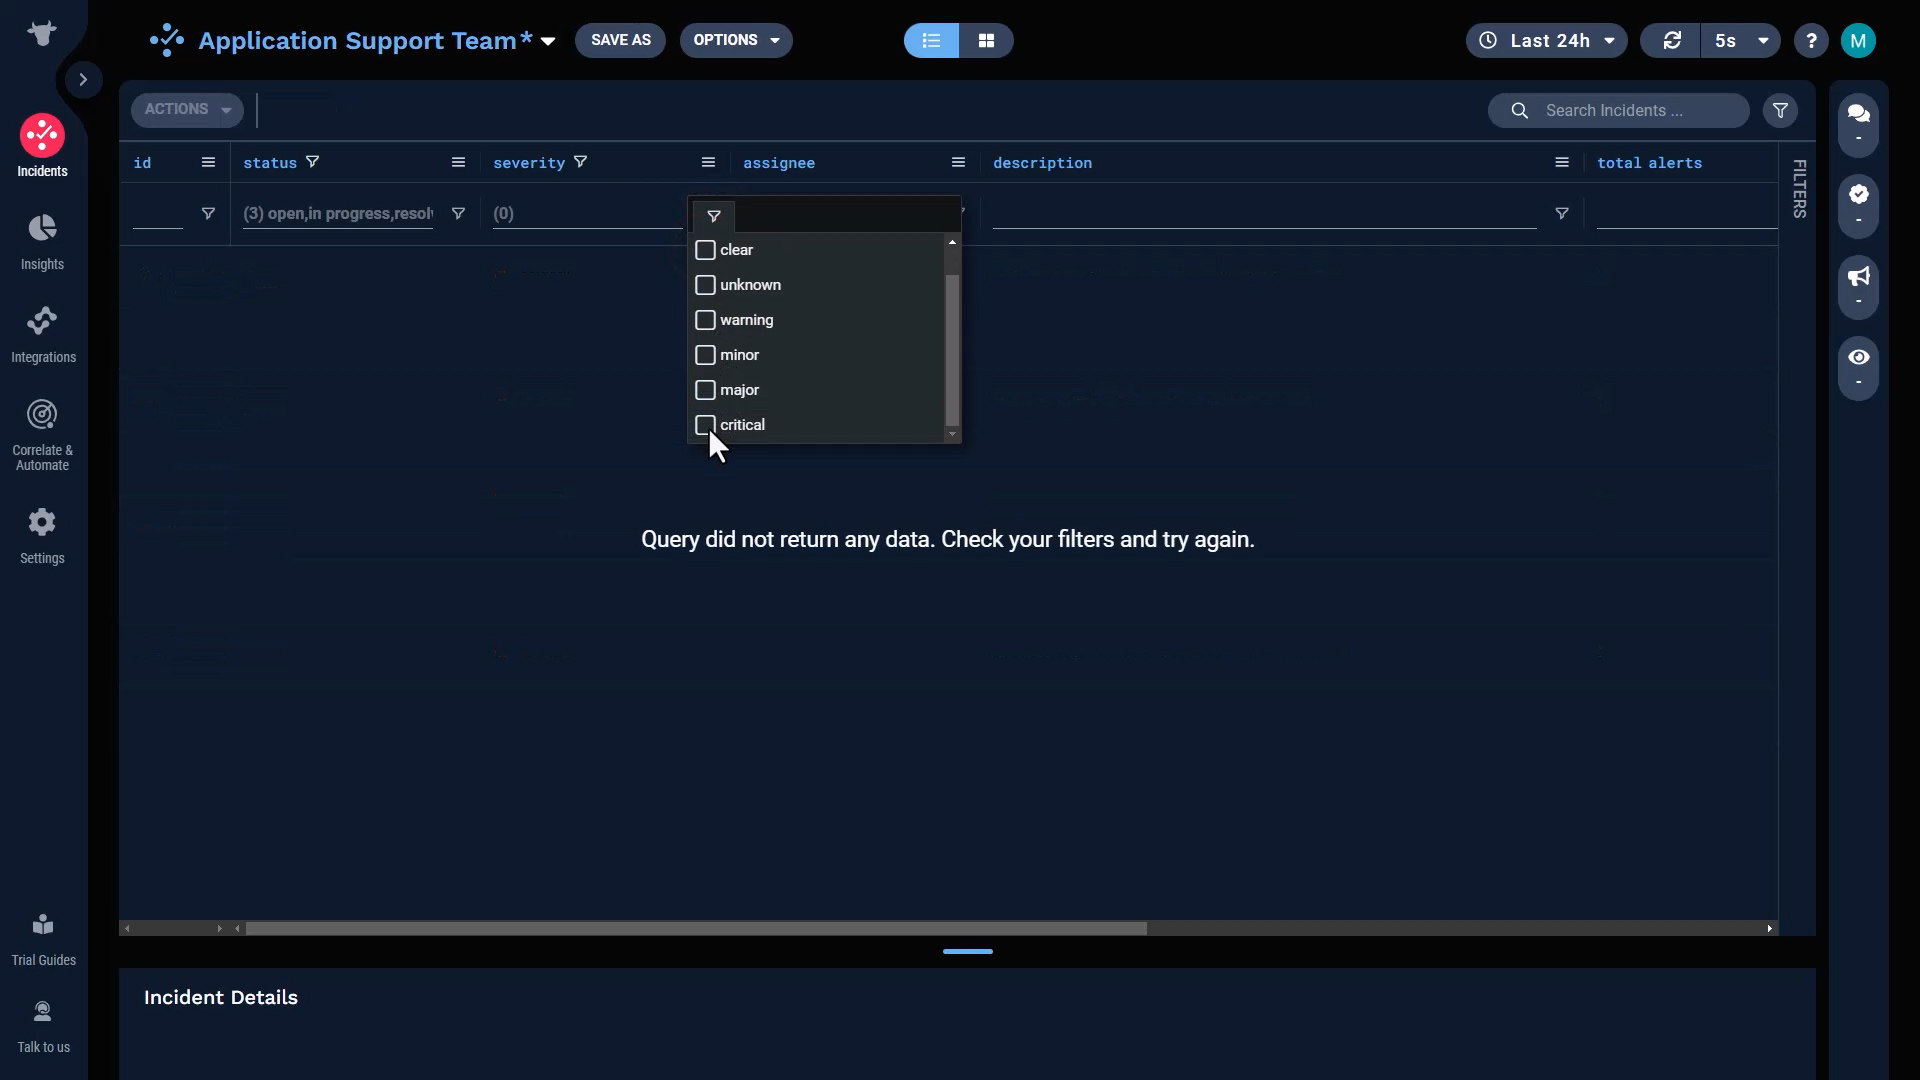
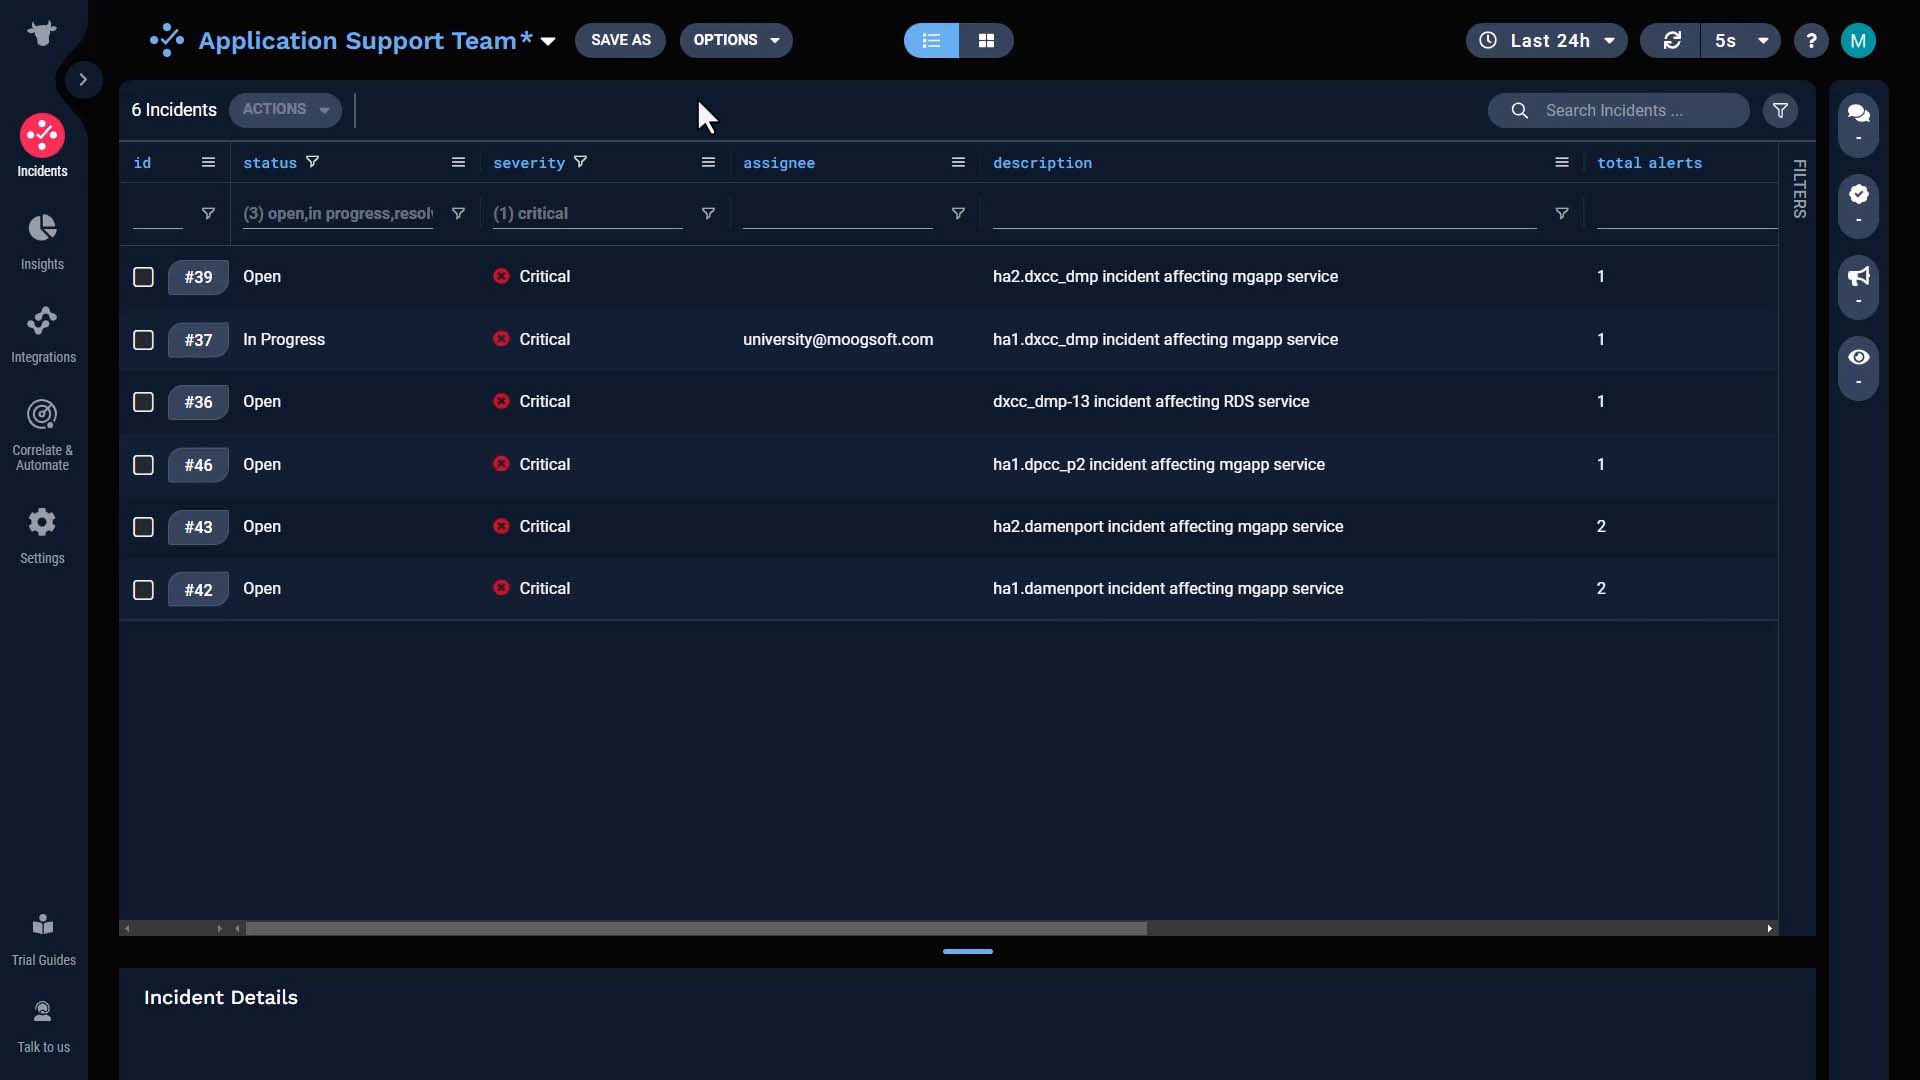
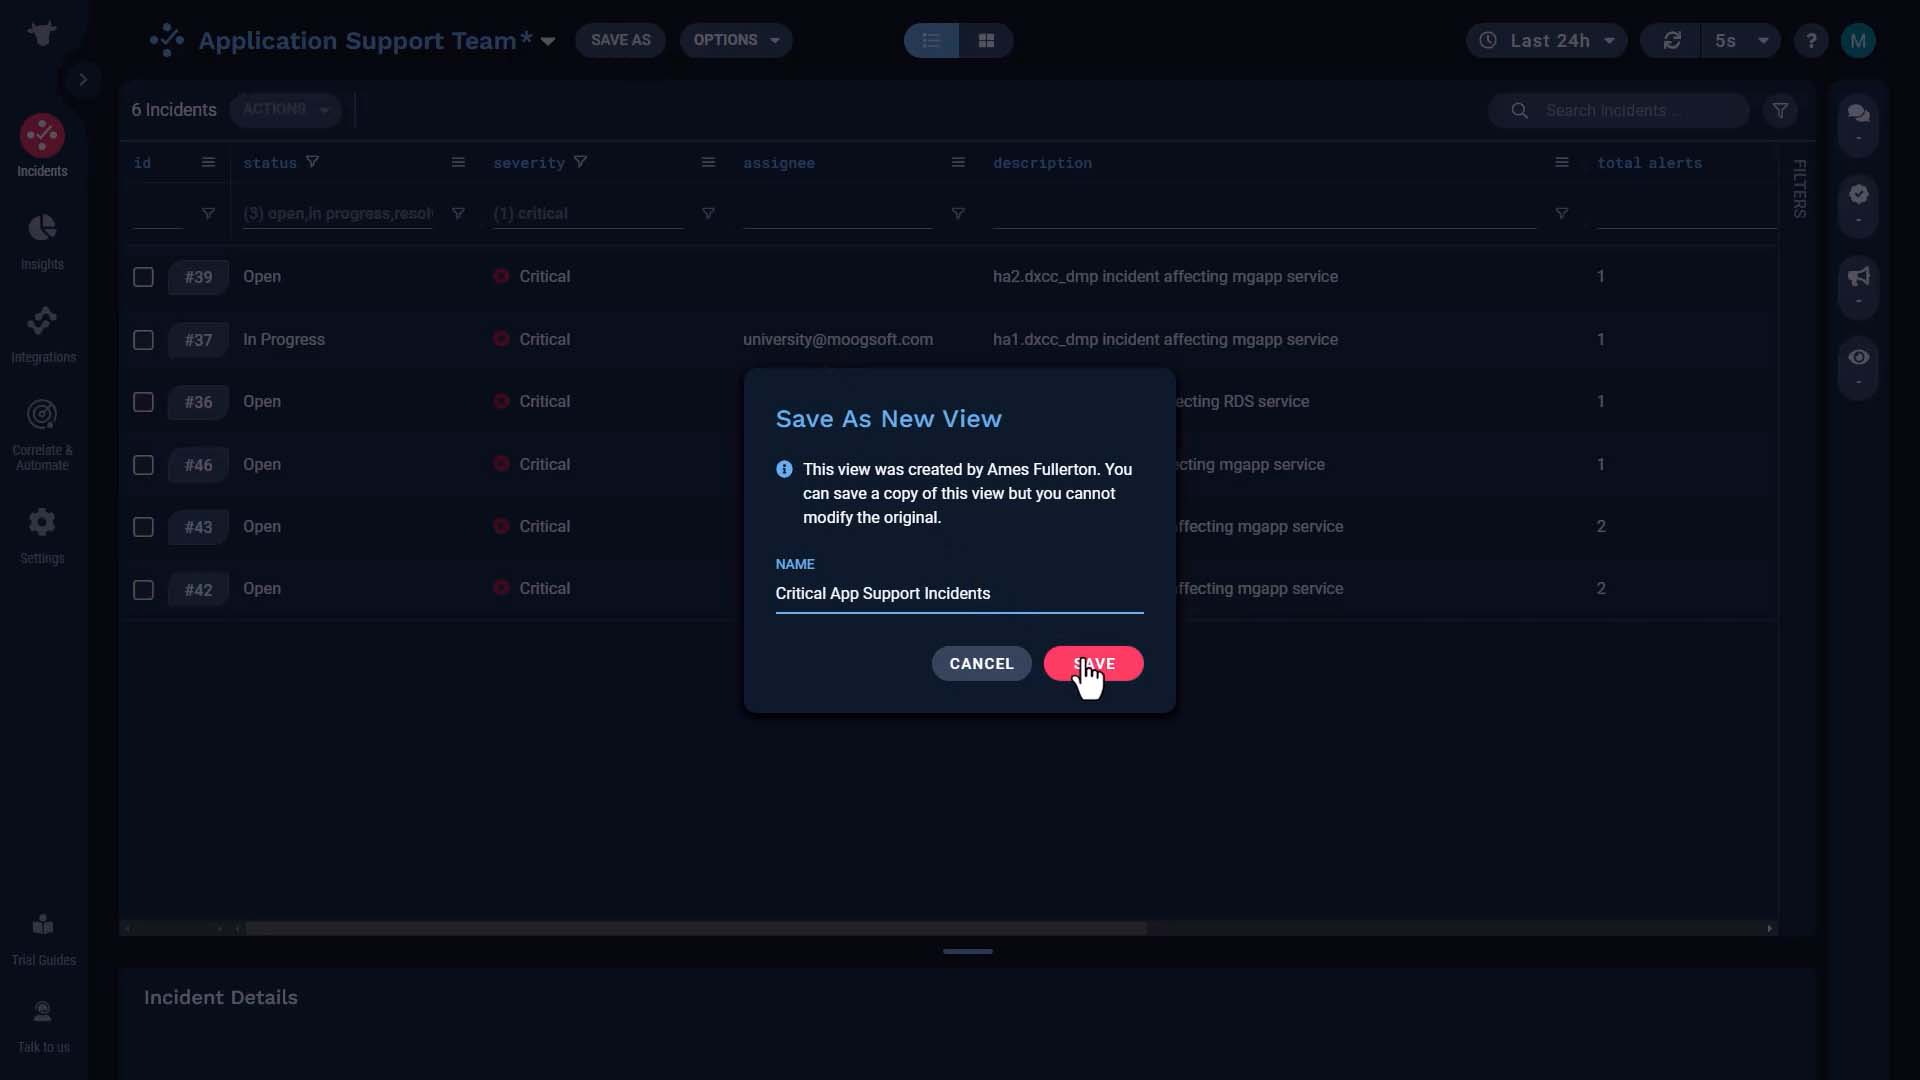
You can save the view for yourself without affecting the original view.
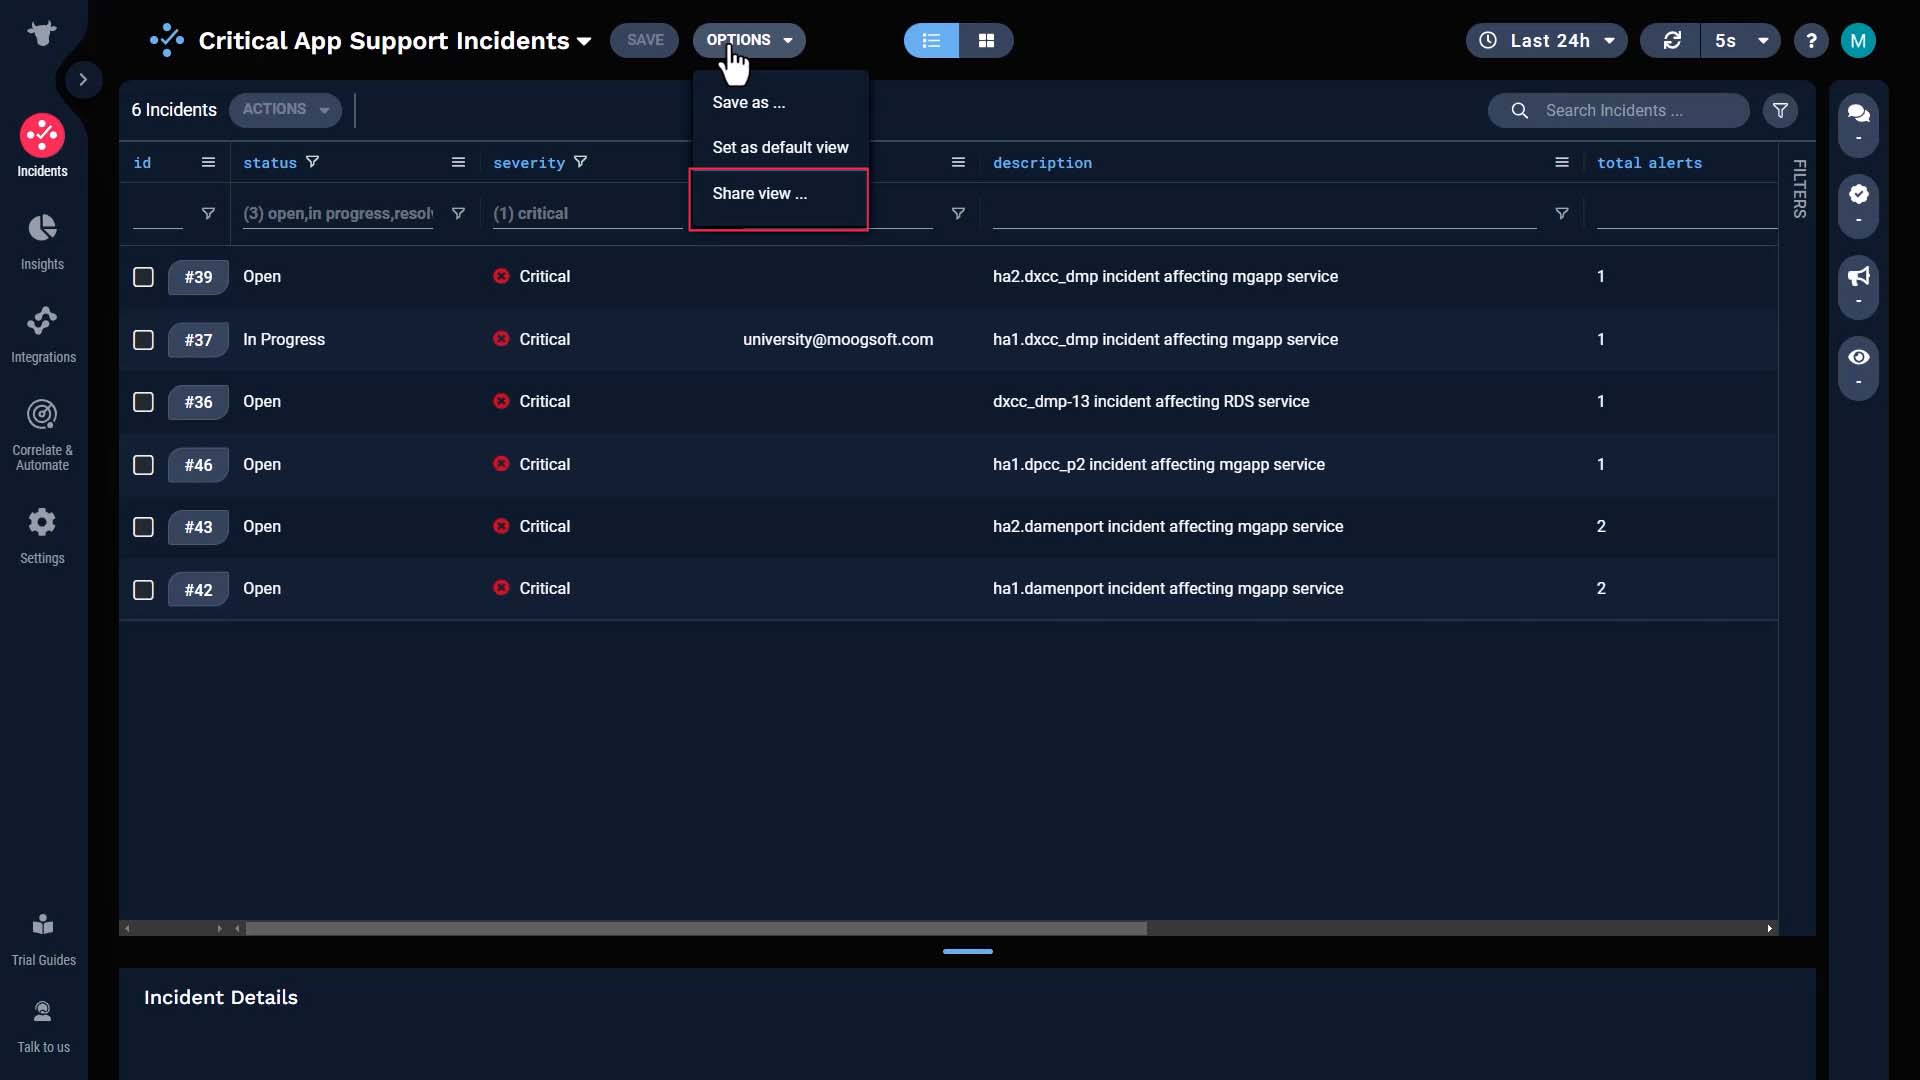
If you want to make it a shared view, you can do so here.
When you create a view, you also get a corresponding dashboard.
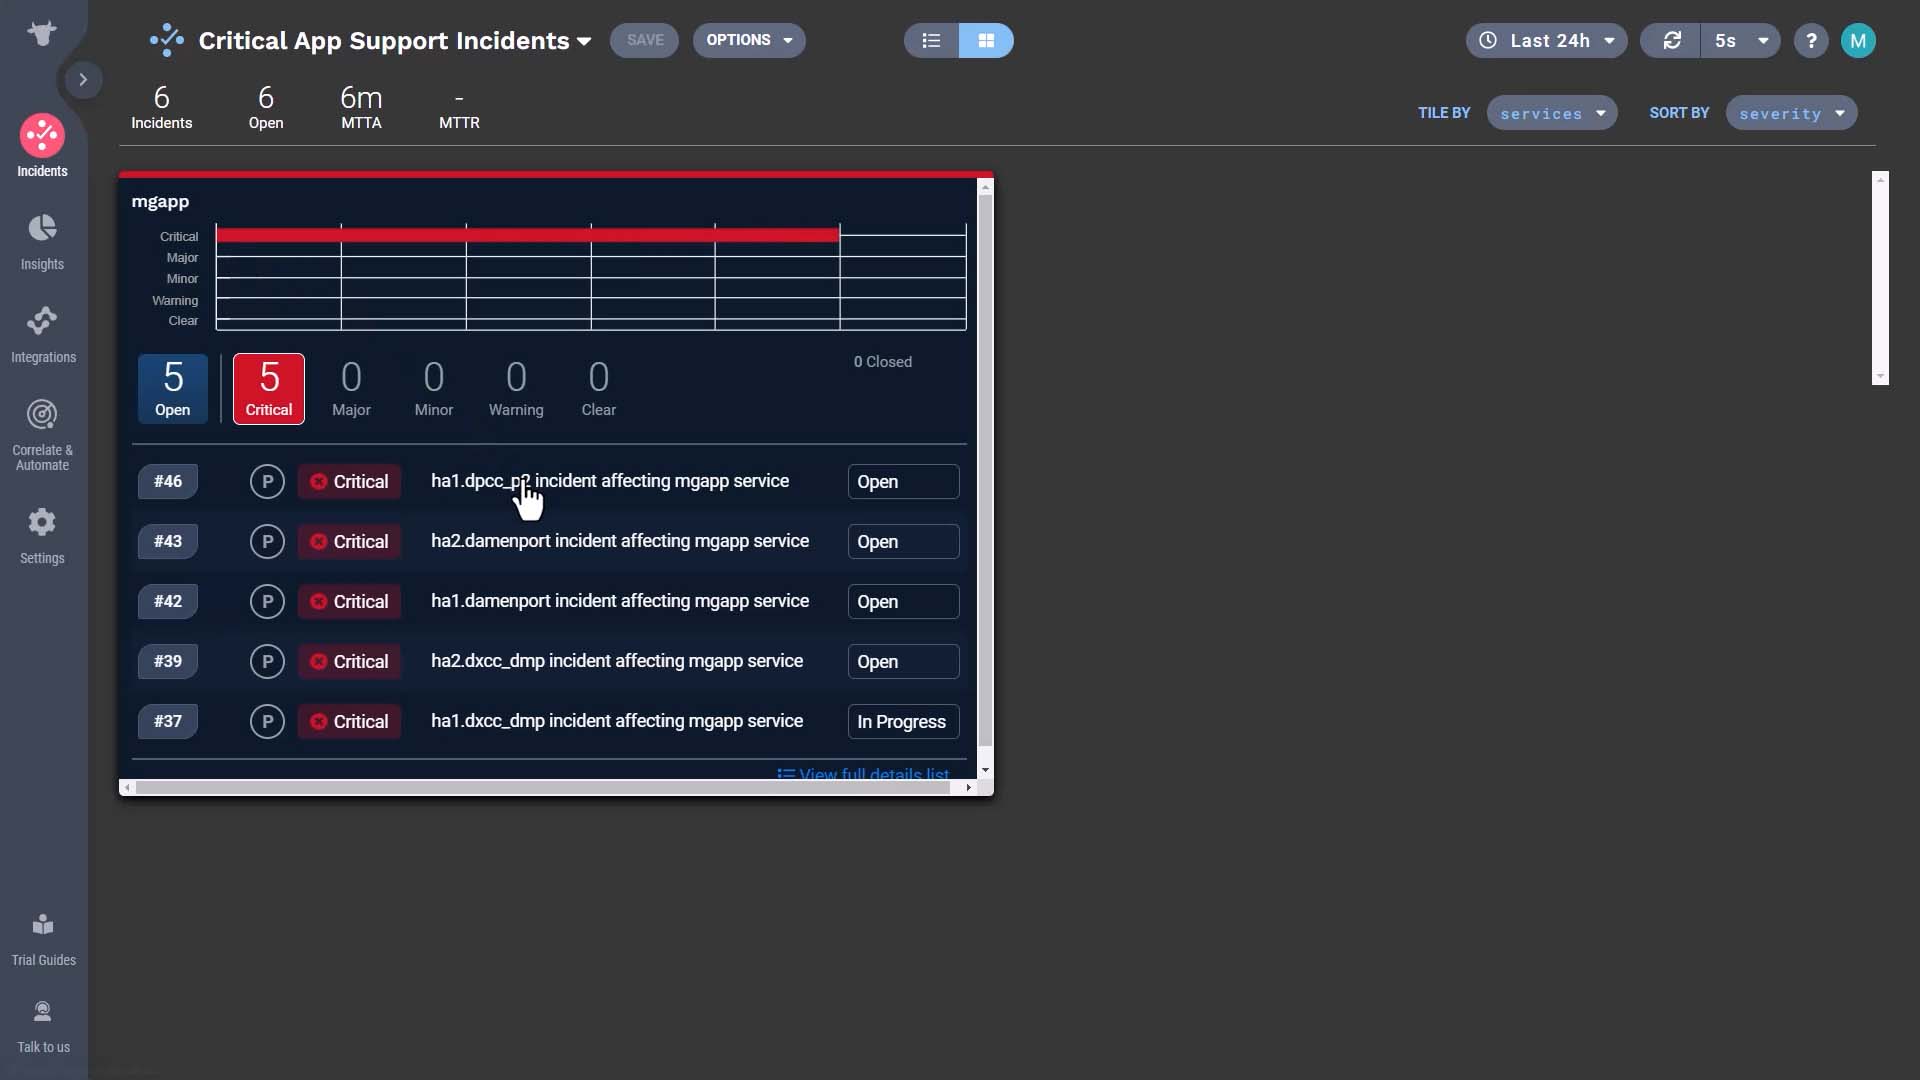
It presents data in a more visual manner, but you can also jump into a specific incident.
Now you know how to work with your incident queue. Thanks for watching!
BASIC | 2 MIN
In this video, you will learn how to create dashboards and share them in APEX AIOps Incident Management.
Use case walkthrough: Dashboards in APEX AIOps Incident Management ►
This video provides a use case walkthrough for using dashboards to easily view the performance of your teams and services in APEX AIOps Incident Management.
*Please note Moogsoft is now part of Dell's IT Operations solution called APEX AIOps, and changed its name to APEX AIOps Incident Management. The UI in this video may differ slightly but the content covered is still relevant.
You can now create dashboards to view the team’s performance at a glance.
The incident list is useful for operations staff.
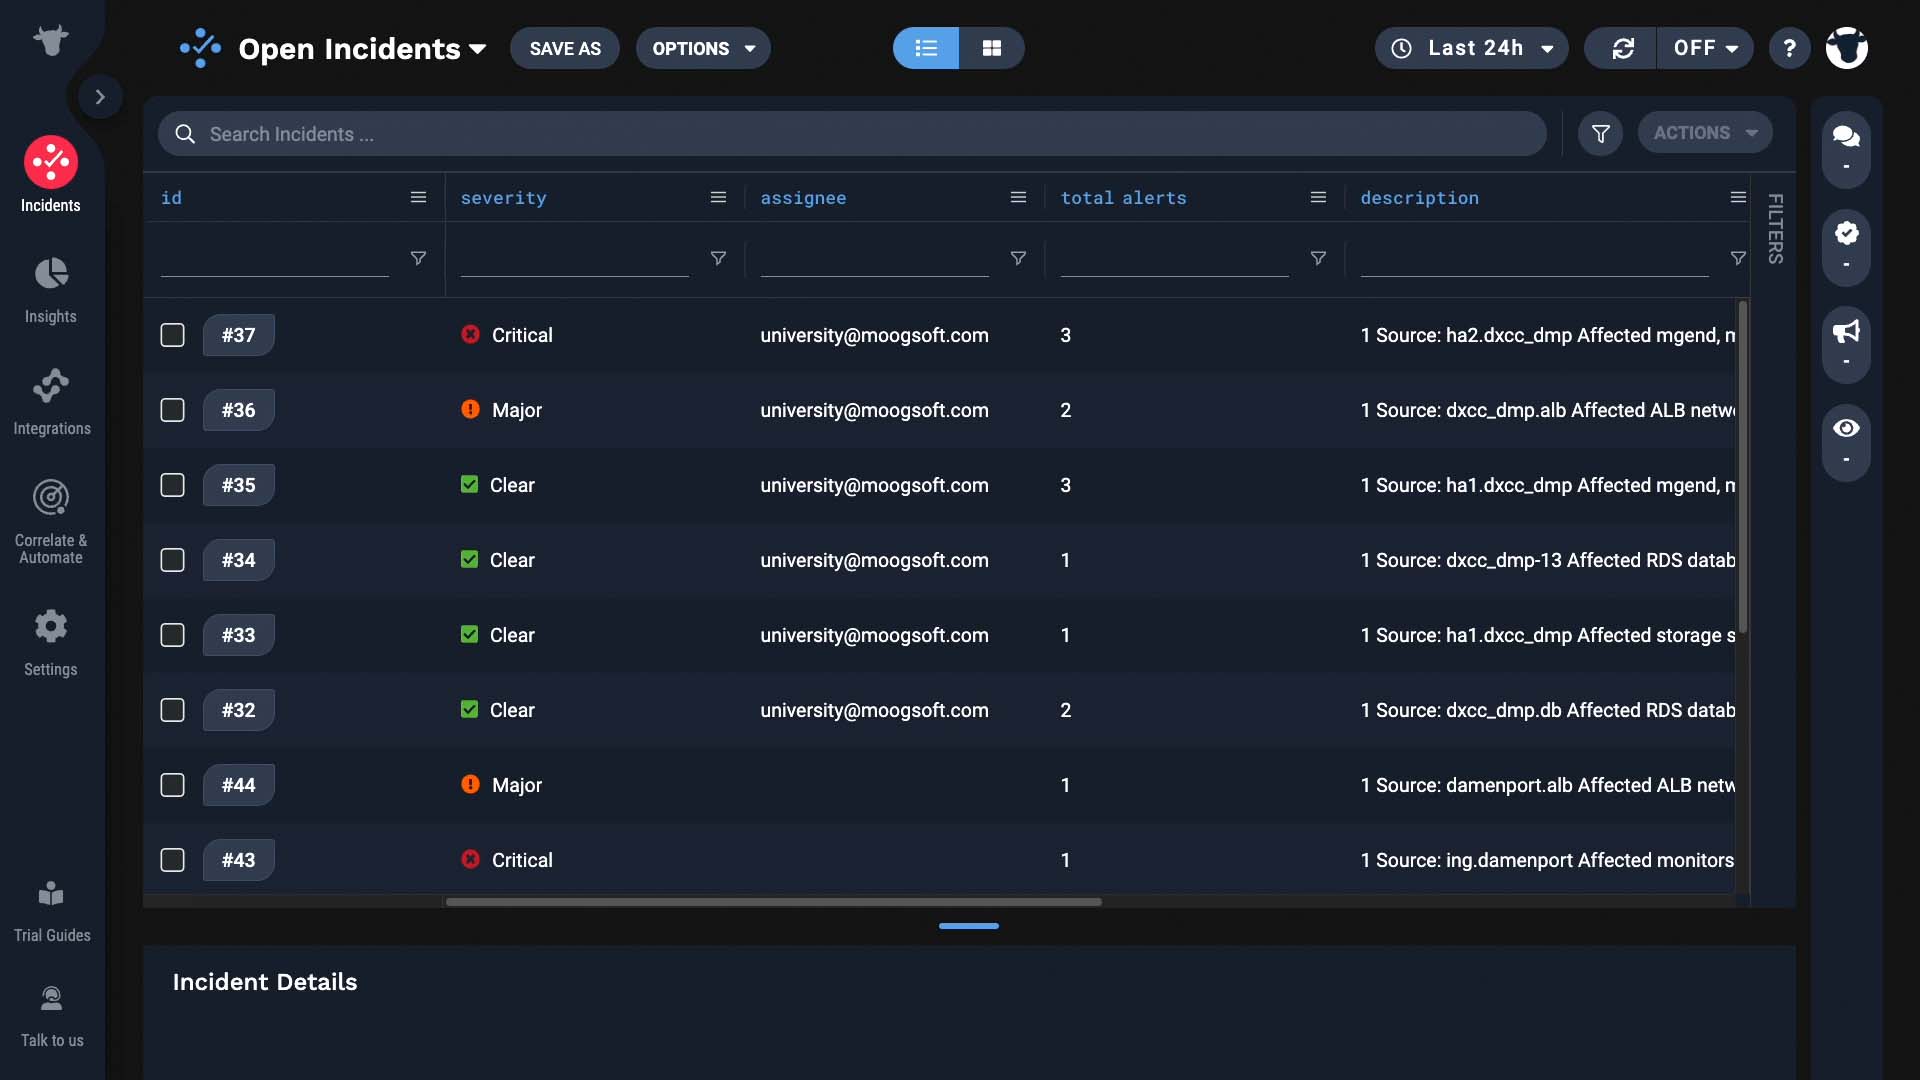
But as a manager you may need something to show how your teams or services are doing at a glance. The dashboard views are perfect for that. Here are the overall stats.
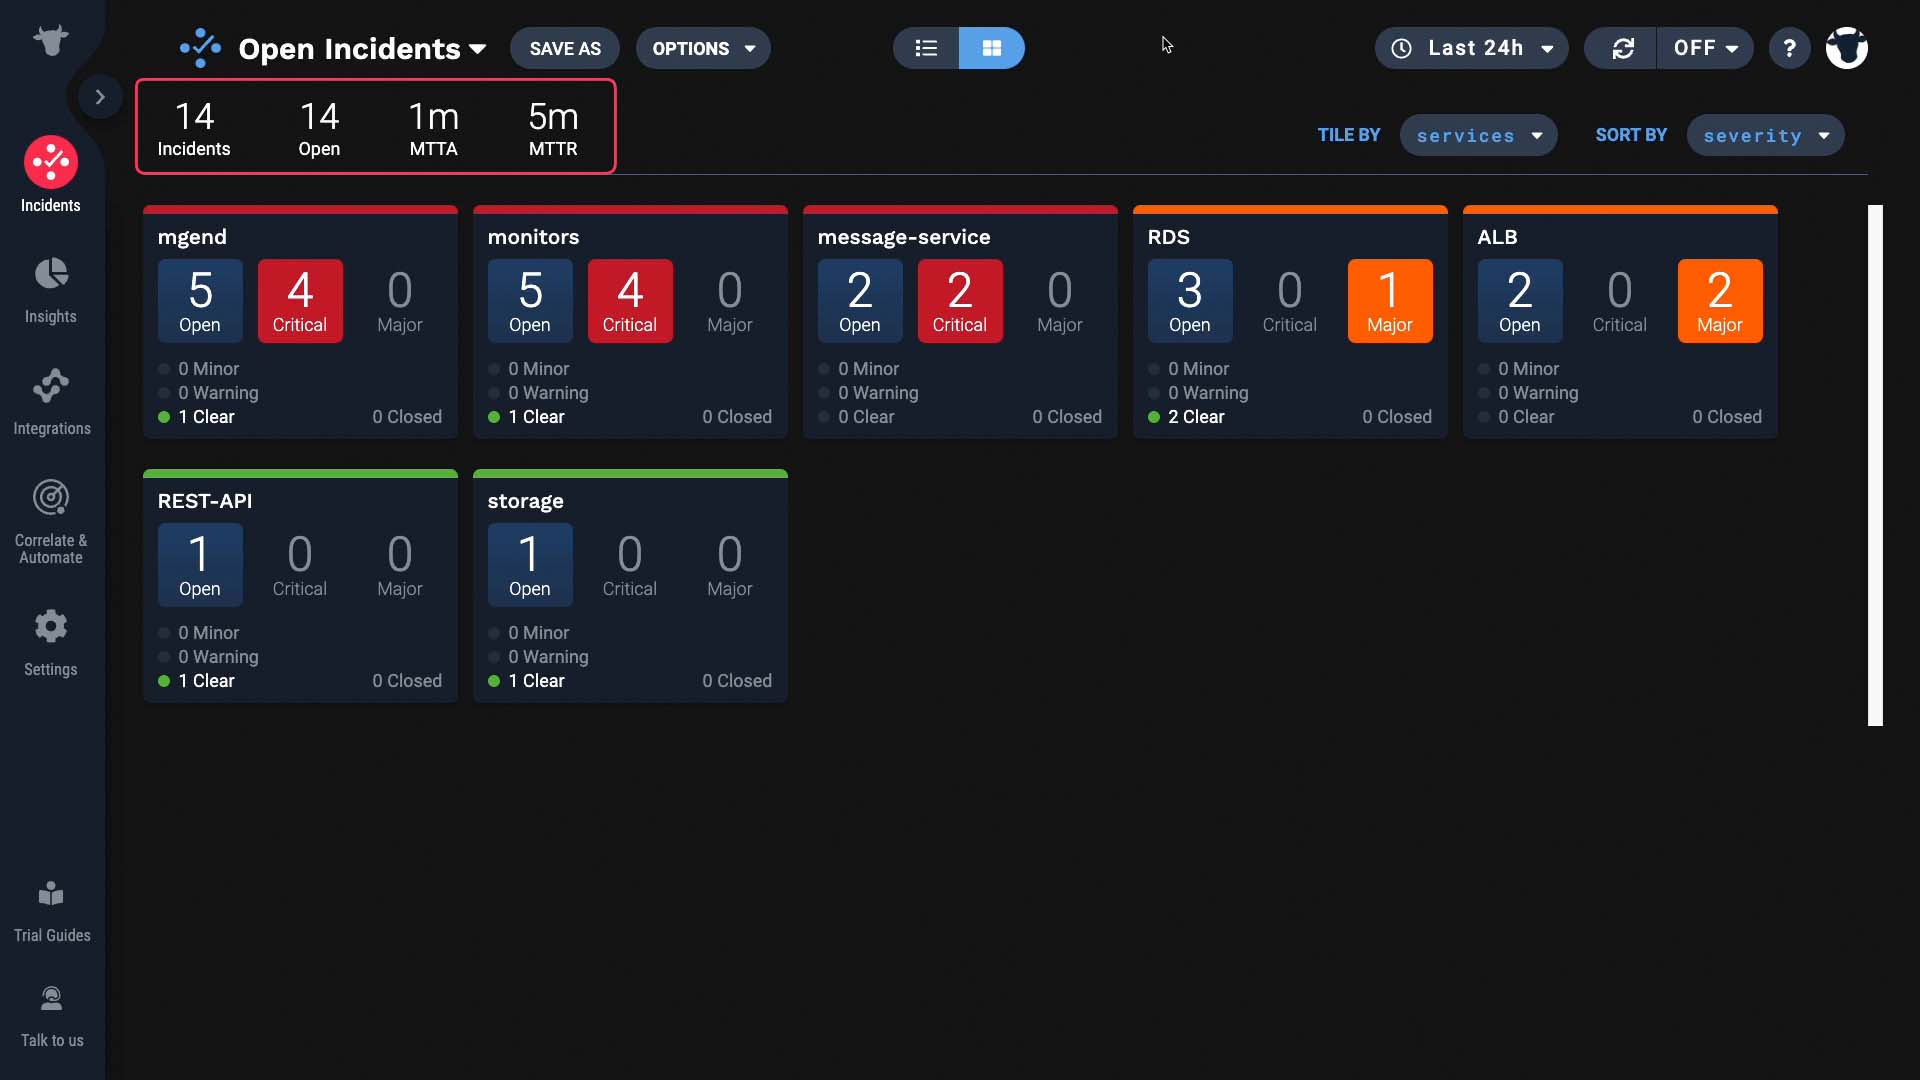
Right now it’s tiled by service, but now it’s categorized by type.
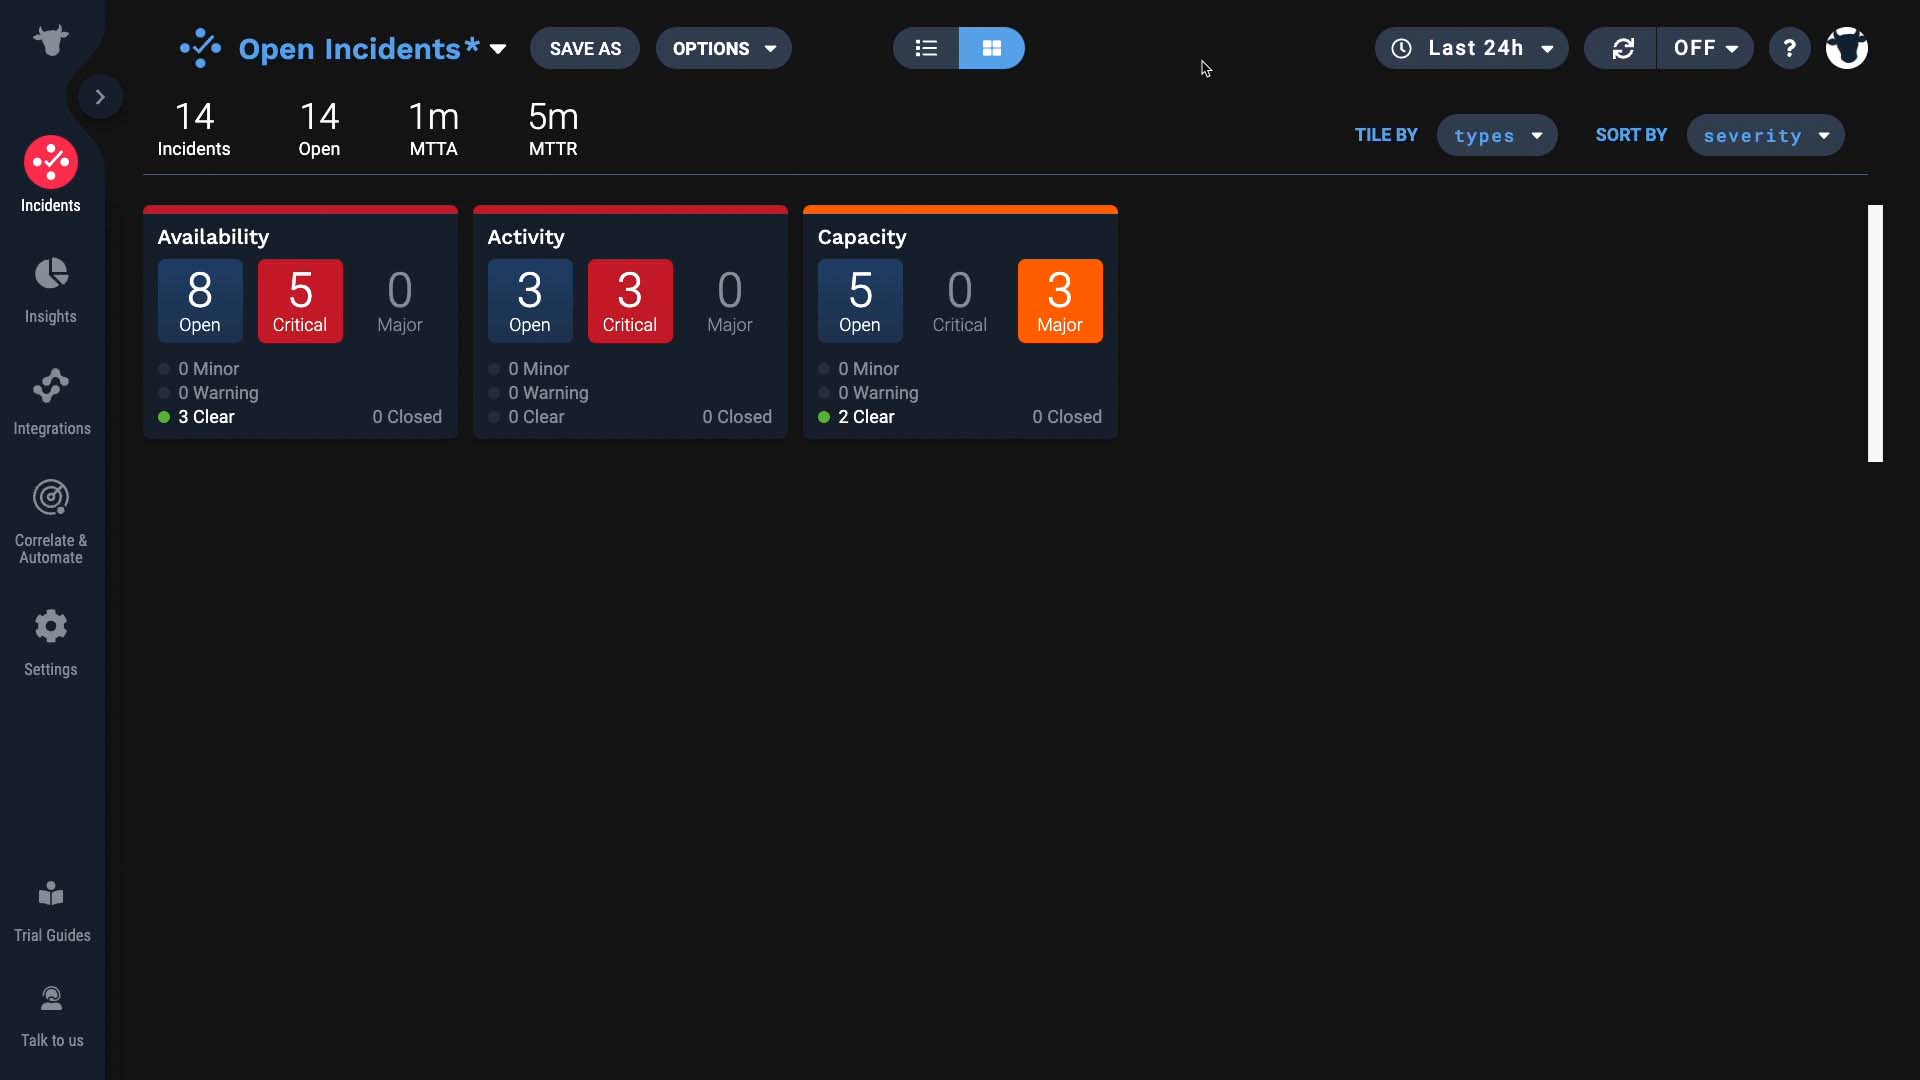
Or classes. You can slice and dice the overall category to suit your needs.
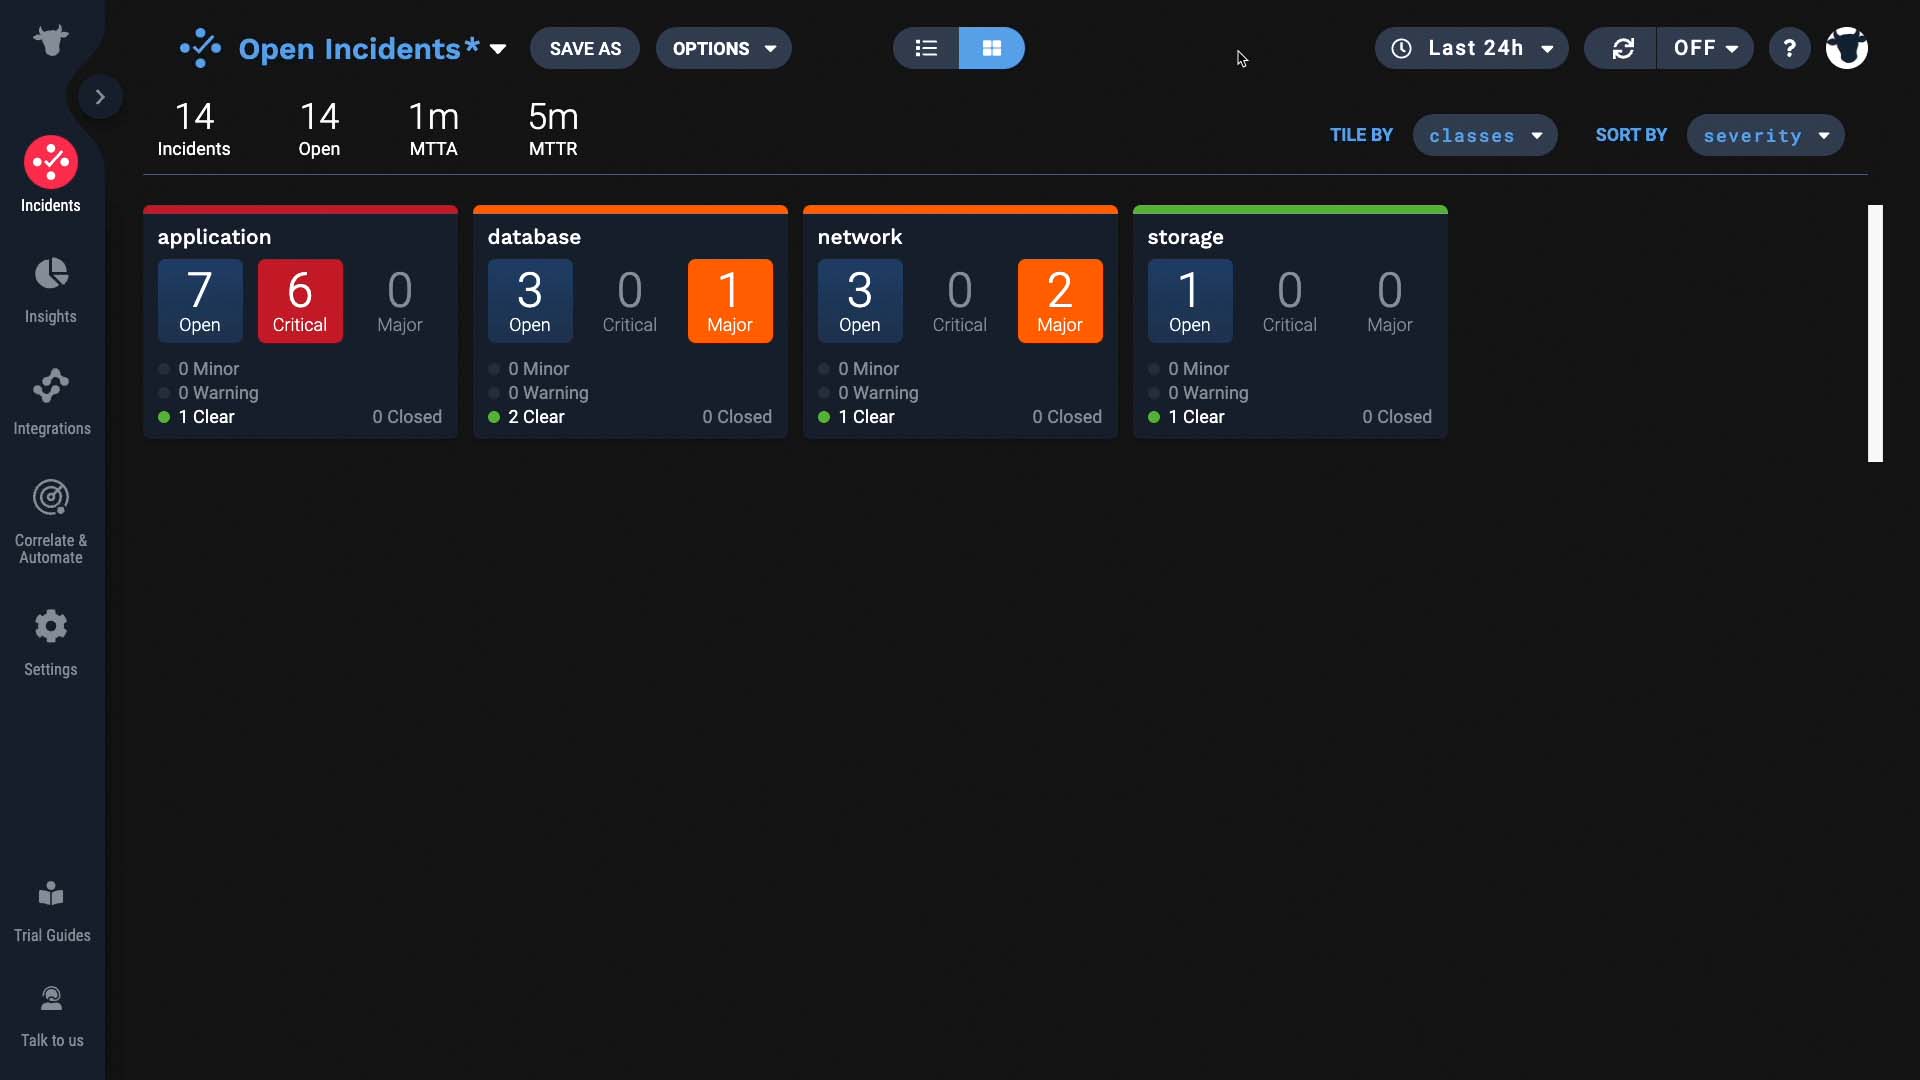
You can narrow down the list like this.
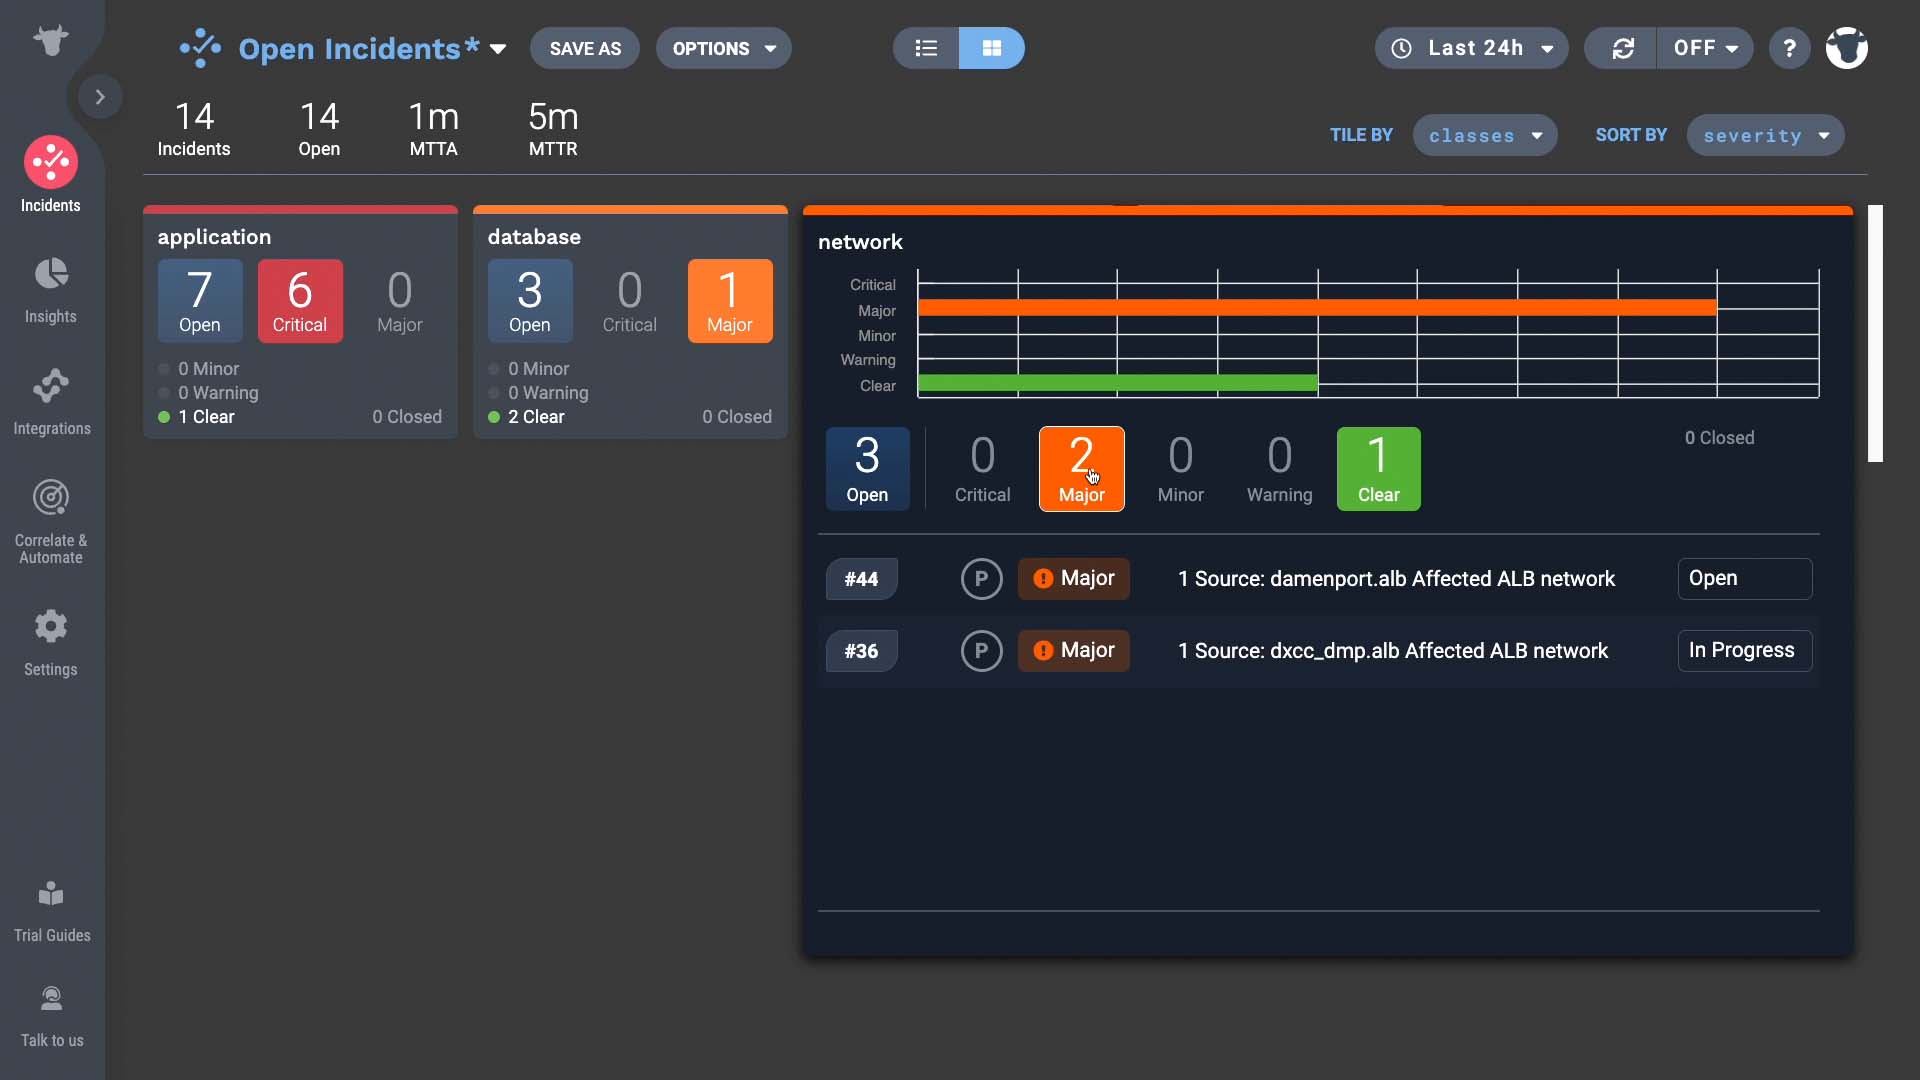
So if I wanted to learn more about critical application incidents it’s easy to do so. And, of course, go right into the Situation Room from here to start troubleshooting an incident.
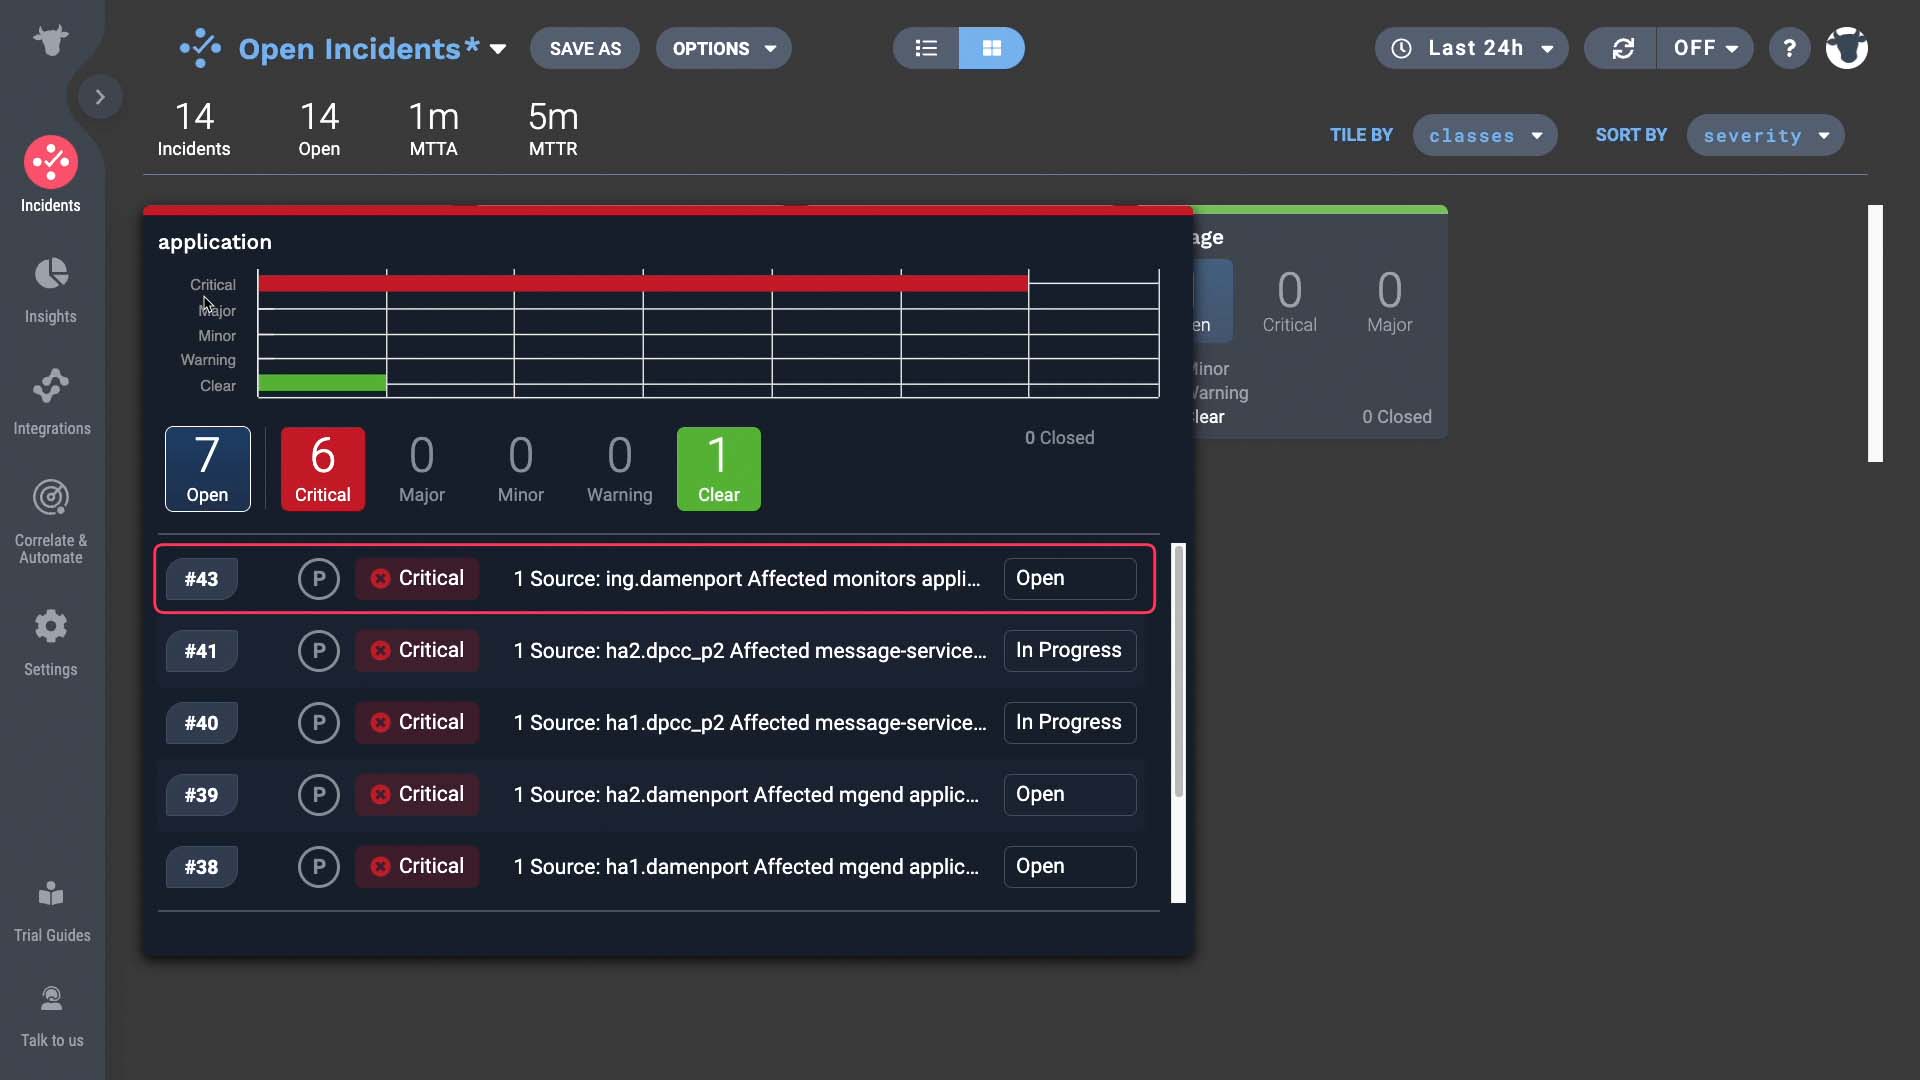
Once you get the exact data you are looking for, you can save that dashboard.
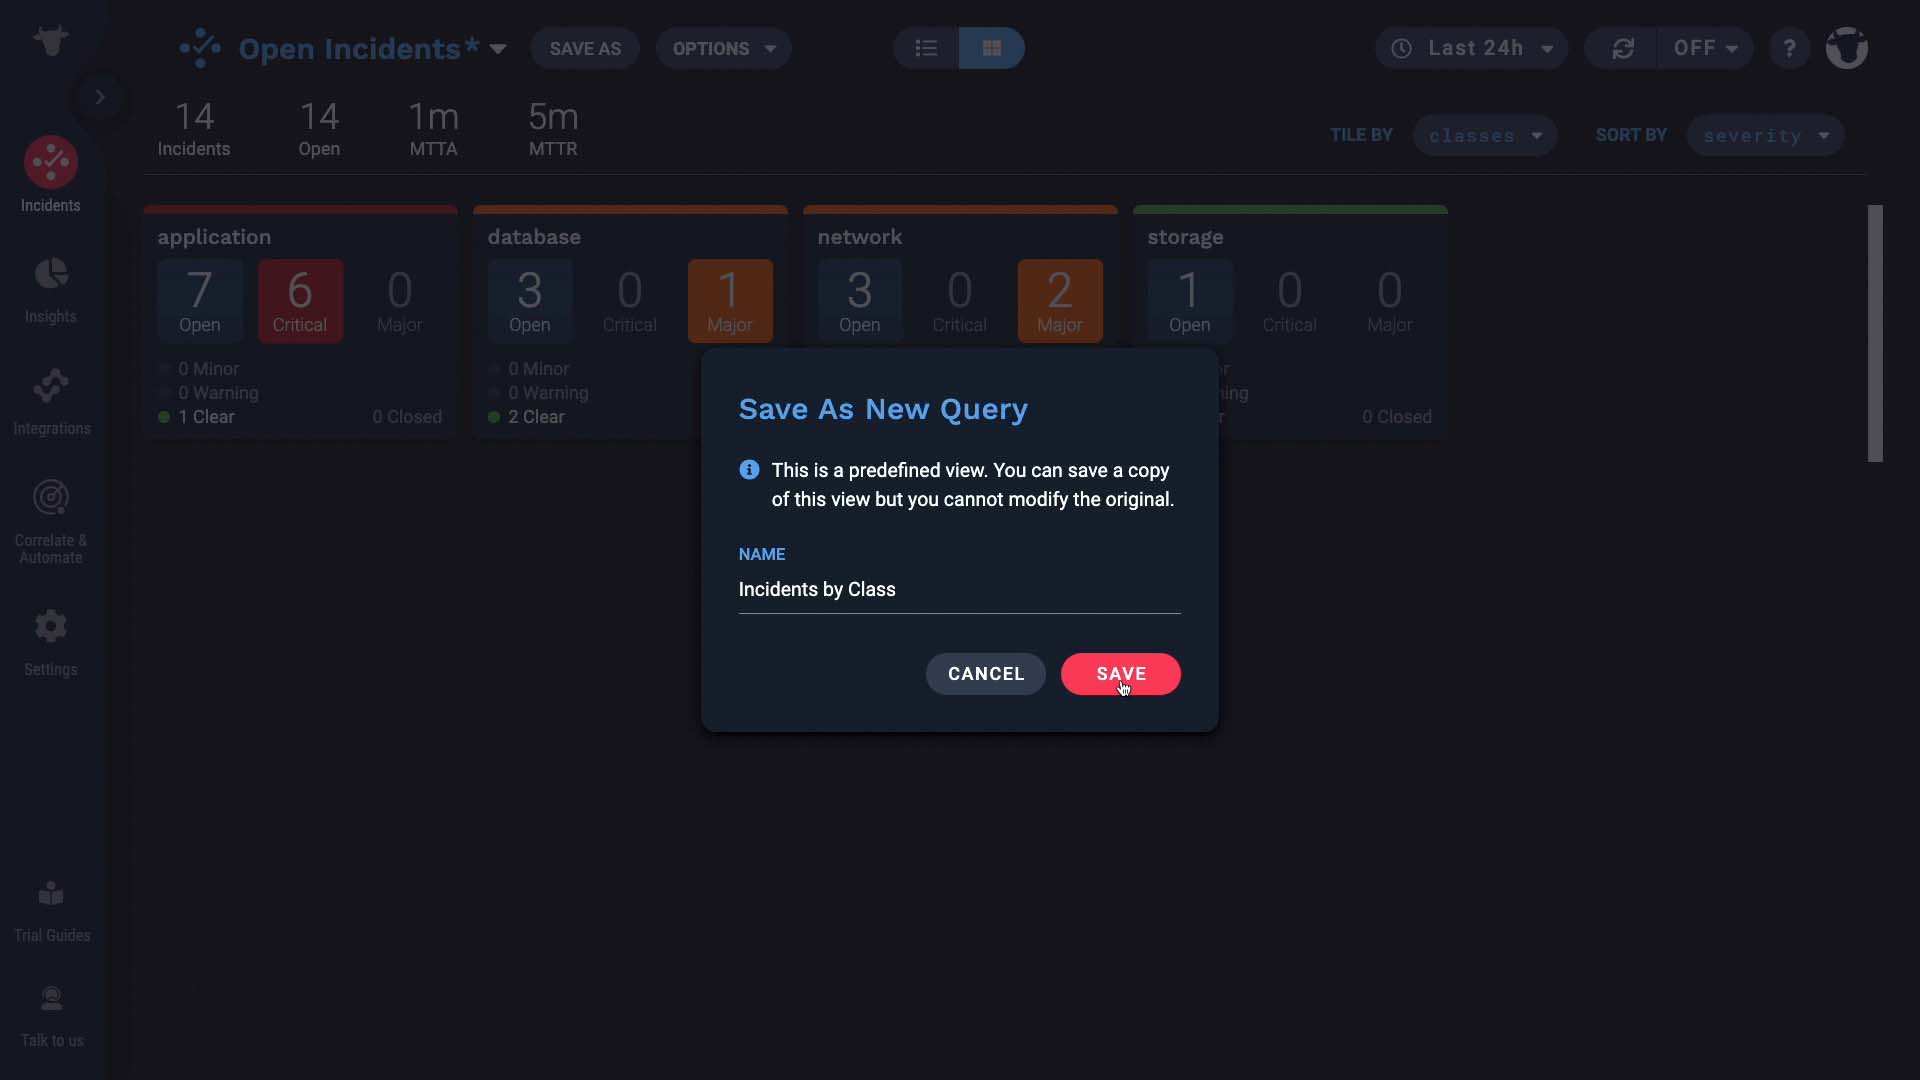
Now you have one-click access to the team’s stats!
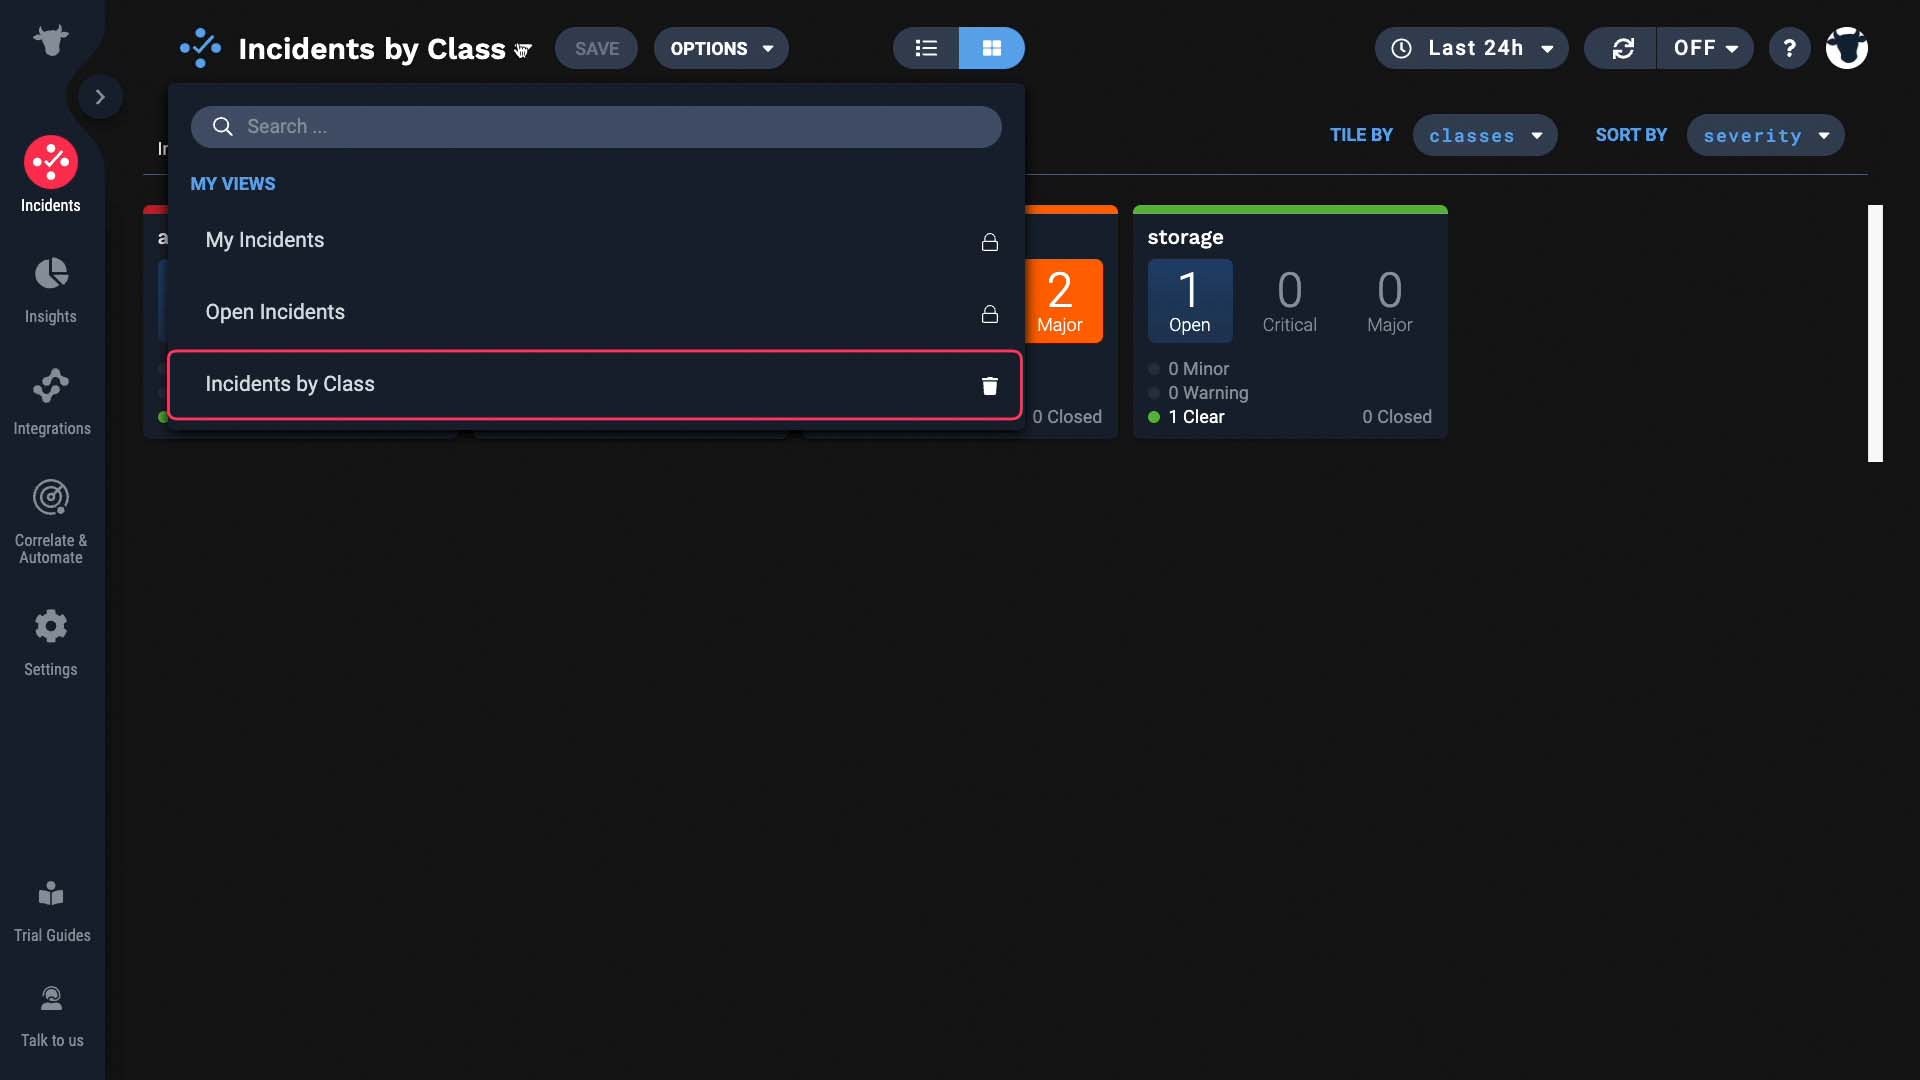
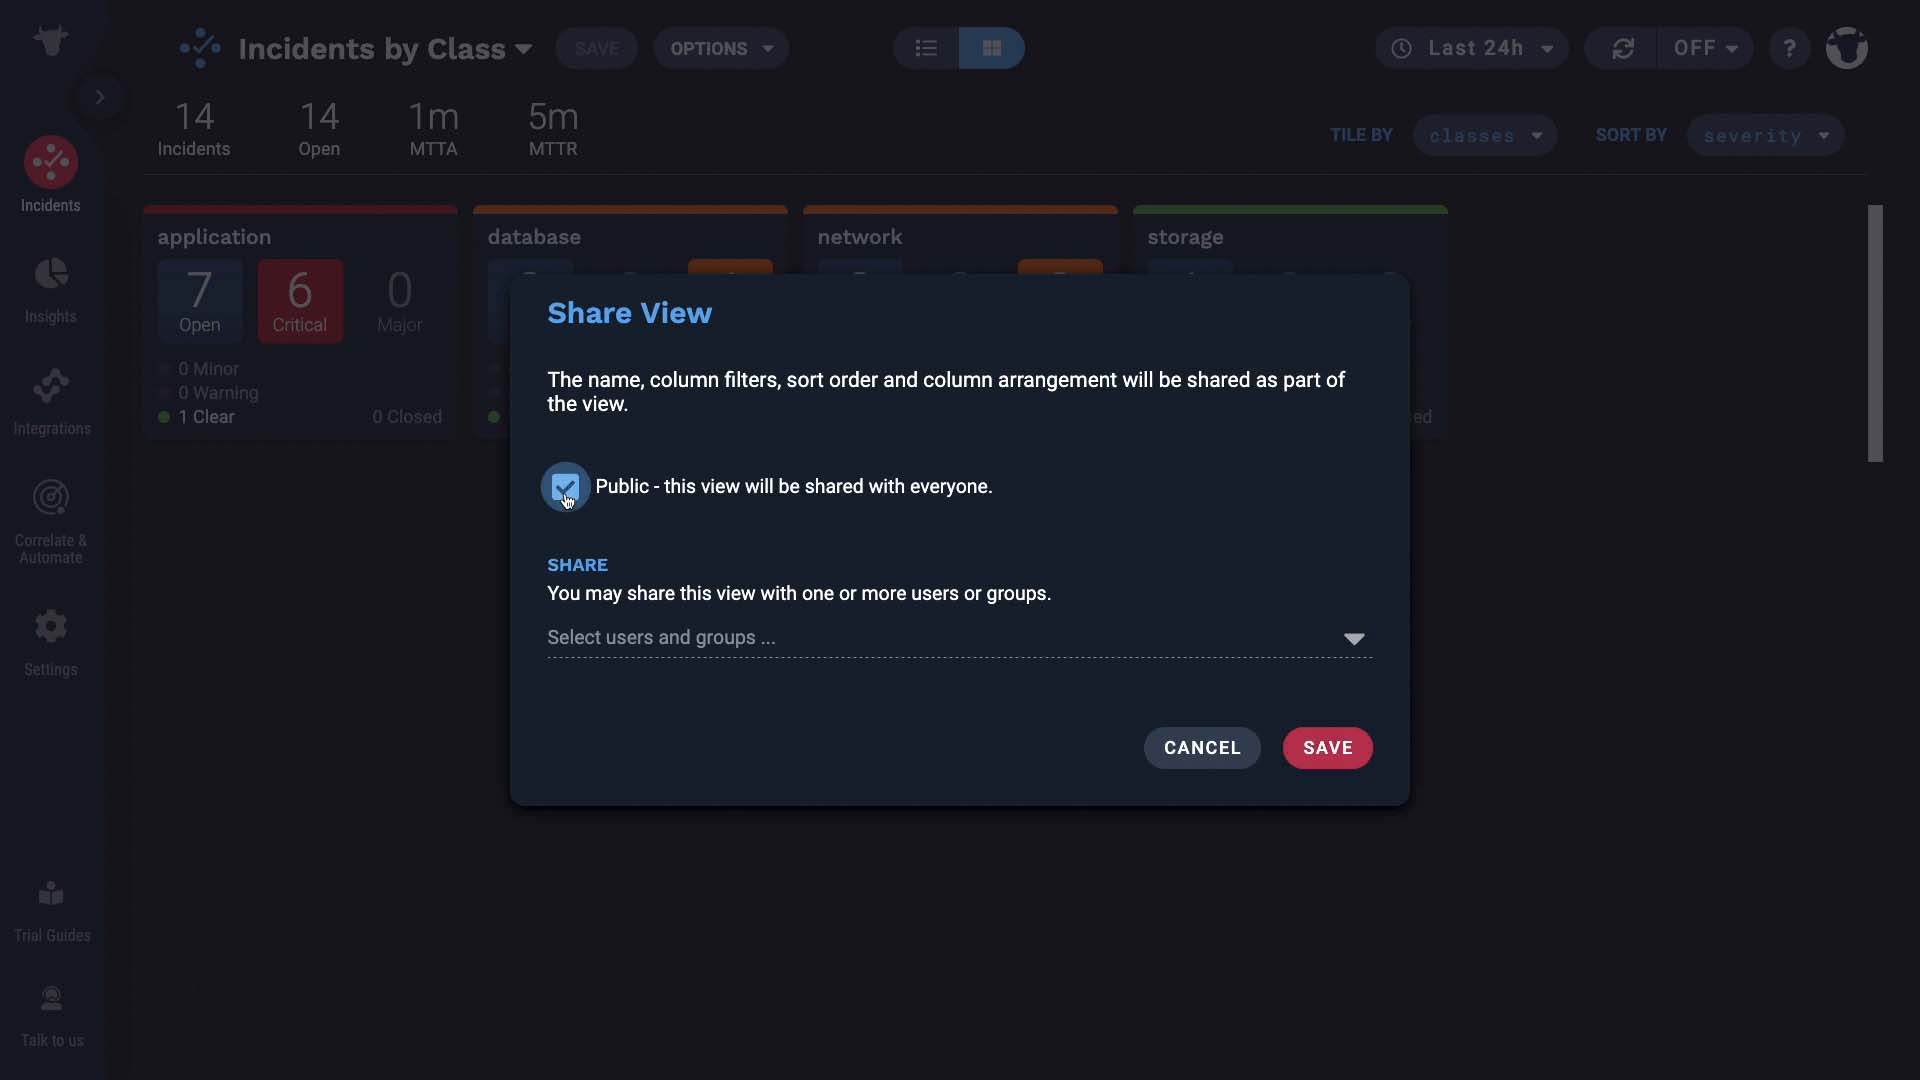
And the saved dashboards can be shared with specific groups or with everyone.
Shared dashboards are accessible from here…
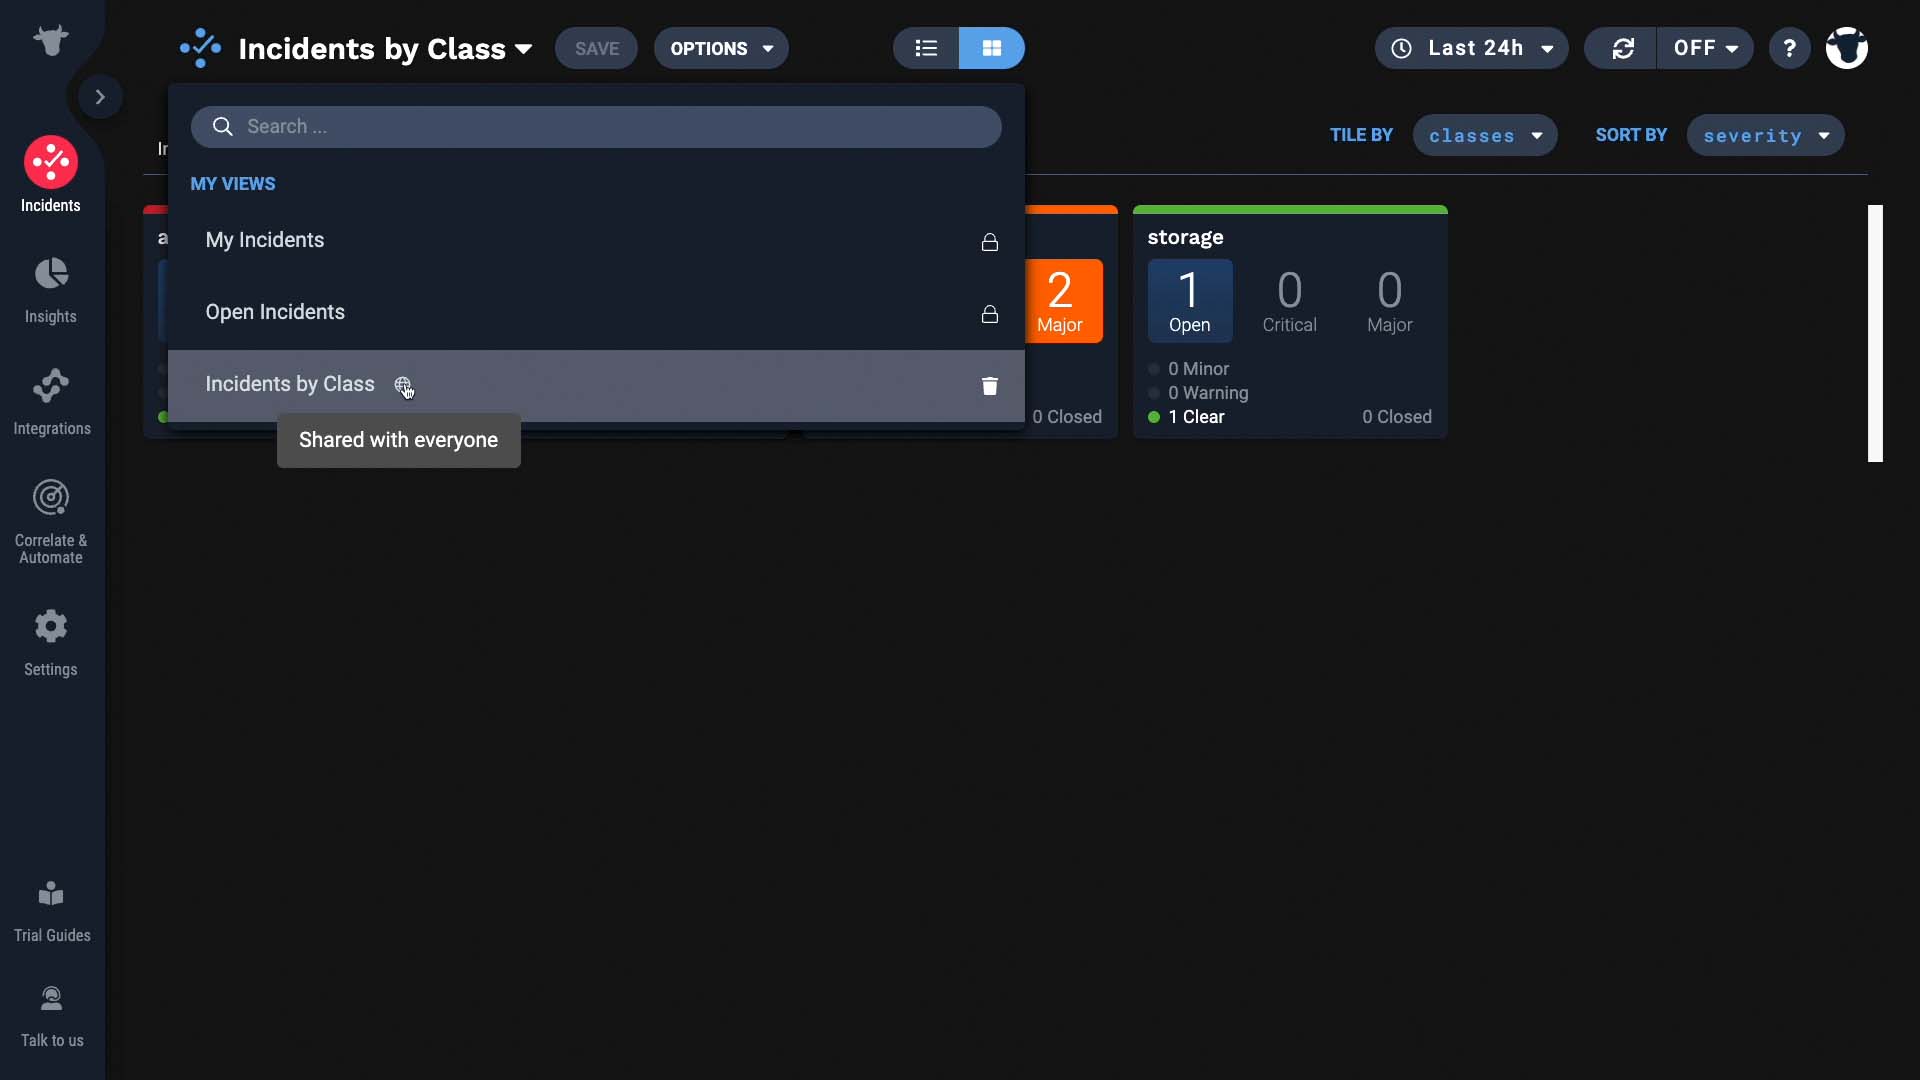
…and also from the Insight section.
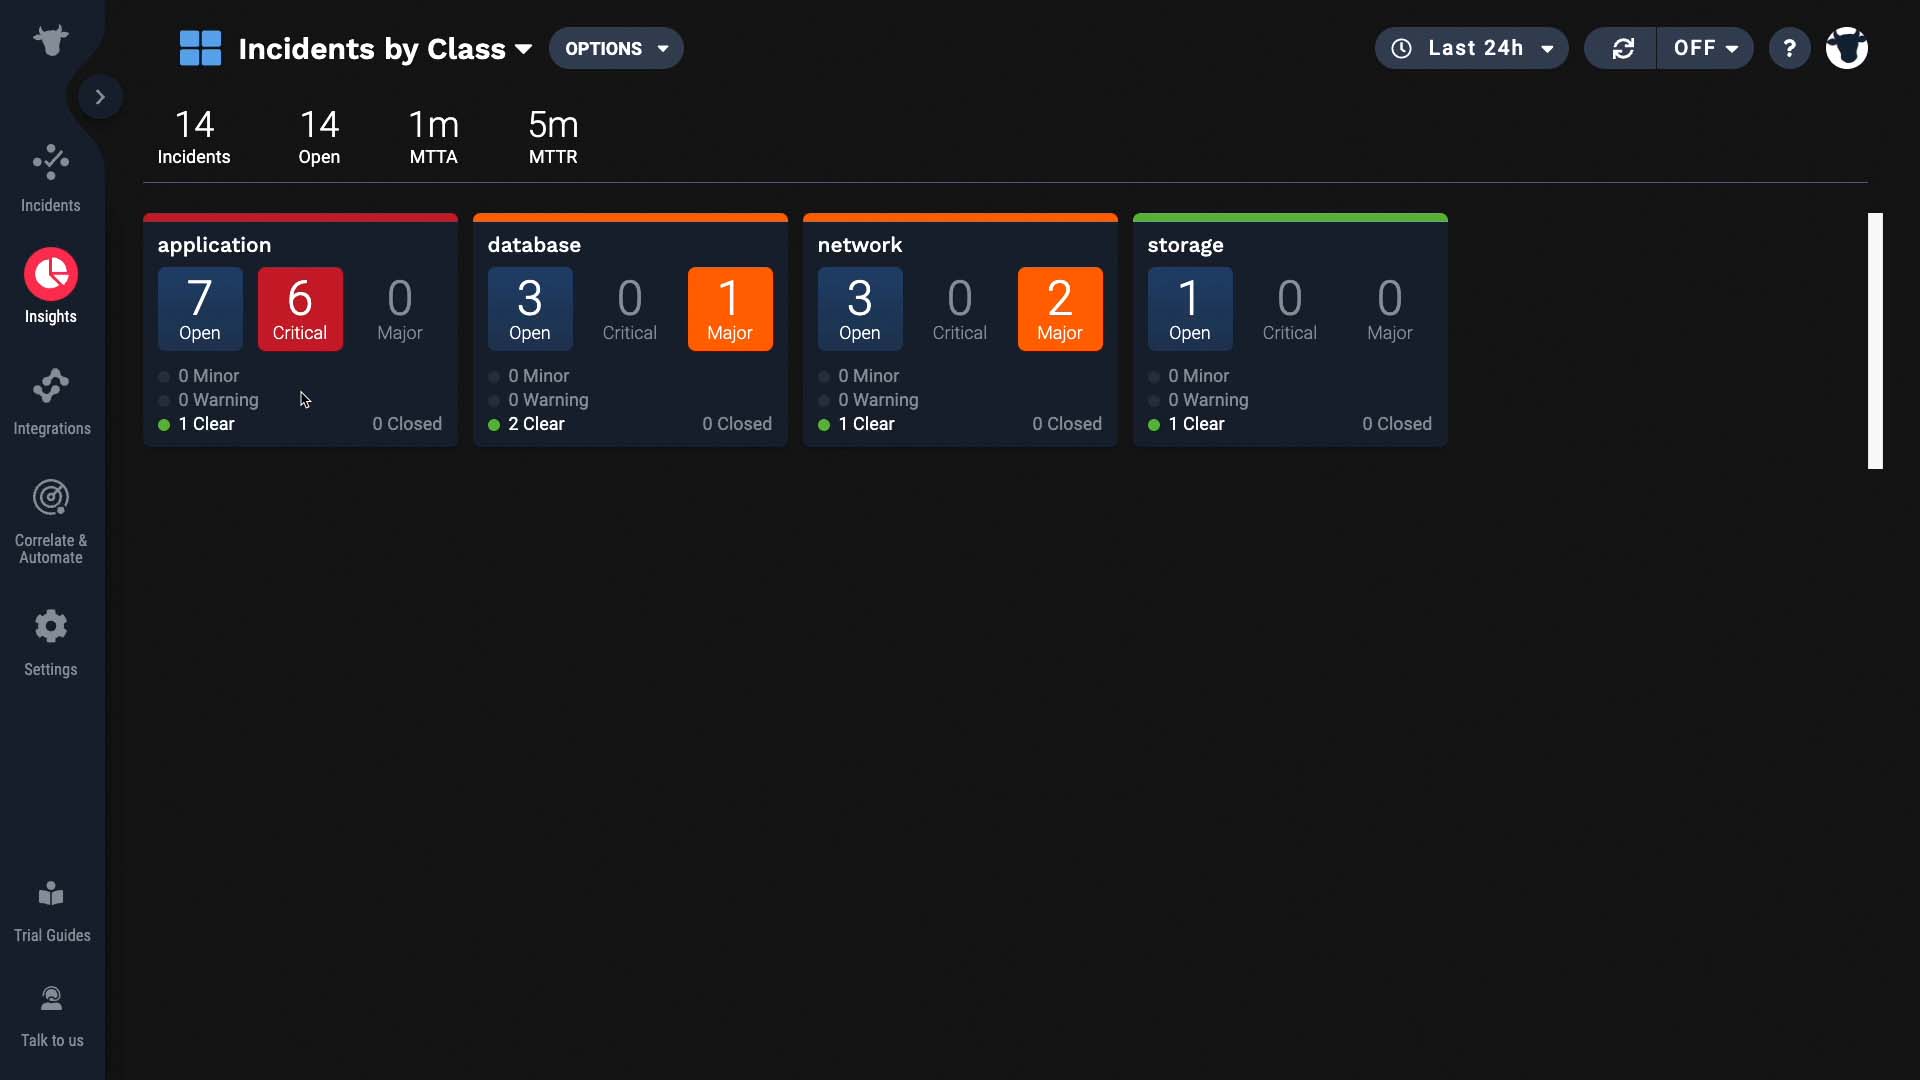
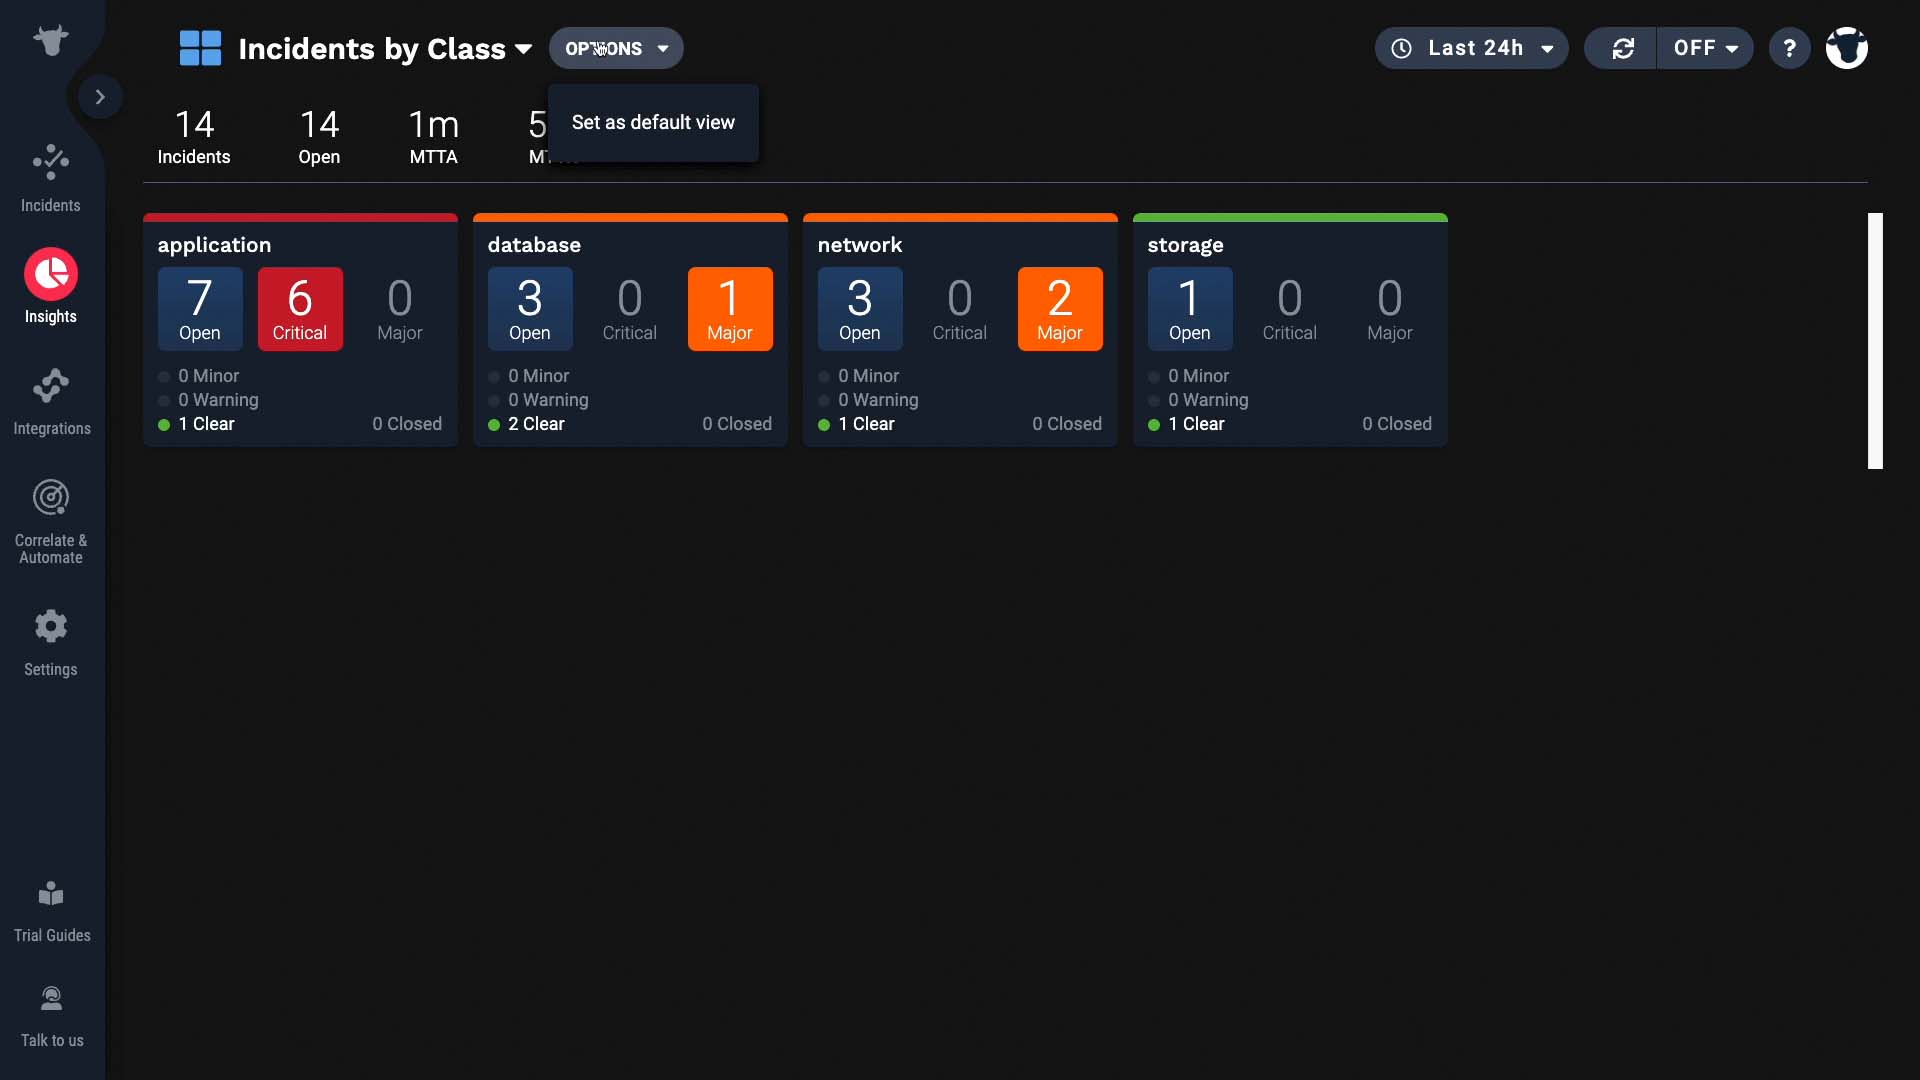
Now everyone can view this dashboard, and even set it as their default view! Thanks for watching!
BASIC | 3 MIN
In this video, we will showcase the power of the Situation Room.
Use case walkthrough: Tour of the Situation Room ►
This video provides an overview of the Incident Management Situation Room and its features, which include the comments and recommendations tabs.
*Please note Moogsoft is now part of Dell's IT Operations solution called APEX AIOps, and changed its name to APEX AIOps Incident Management. The UI in this video may differ slightly but the content covered is still relevant.
In this video we’ll showcase the power of the Situation Room in Incident Management.
Here’s a critical incident happening…let’s take ownership of it and investigate.
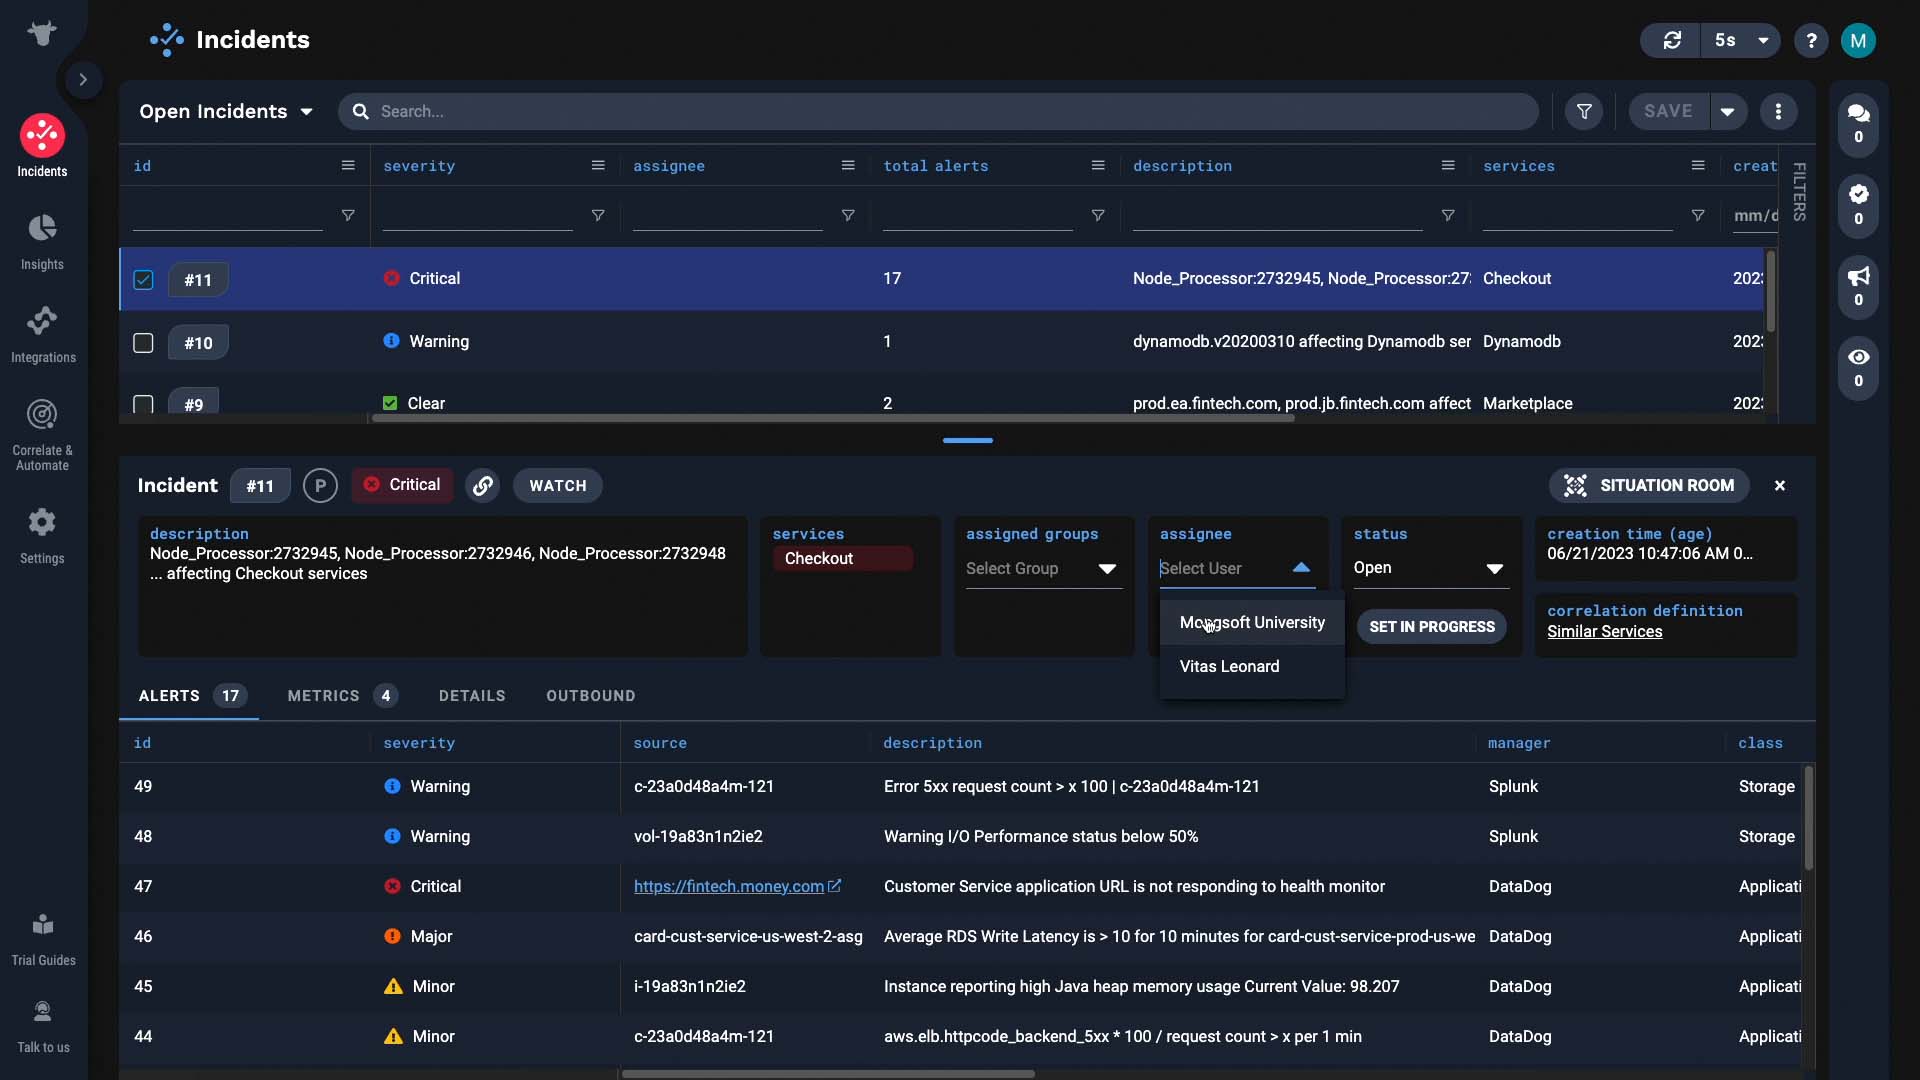
There is a lot going on–several Java Virtual Machines have crashed, and we’re seeing I/O and database problems.
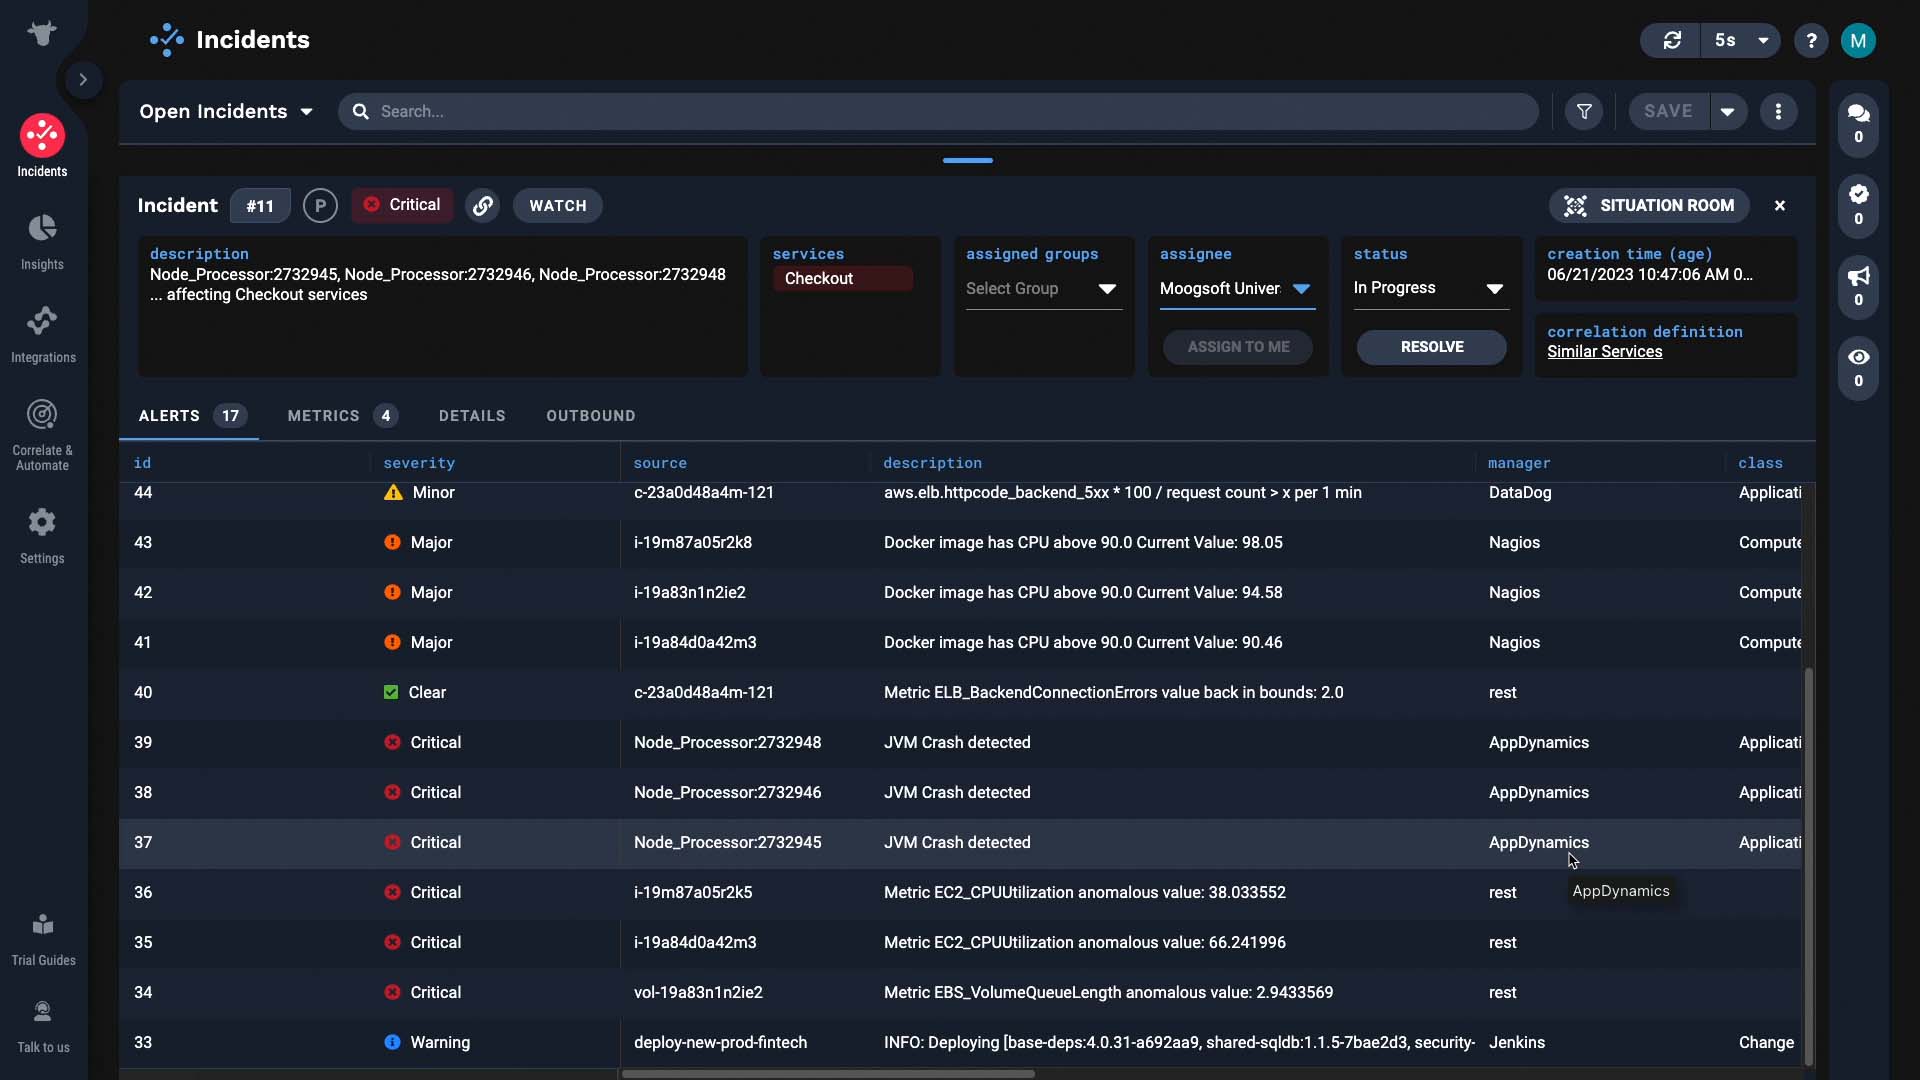
We’ll go to the Situation Room for this incident.
The Situation Room is a virtual collaboration space in Incident Management. It is designed to facilitate collaboration and drive incidents to resolution. Let me show you how it helps our investigation.
It has the same tools and information as the incident details page, but now the entire screen space is dedicated to resolving this one incident. You see the description of the incident, impacted services, and which correlation definition was applied to group the member alerts,
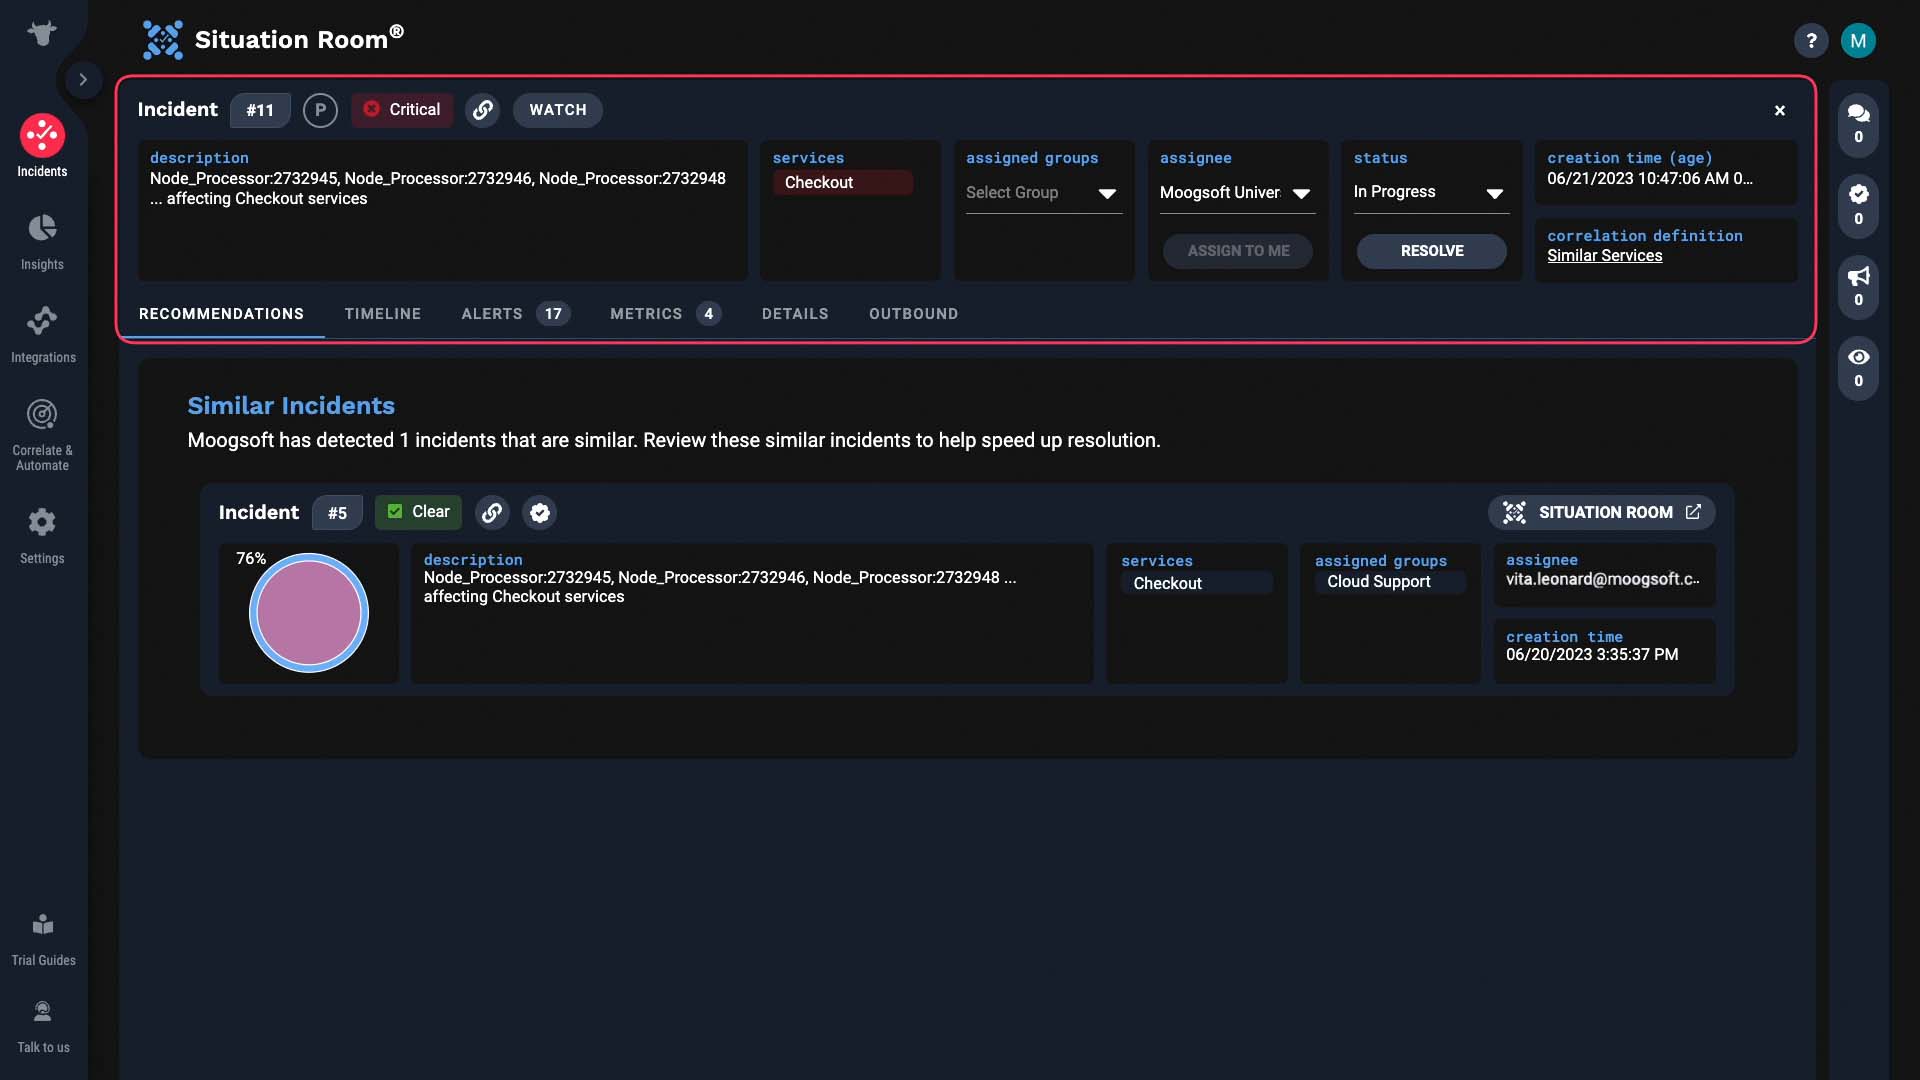
But there are a few things that make the Situation Room special.
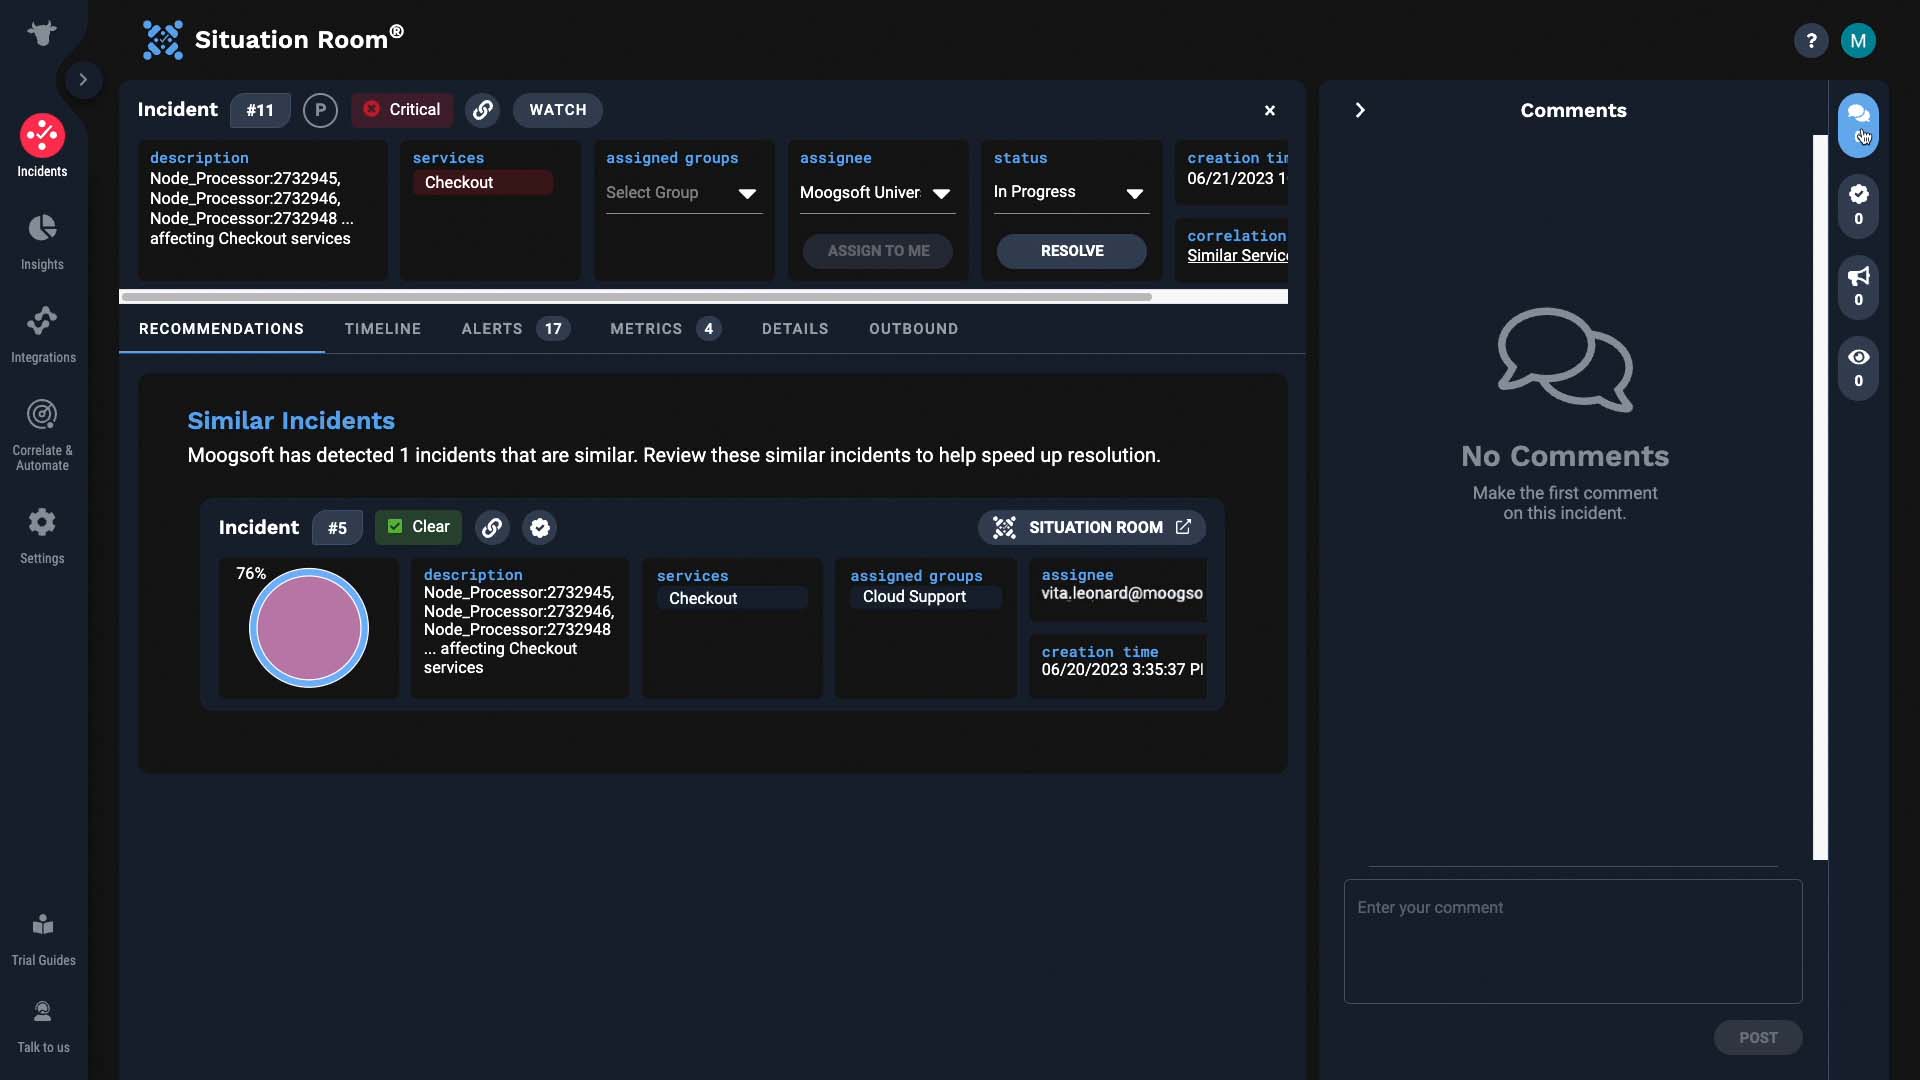
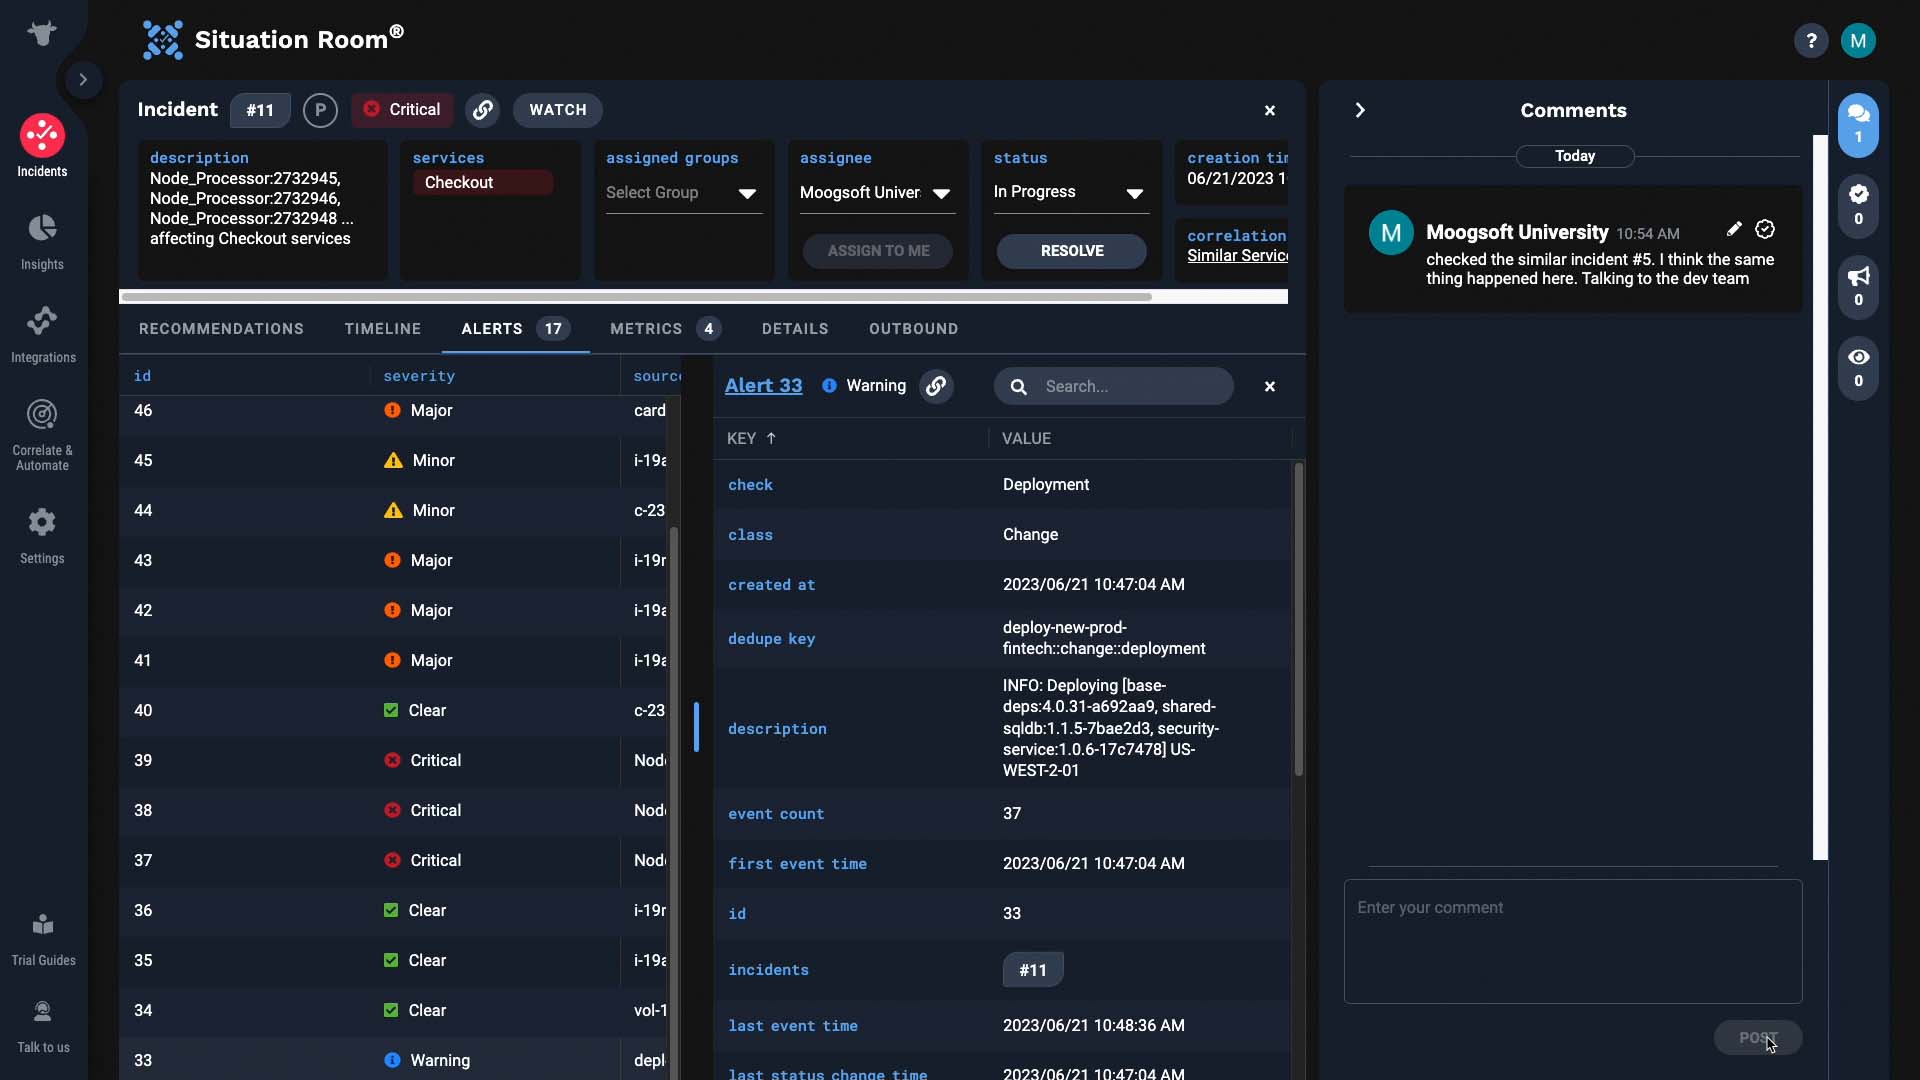
First, here is the comments tab. The team can chat as they work through the incident.
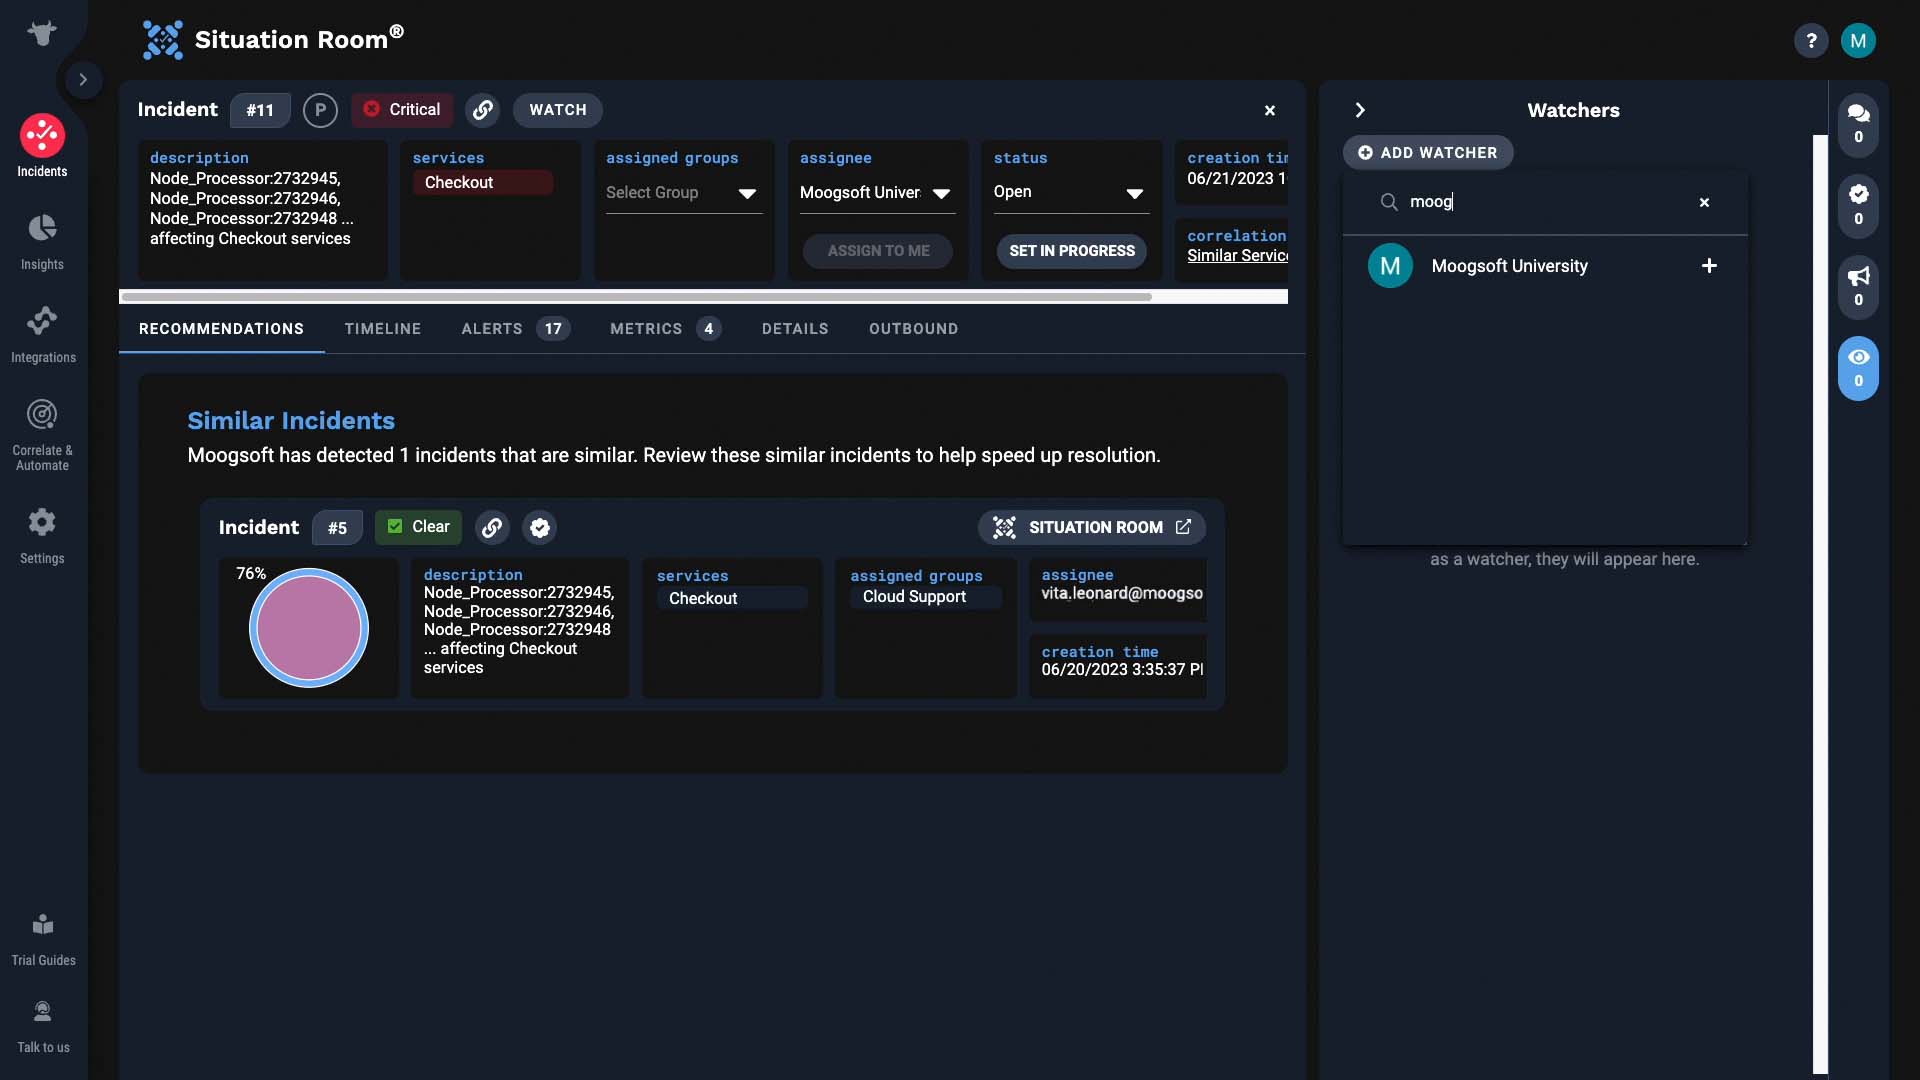
Or maybe you just want to monitor the progress of this incident. Then you can add yourself, or a stakeholder as a watcher. You will receive an email when there are any announcements.
Next, the recommendations tab is a great resource. Incident Management checks if there are incidents similar to the one at hand. And if there are, it will surface them for you to reference.
In this case, we have one similar incident.
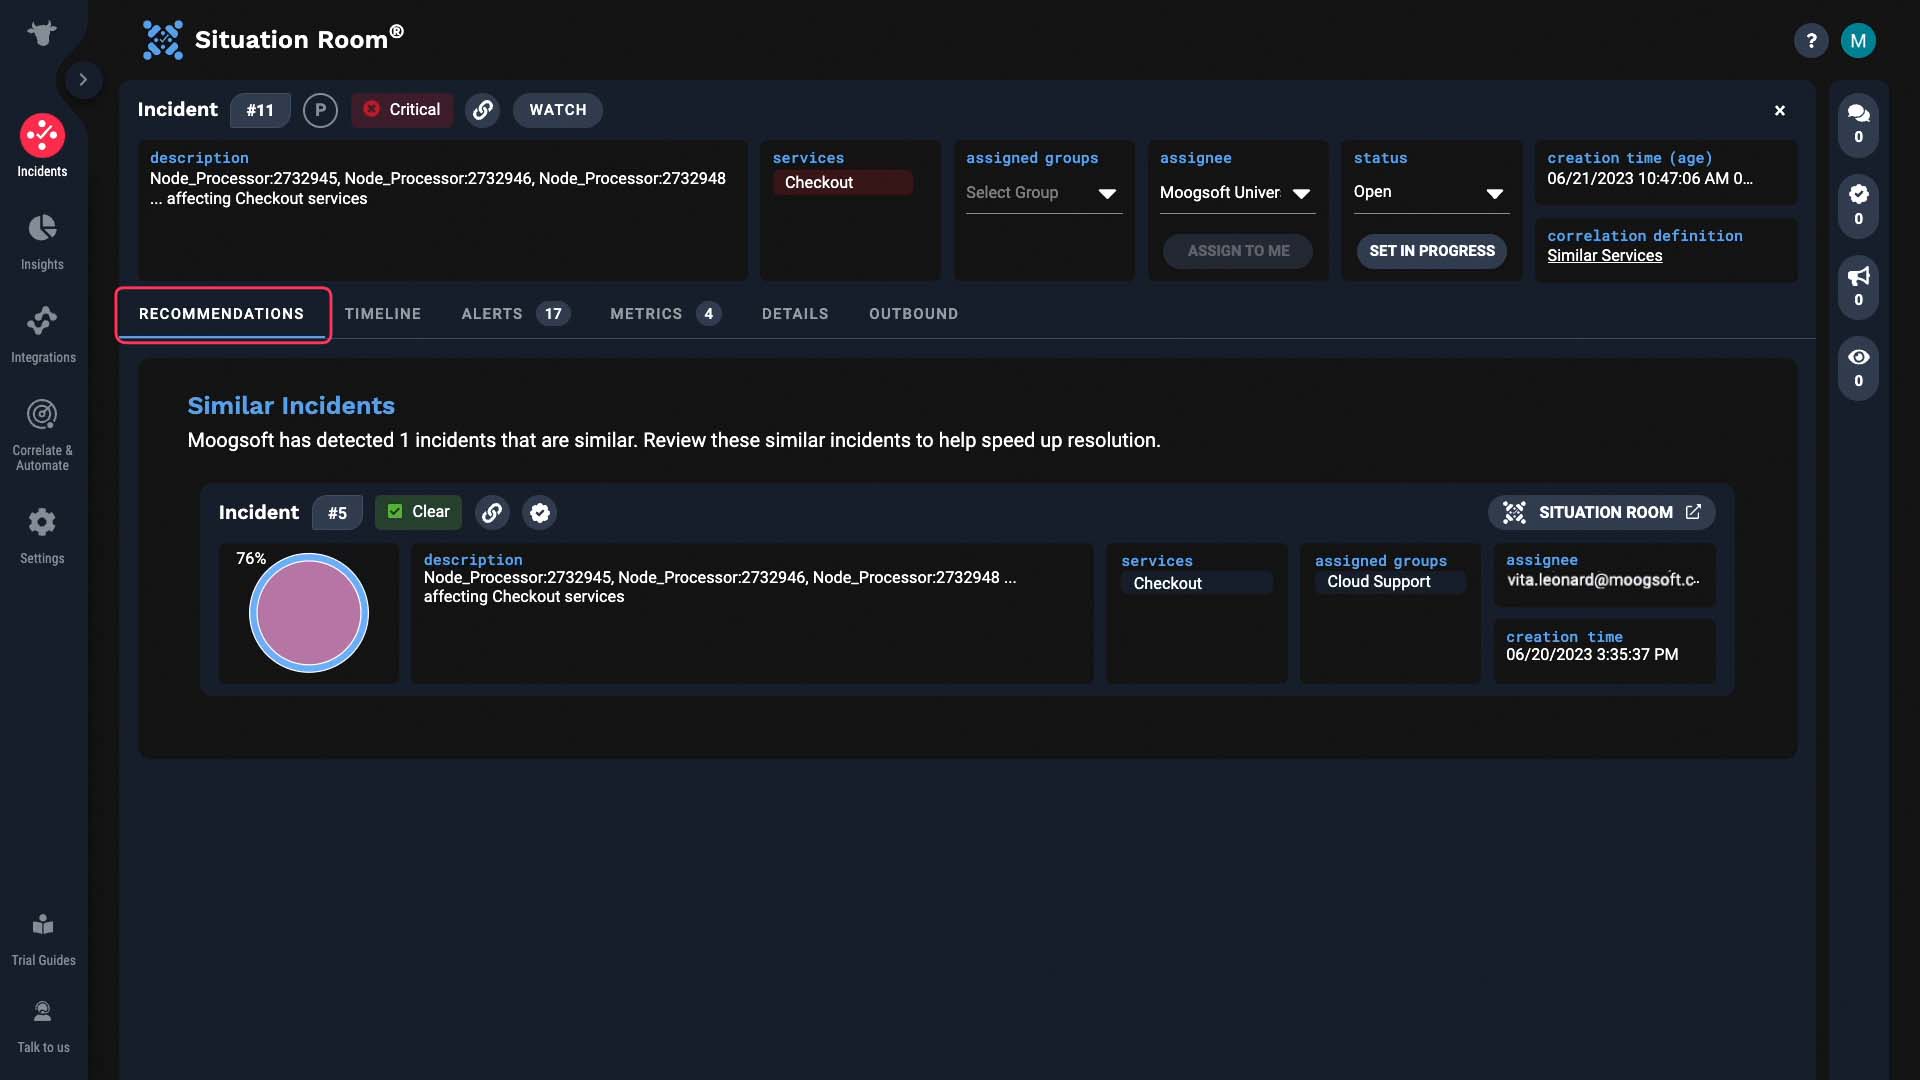
This one is 76% similar to our incident.
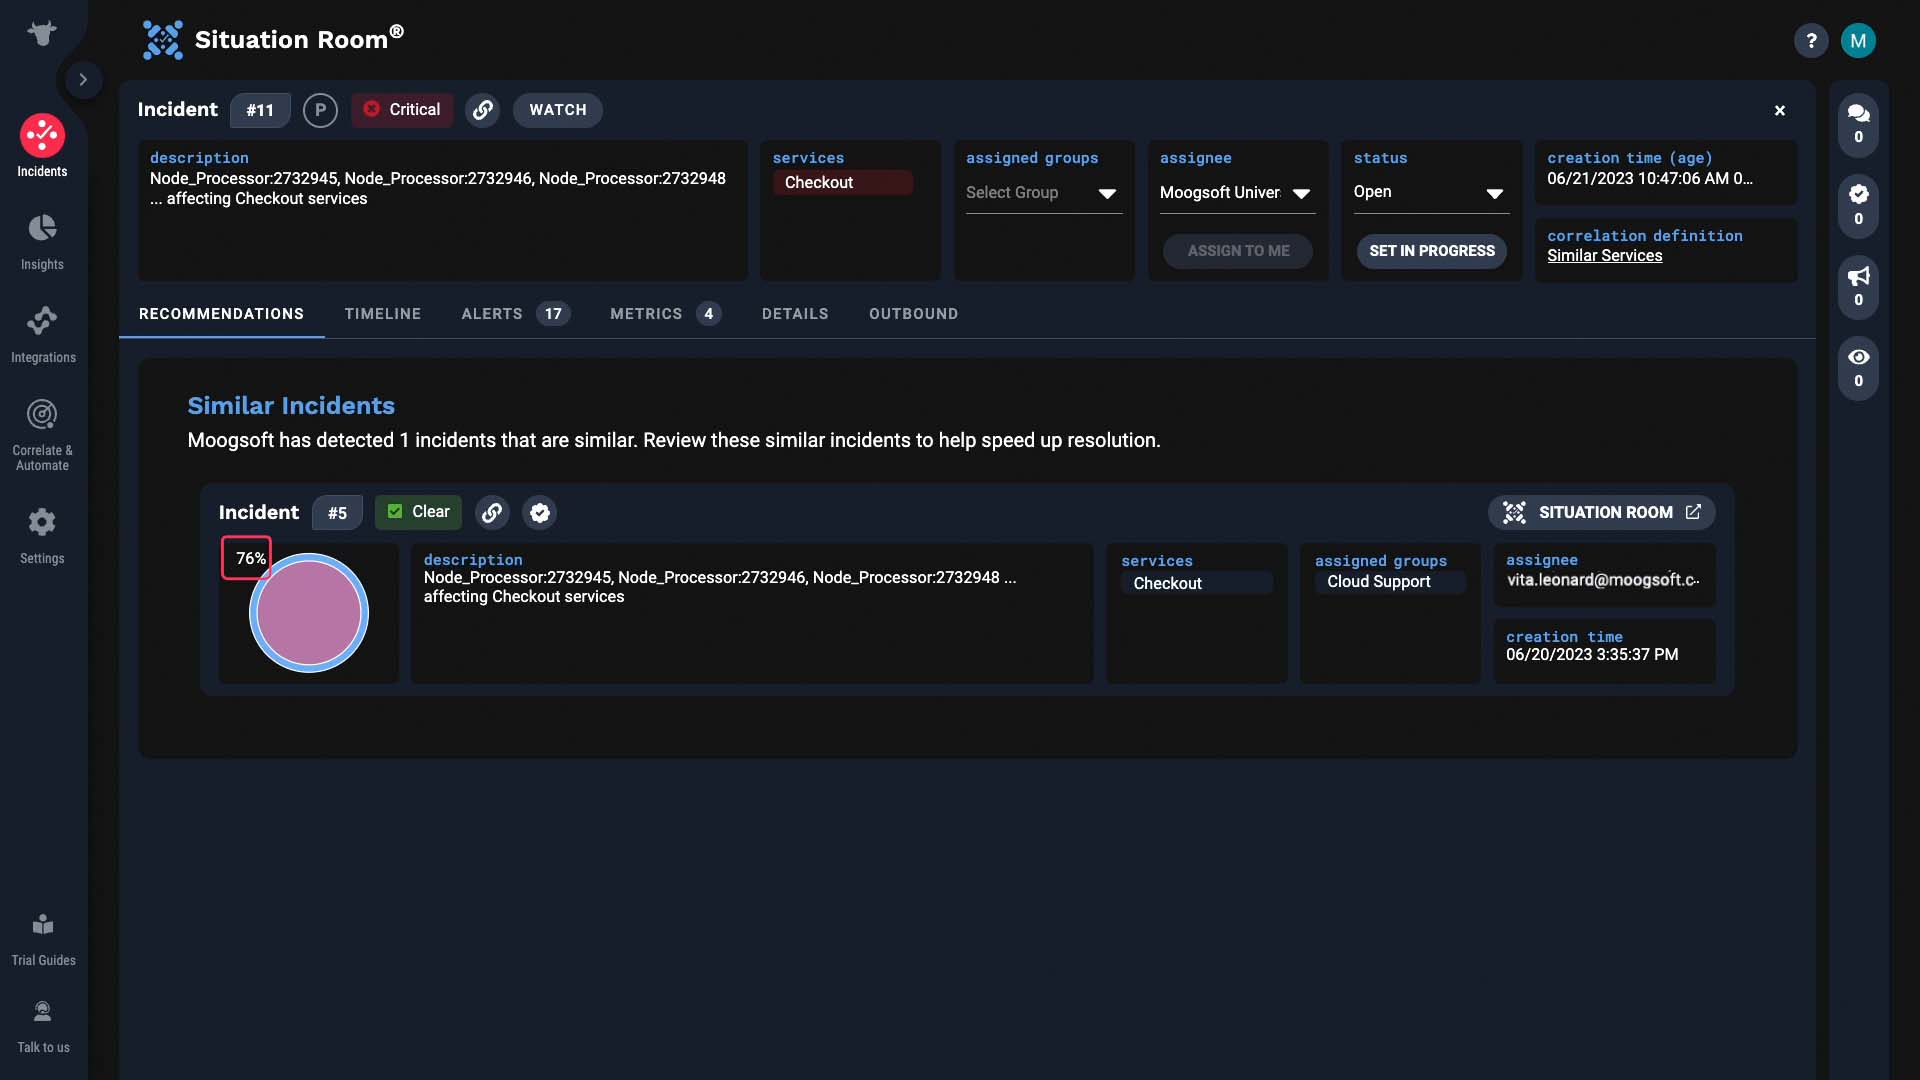
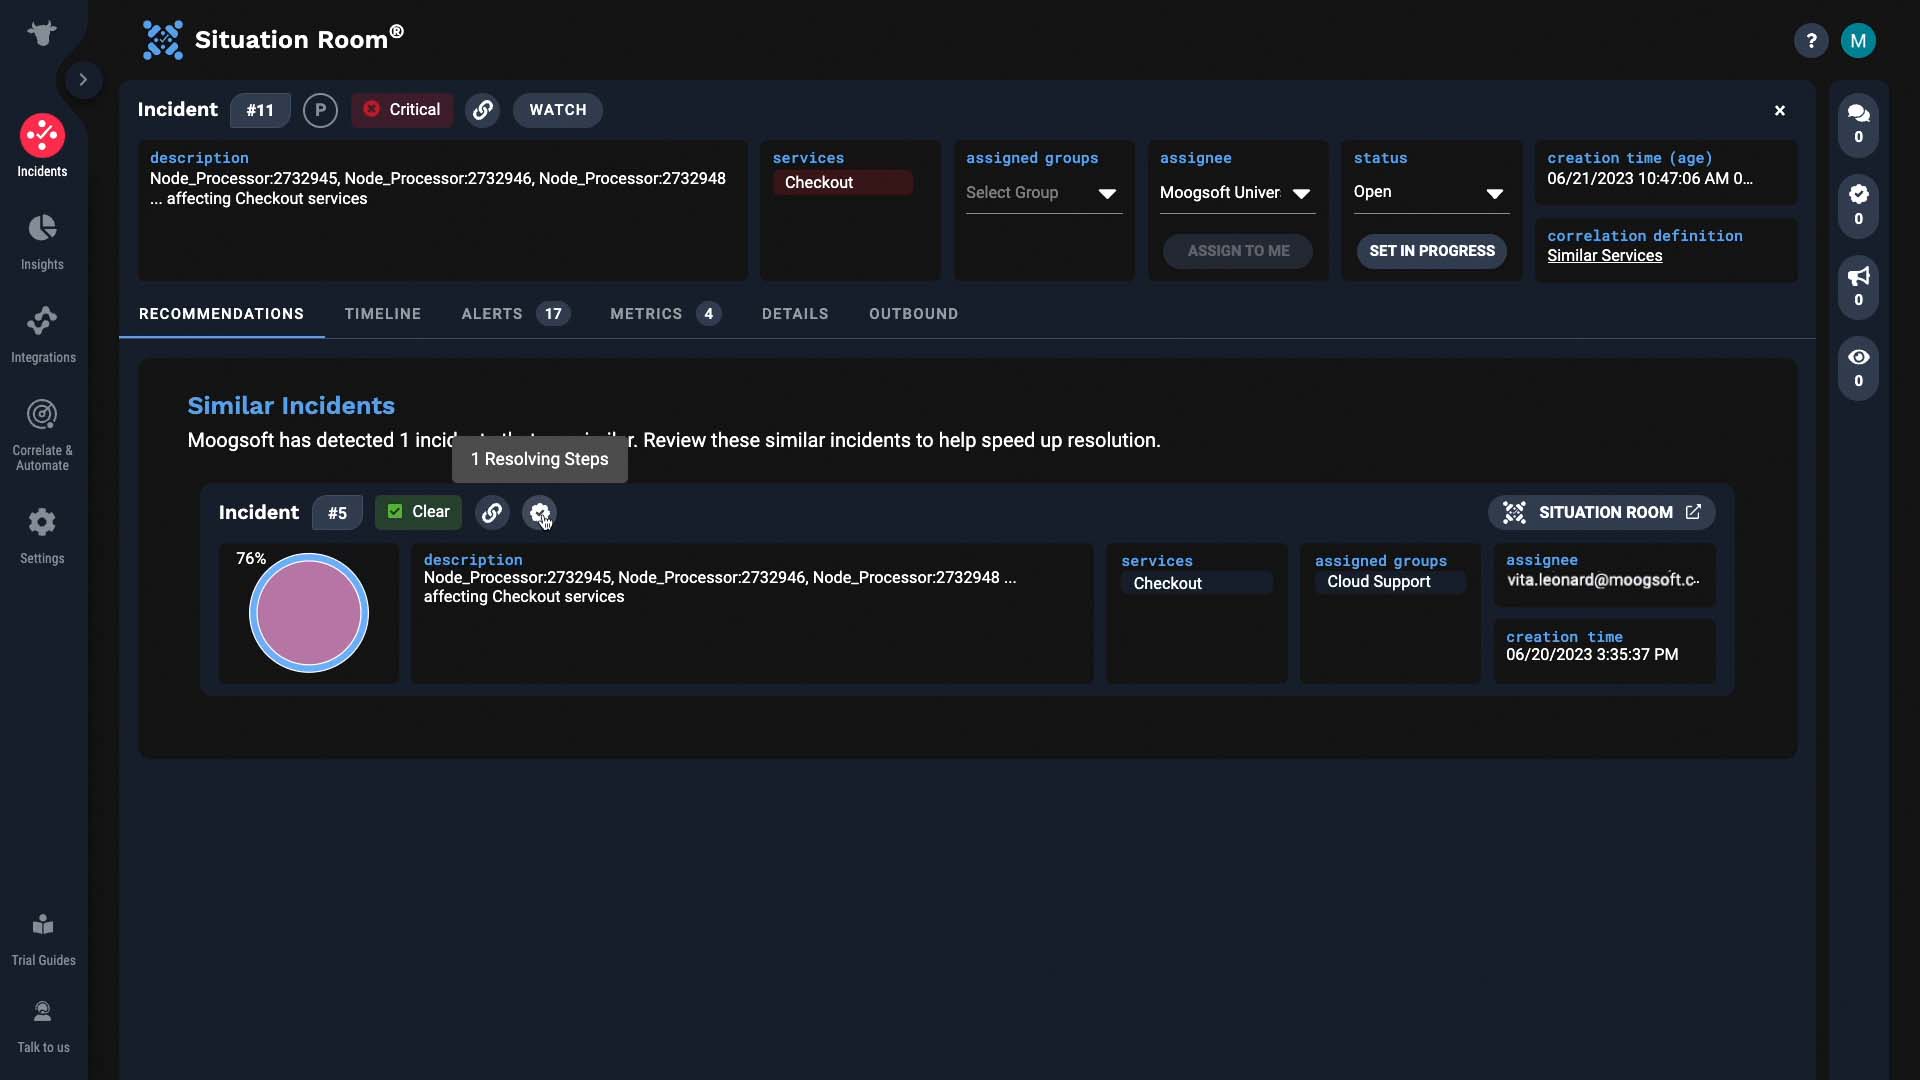
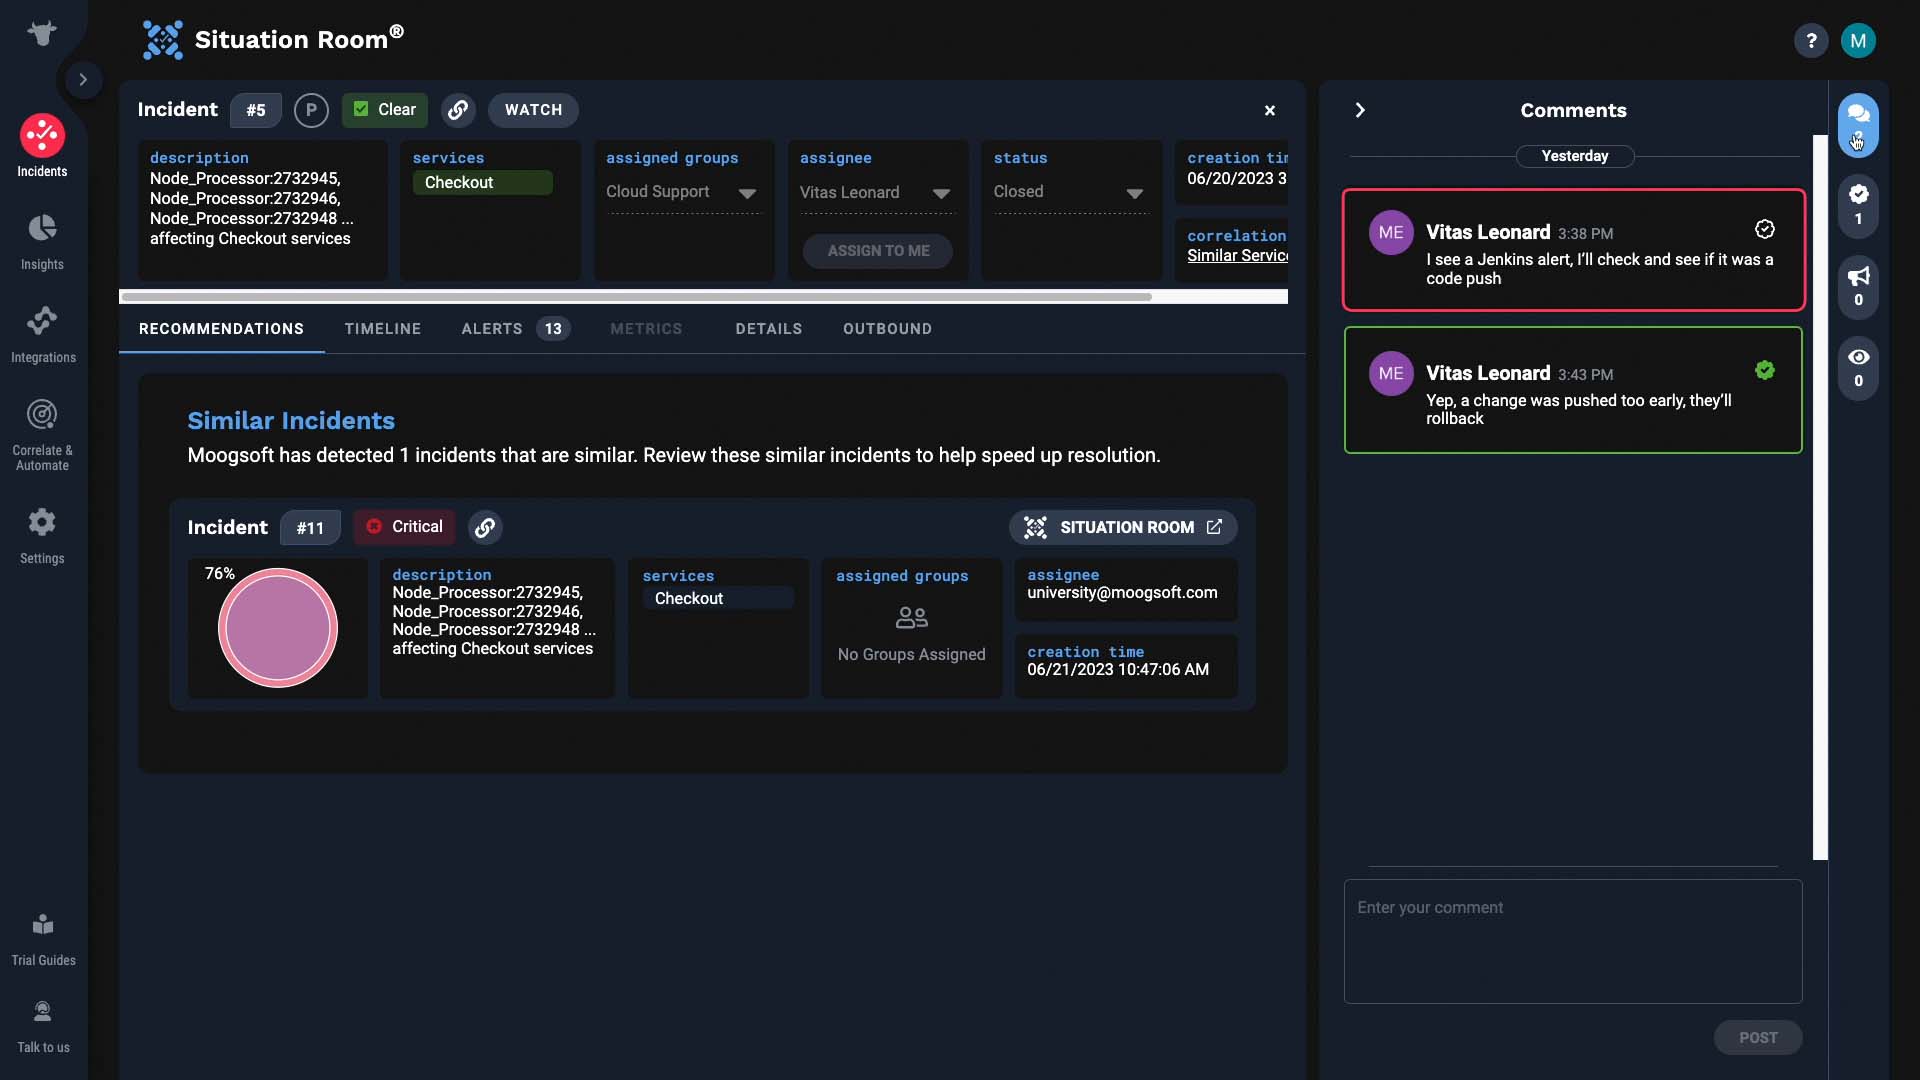
And note this icon! This means information on what resolved this incident is available! With this past incident, it looks like the problems were related to a code push. Let’s learn more about it.
Okay, now we have some more context.
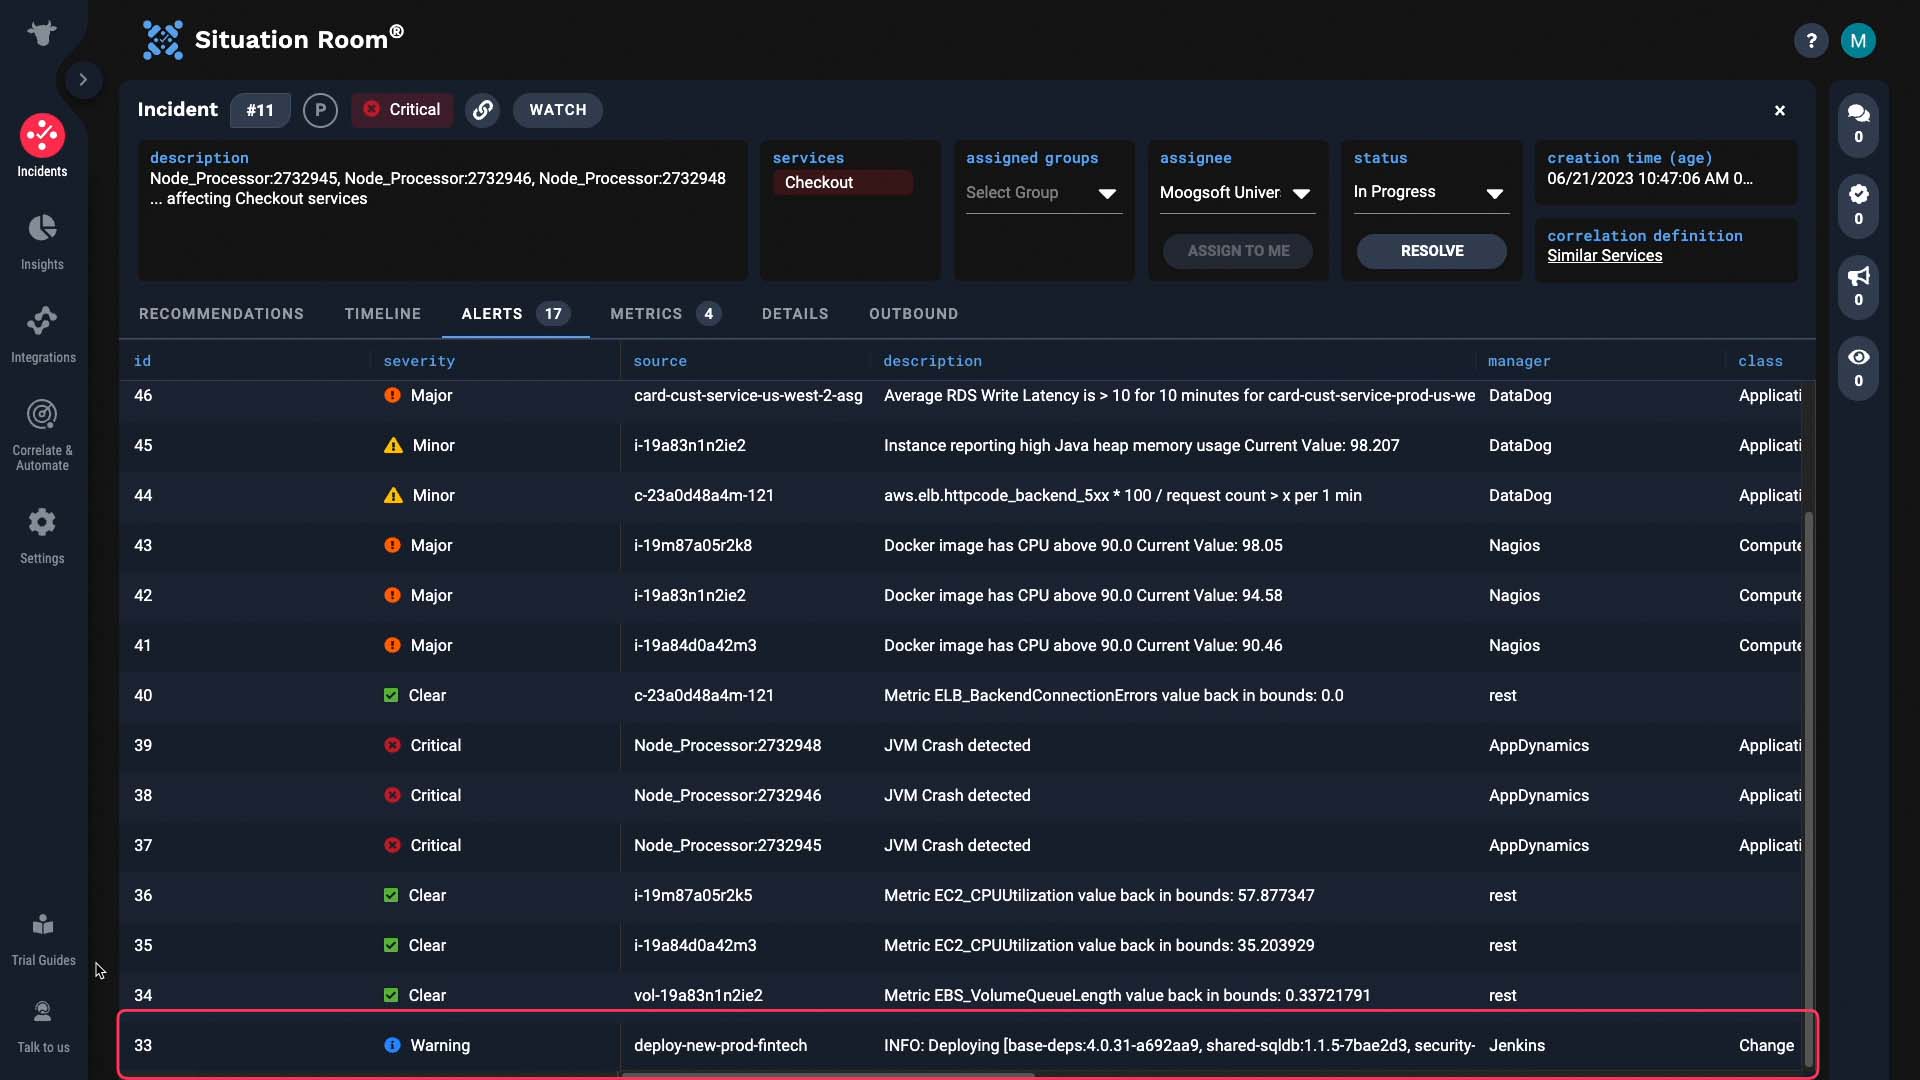
Let’s get back to the incident we were working on. Is there also a Jenkins alert in the current incident? Here’s the timeline that shows you how the incident unfolded…It says code deployment, so this is promising!
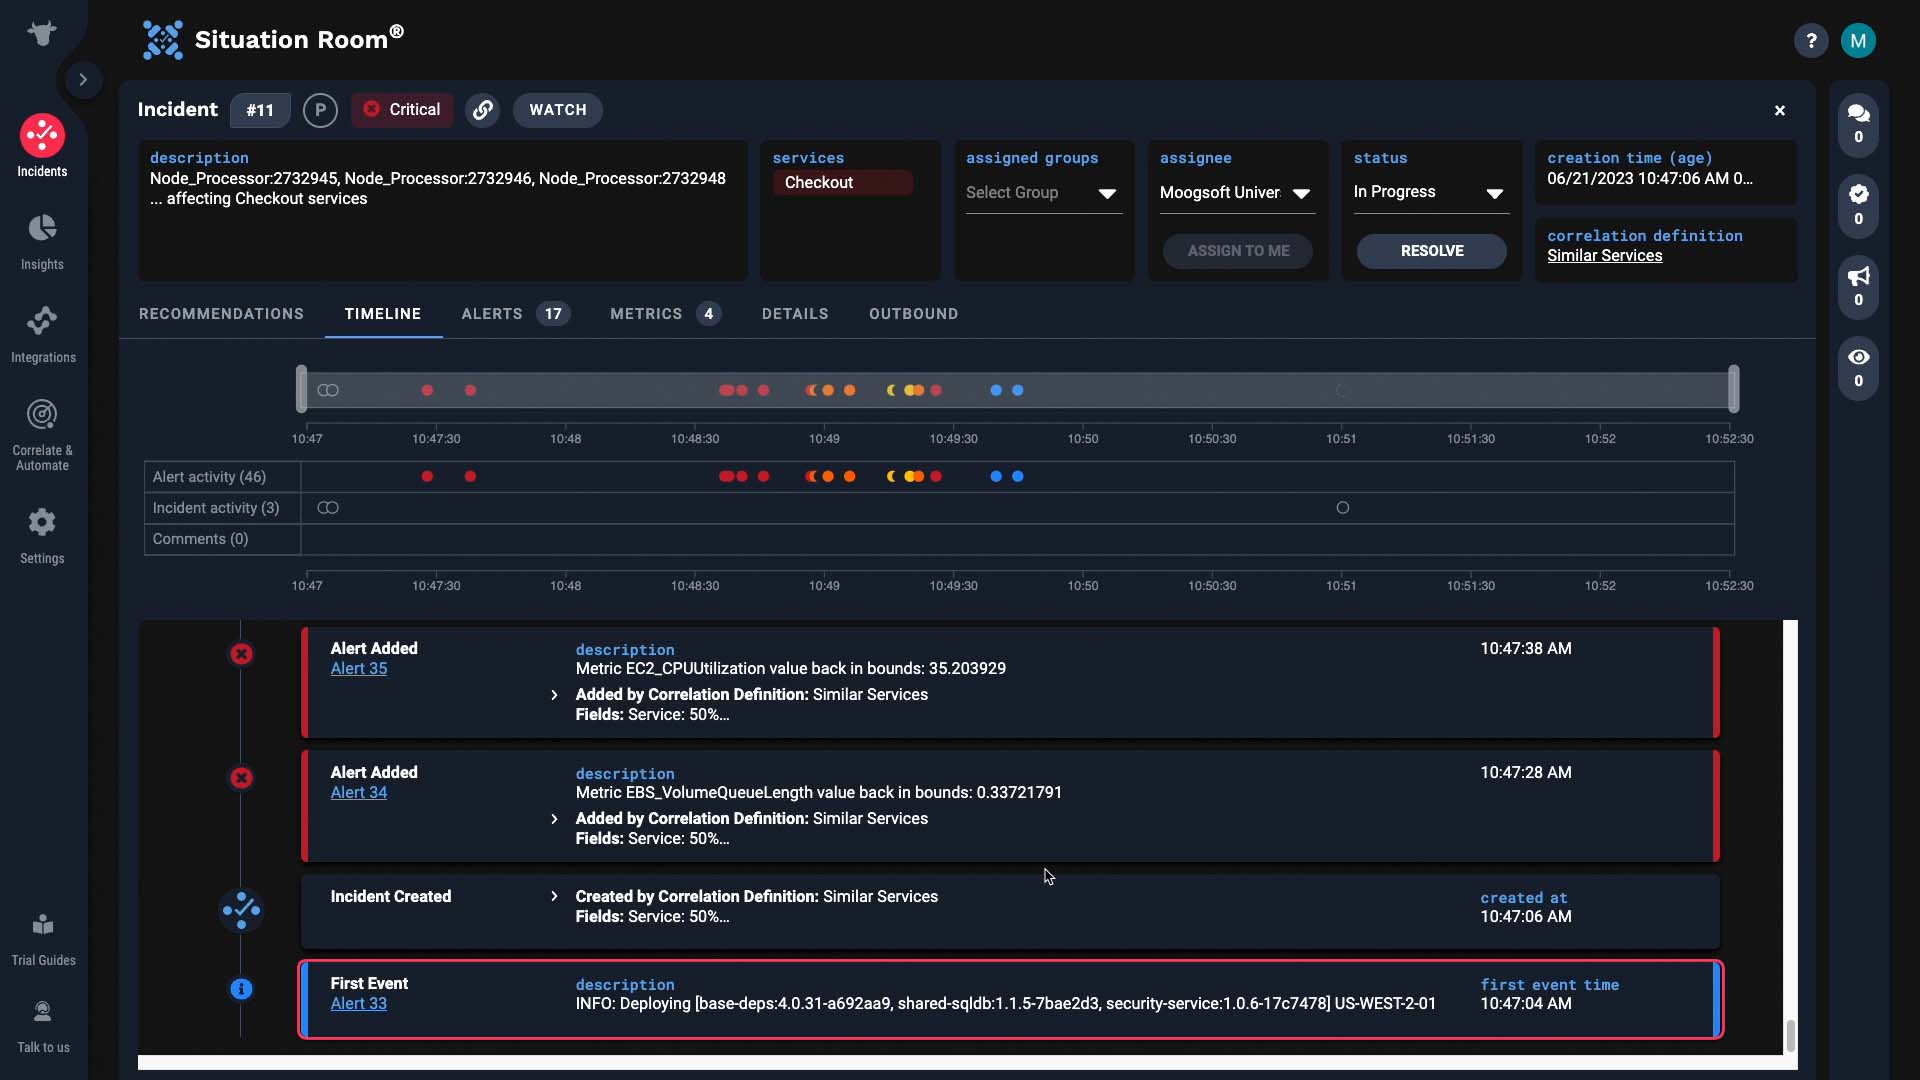
Yes, that is the Jenkins alert. It’s likely that this code change is the root cause of the incident. So indeed, that similar incident Incident Management suggested was right!
Let’s share our findings with the team. We’ll talk to the developers and get the deployment rolled back.
All fixed… that was quick! Now you know how the Situation Room supports faster incident resolution. Thanks for watching!
BASIC | 3 MIN
The Situation Room is where you can collaborate to share information and resolve incidents. In this video, learn about the top section of the Situation Room.
Use case walkthrough: Top Pane of Situation Room ►
This video explains how to use the different fields in the top pane of the Situation Room in APEX AIOps Incident Management.
*Please note Moogsoft is now part of Dell's IT Operations solution called APEX AIOps, and changed its name to APEX AIOps Incident Management. The UI in this video may differ slightly but the content covered is still relevant.
Let’s take a closer look at each field of the situation room. We’ll focus on the top pane in this video.
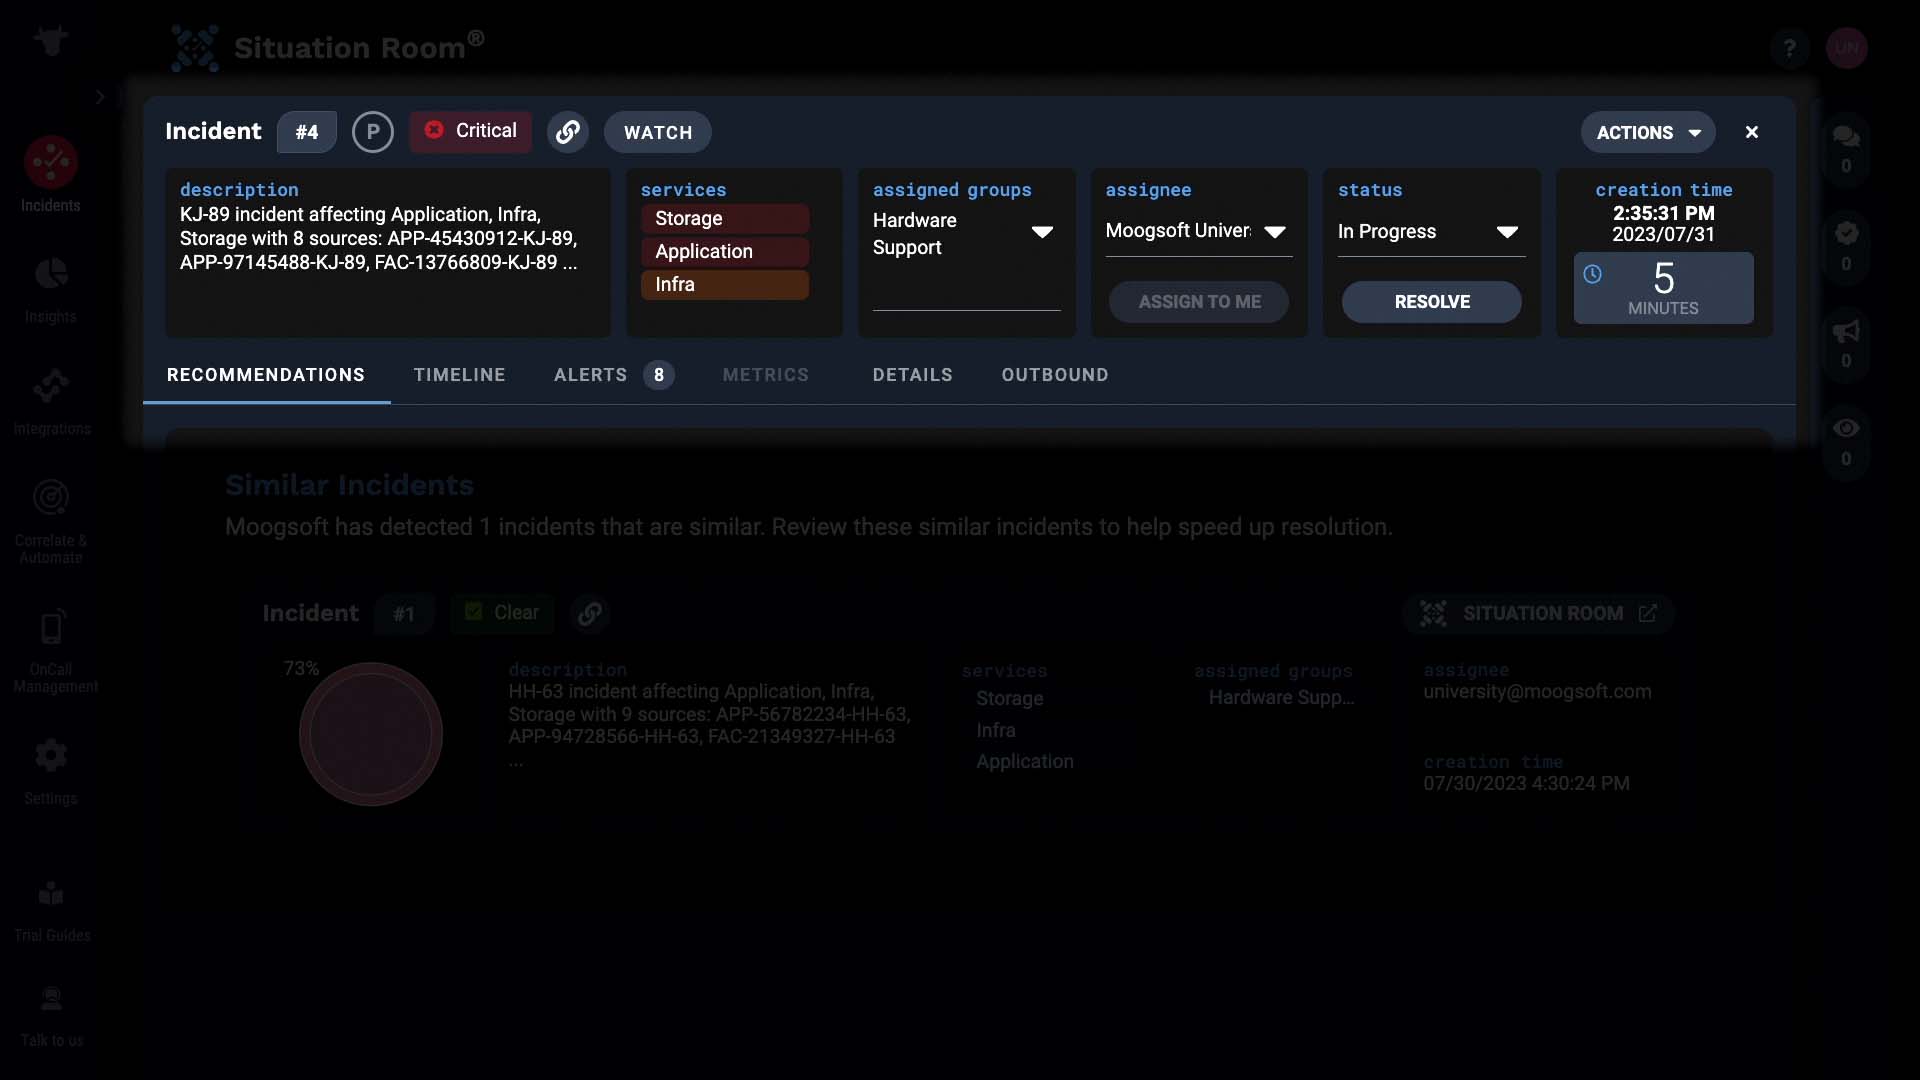
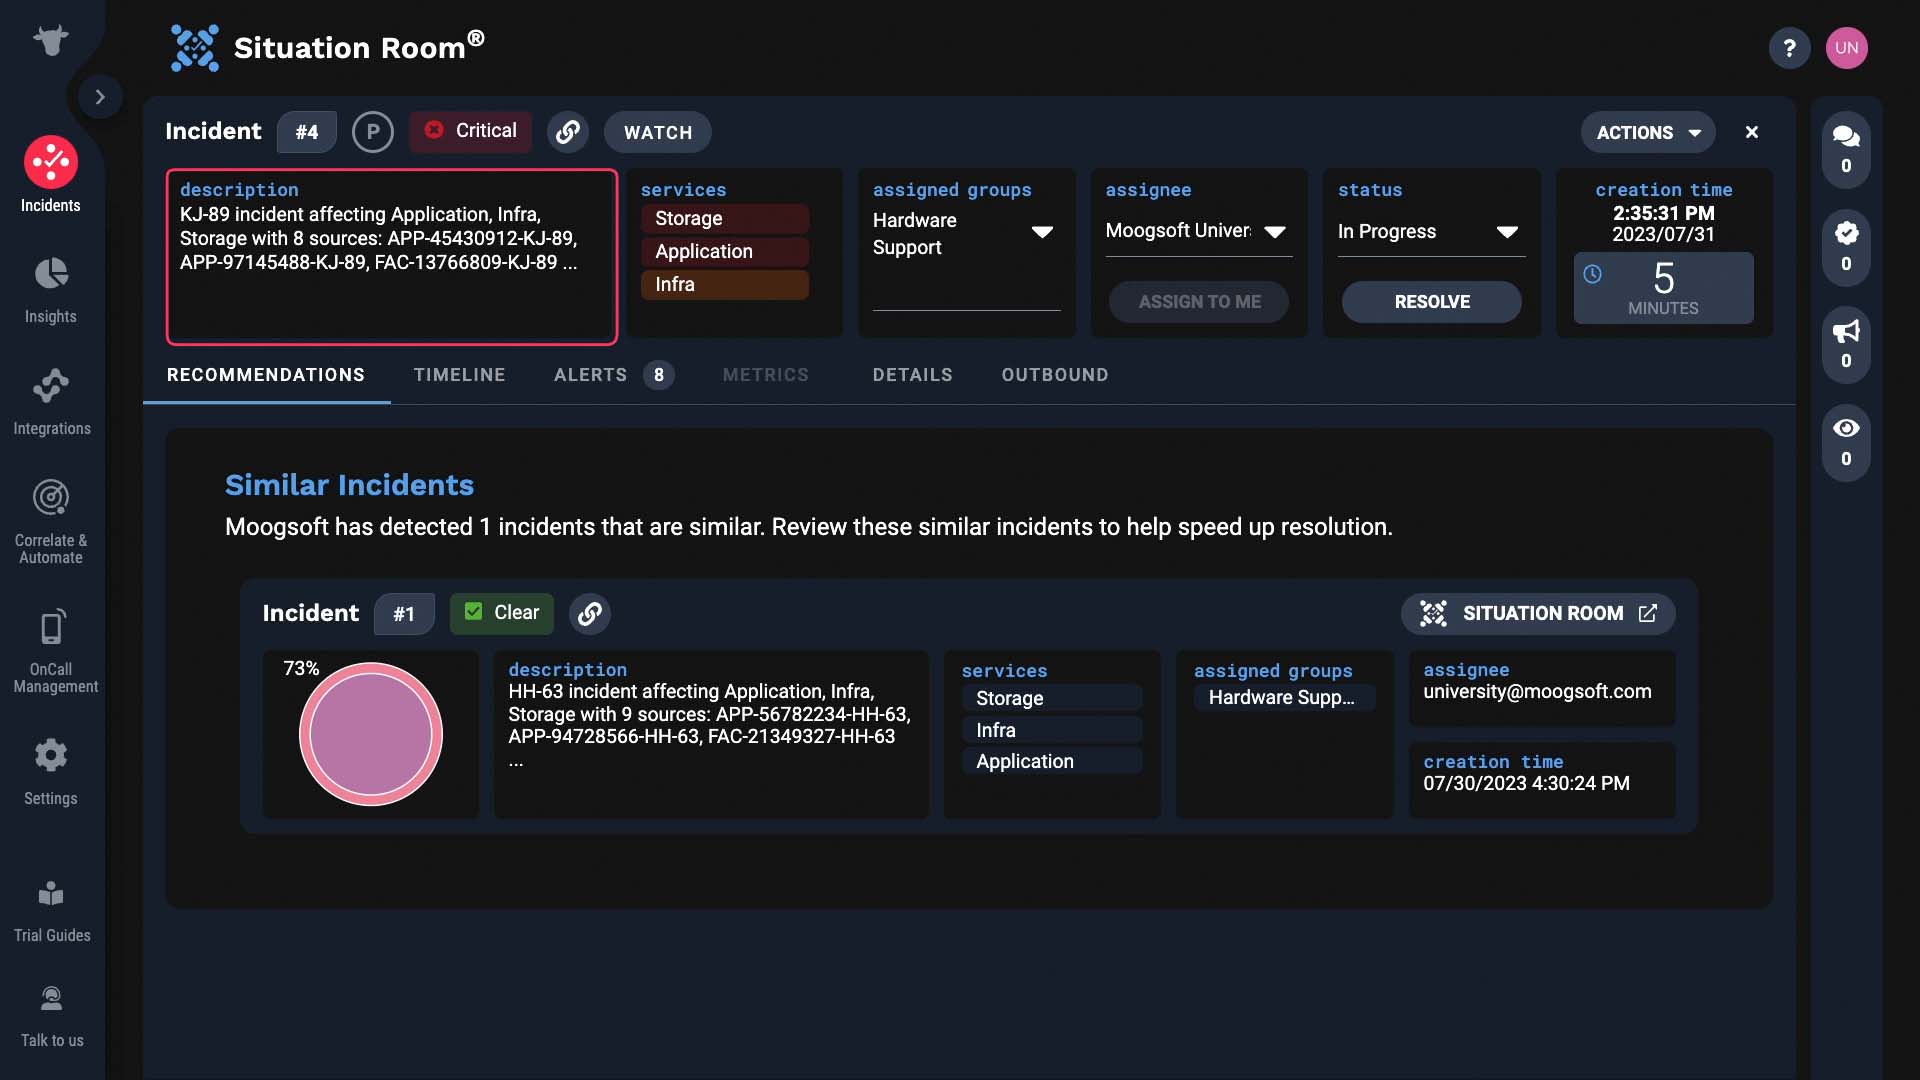
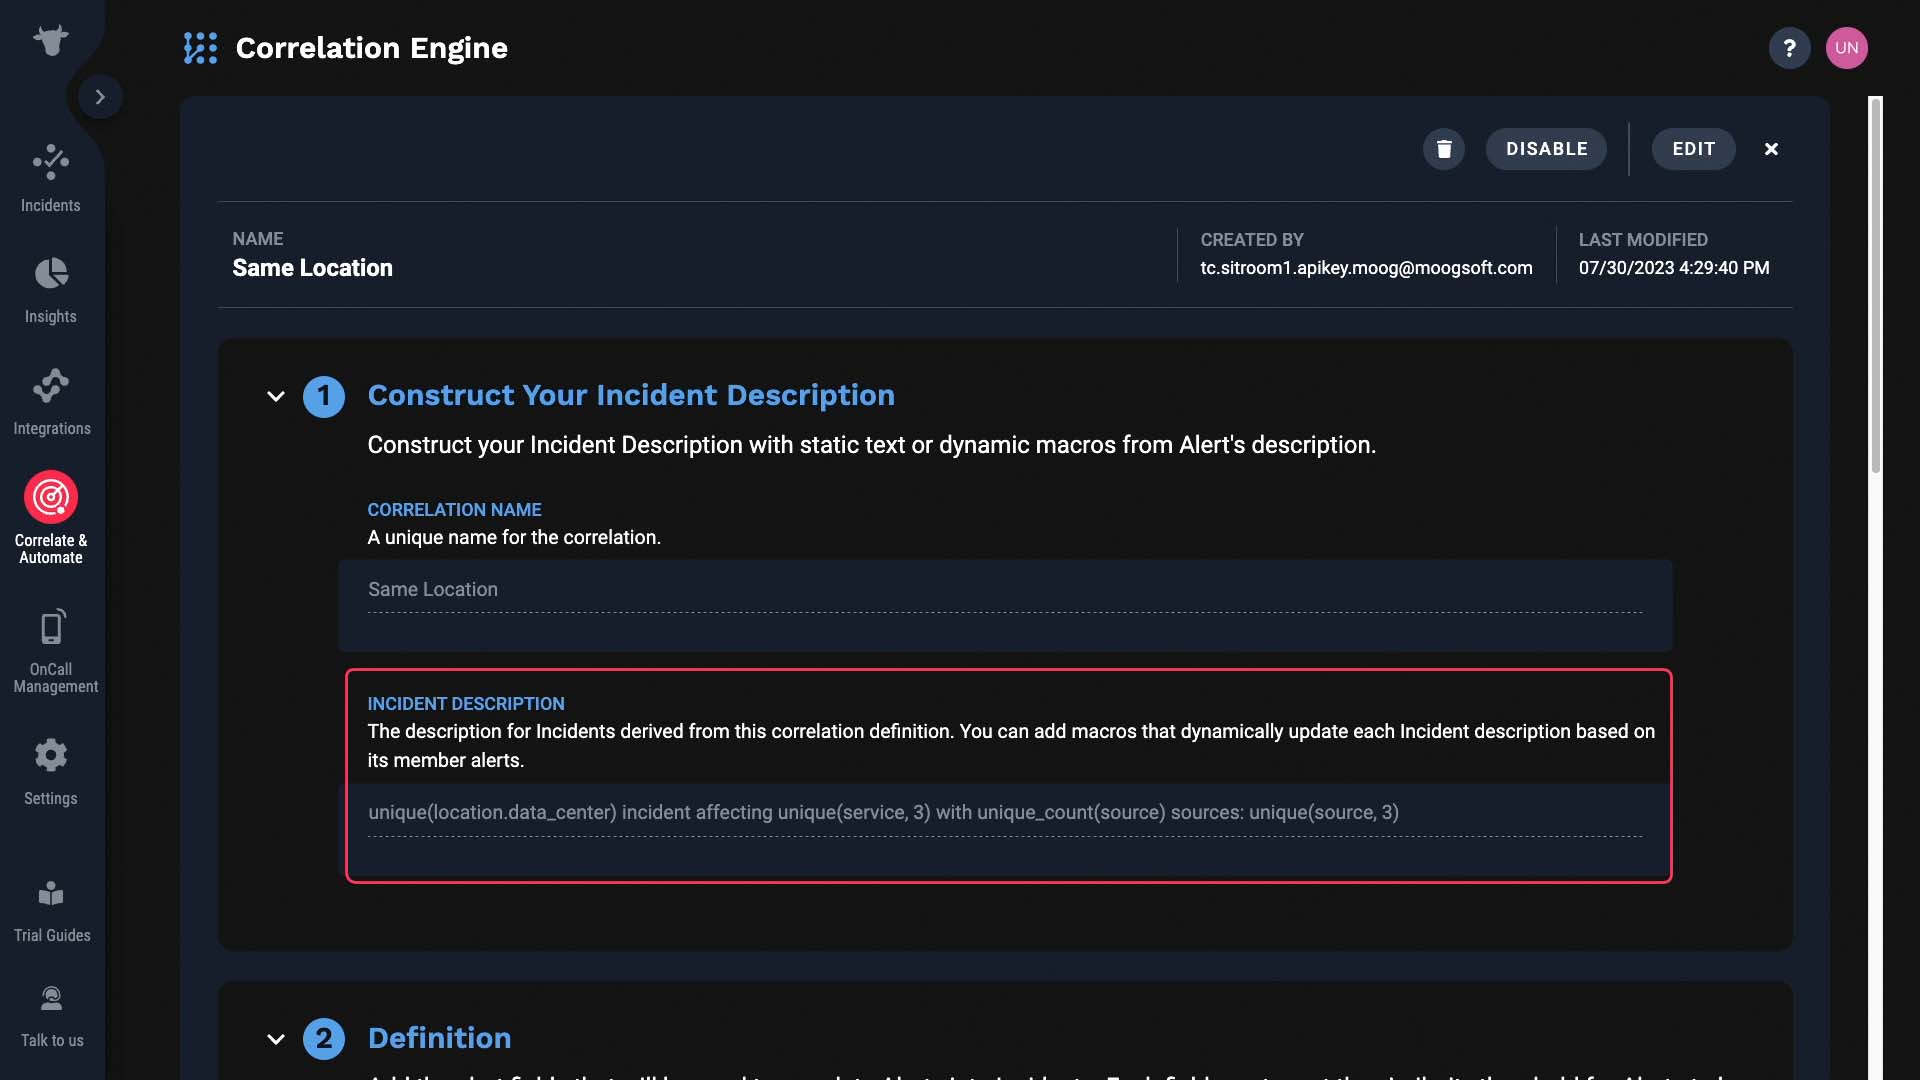
This description of the incident is generated by the correlation definition that grouped the alerts.
It is defined here.
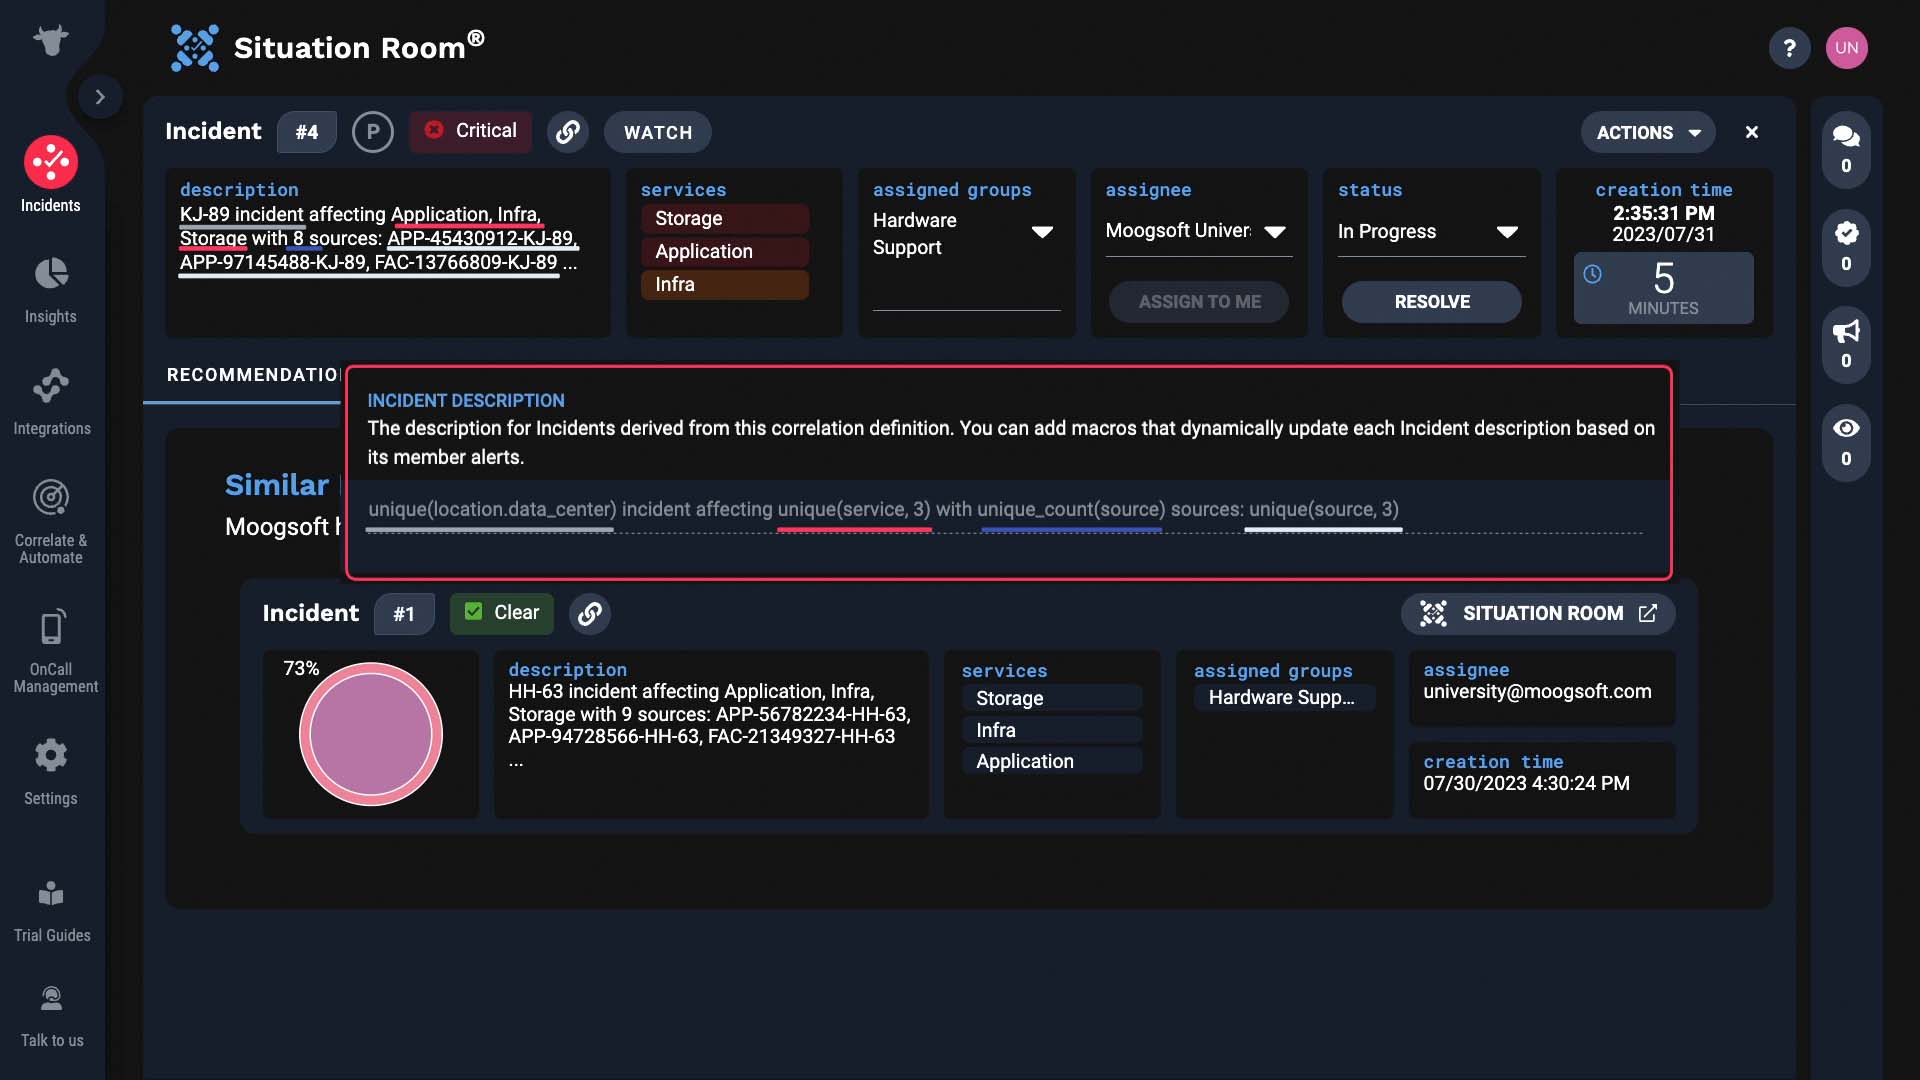
So in this example, the location, top three service names, number of sources, and top three source names are all dynamically inserted.
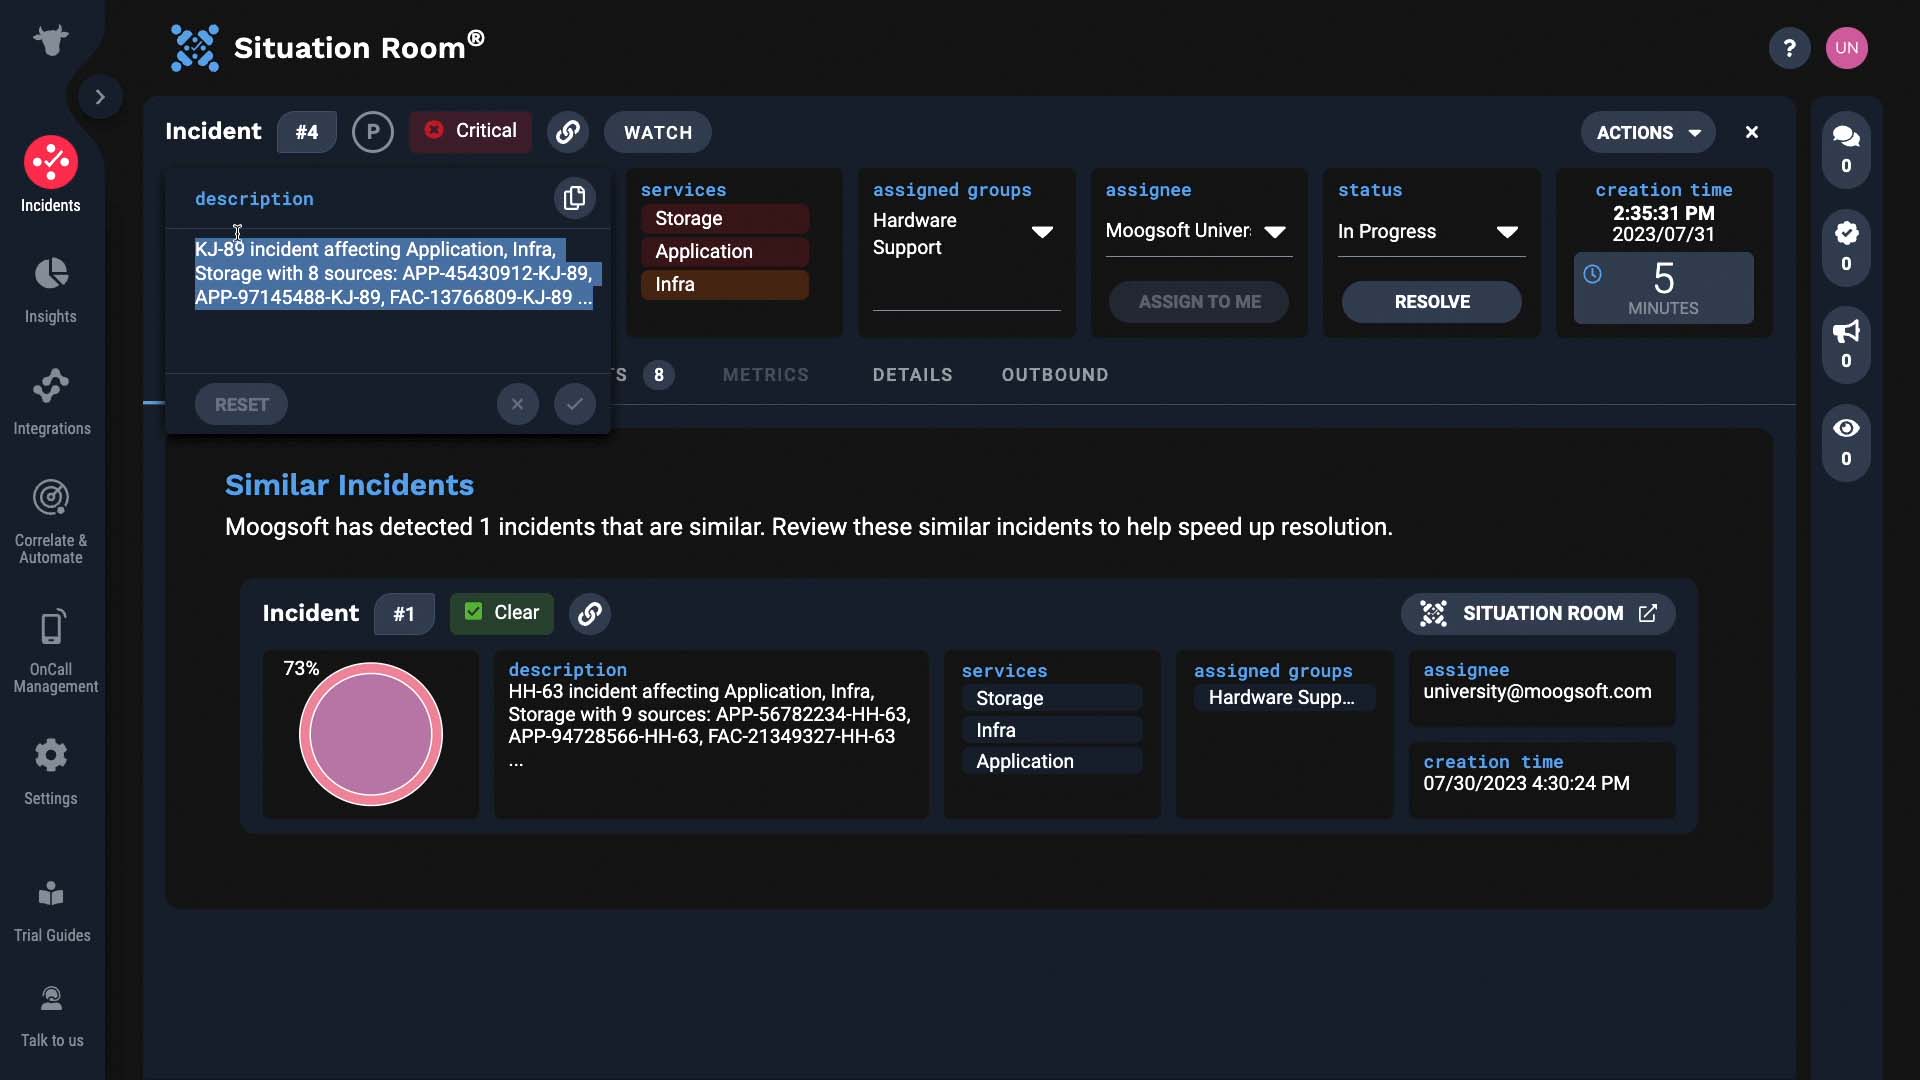
But you can edit it like this, if needed.
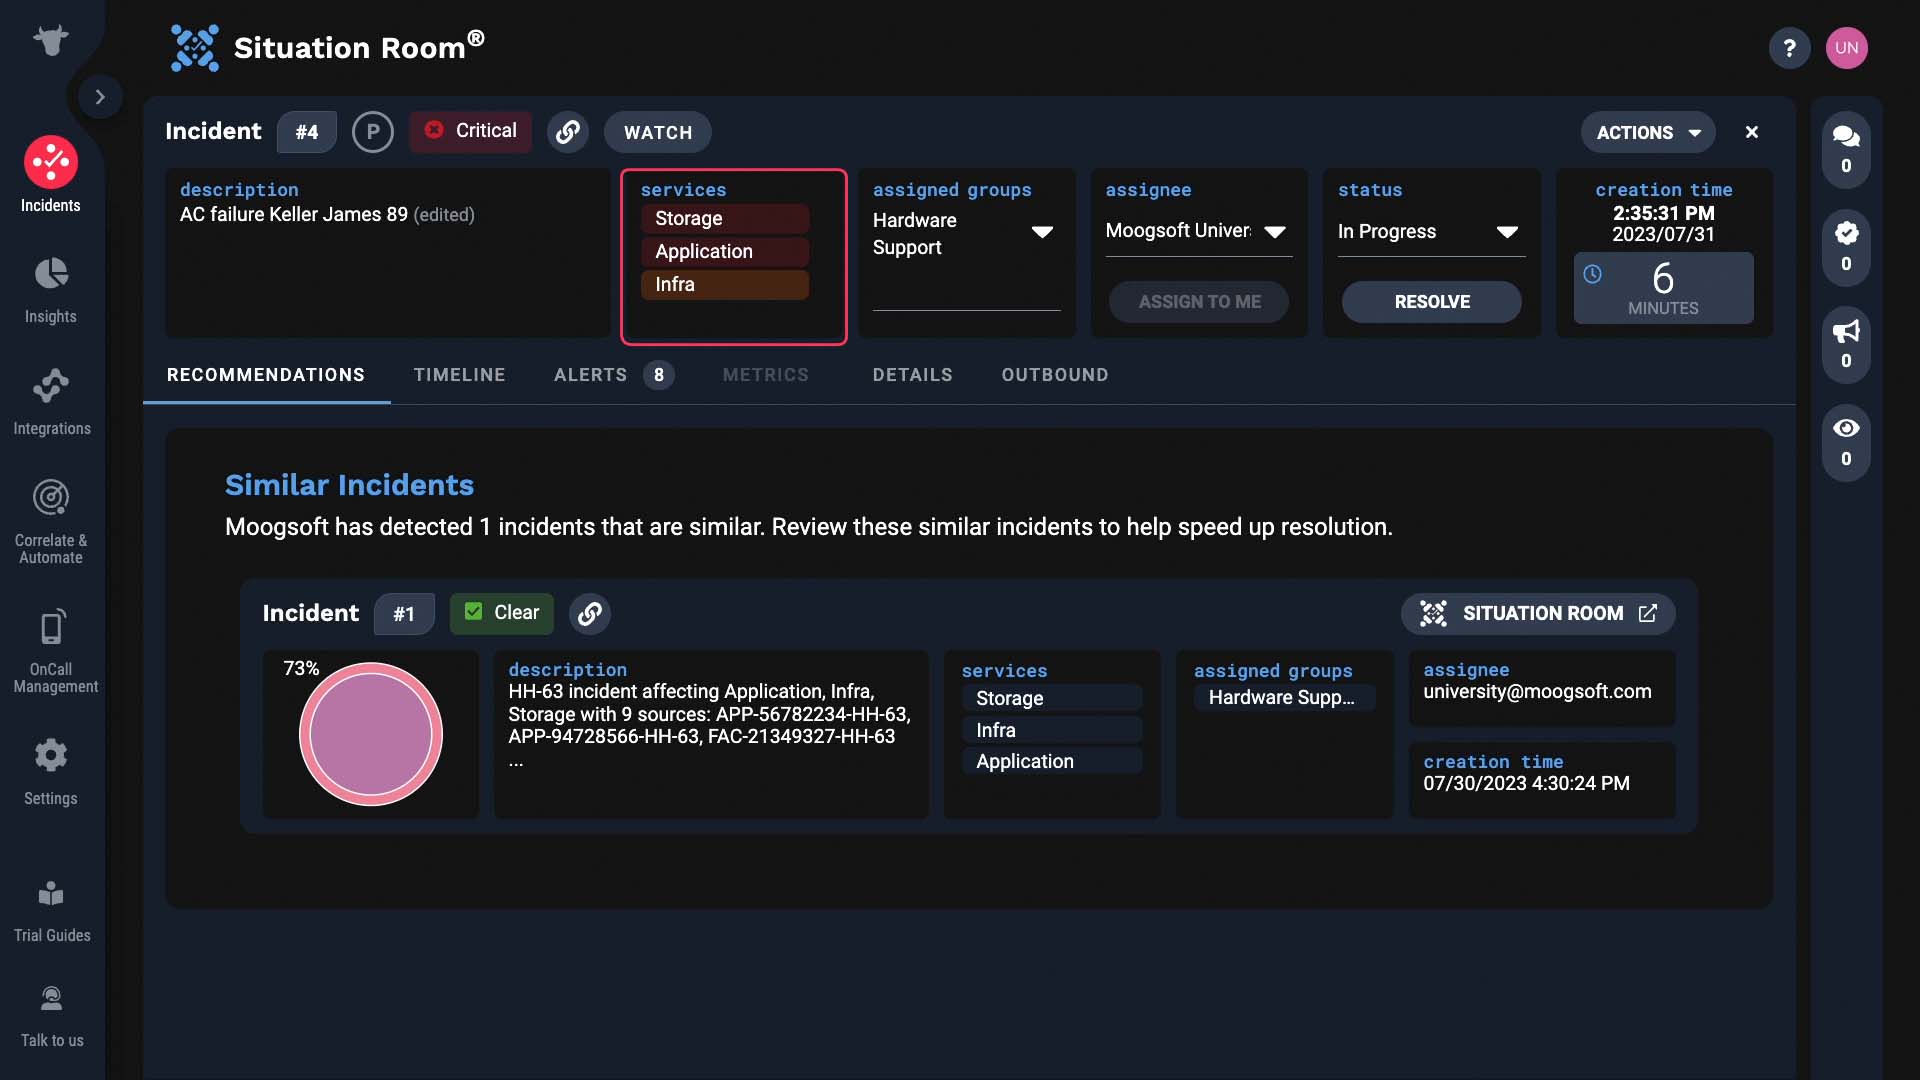
This shows the services impacted by this incident.
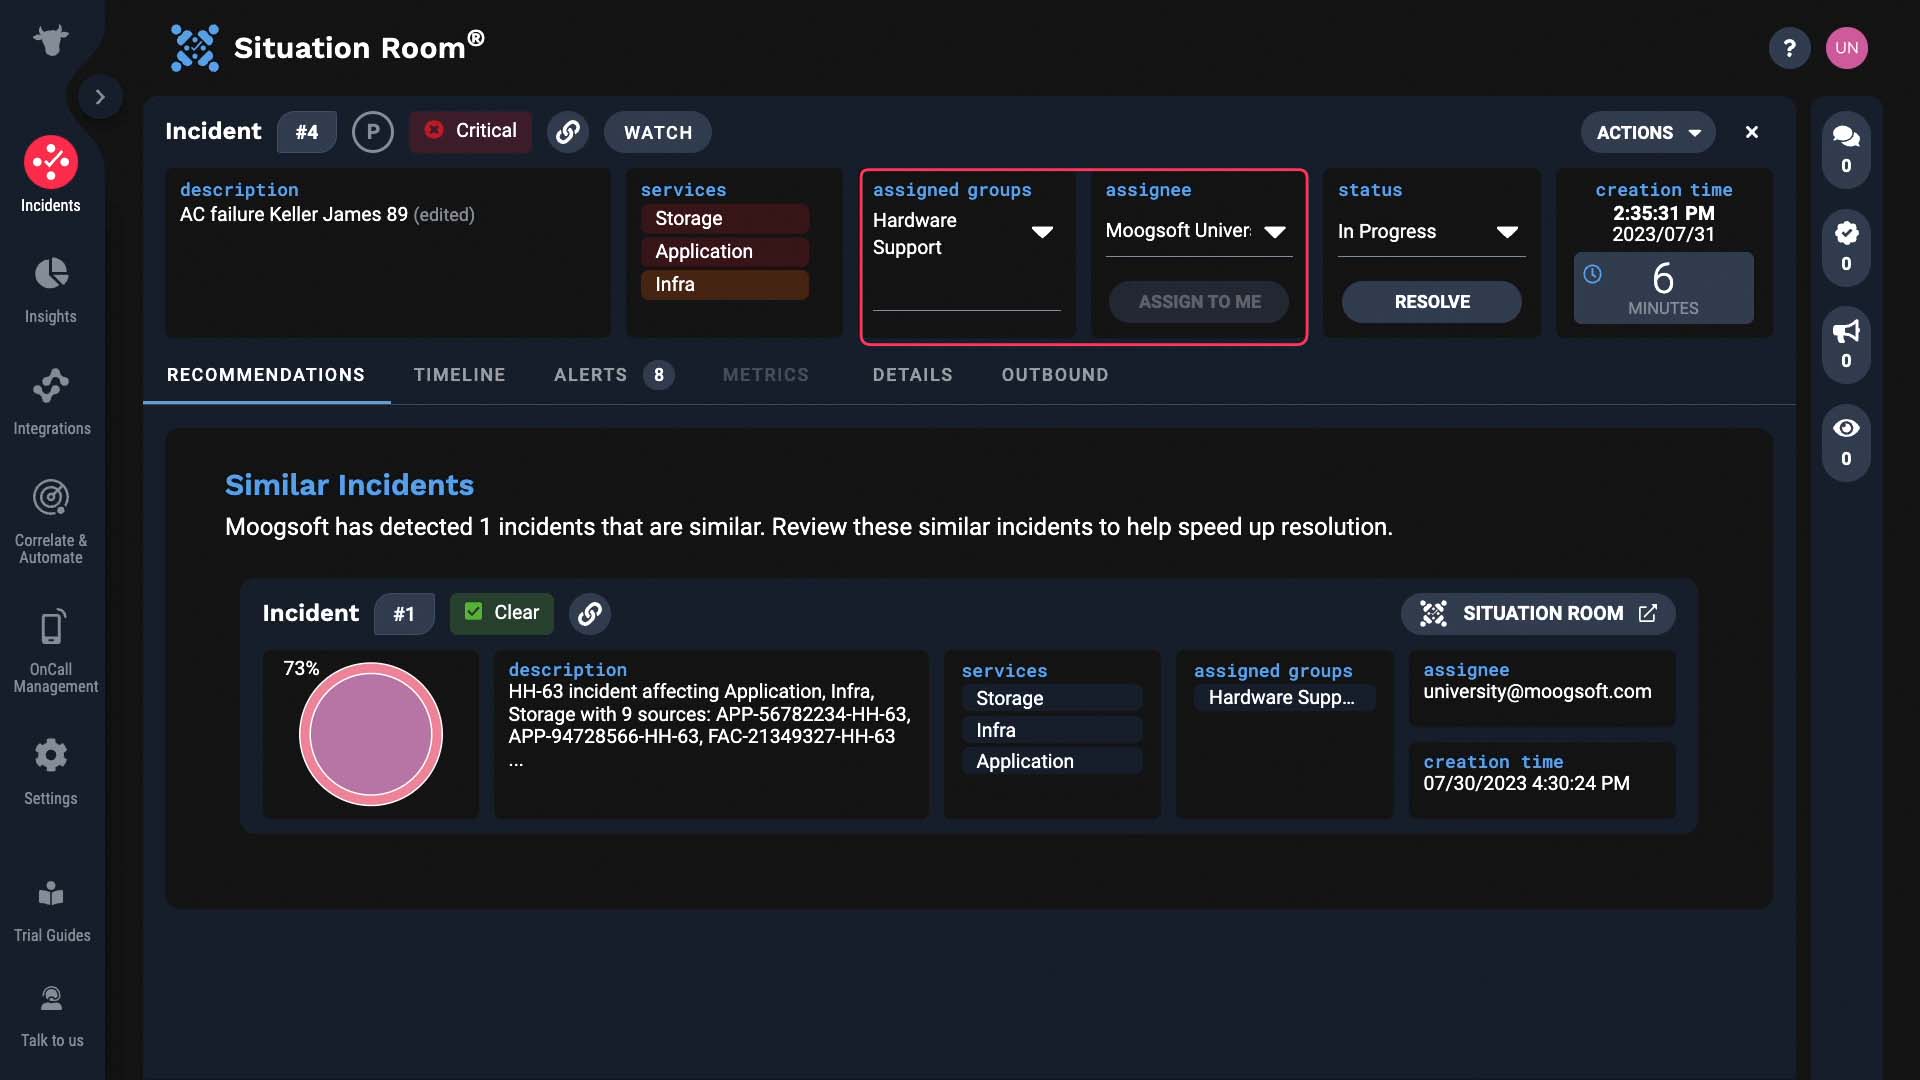
An incident can be assigned to an individual, and additionally, to one or more groups.
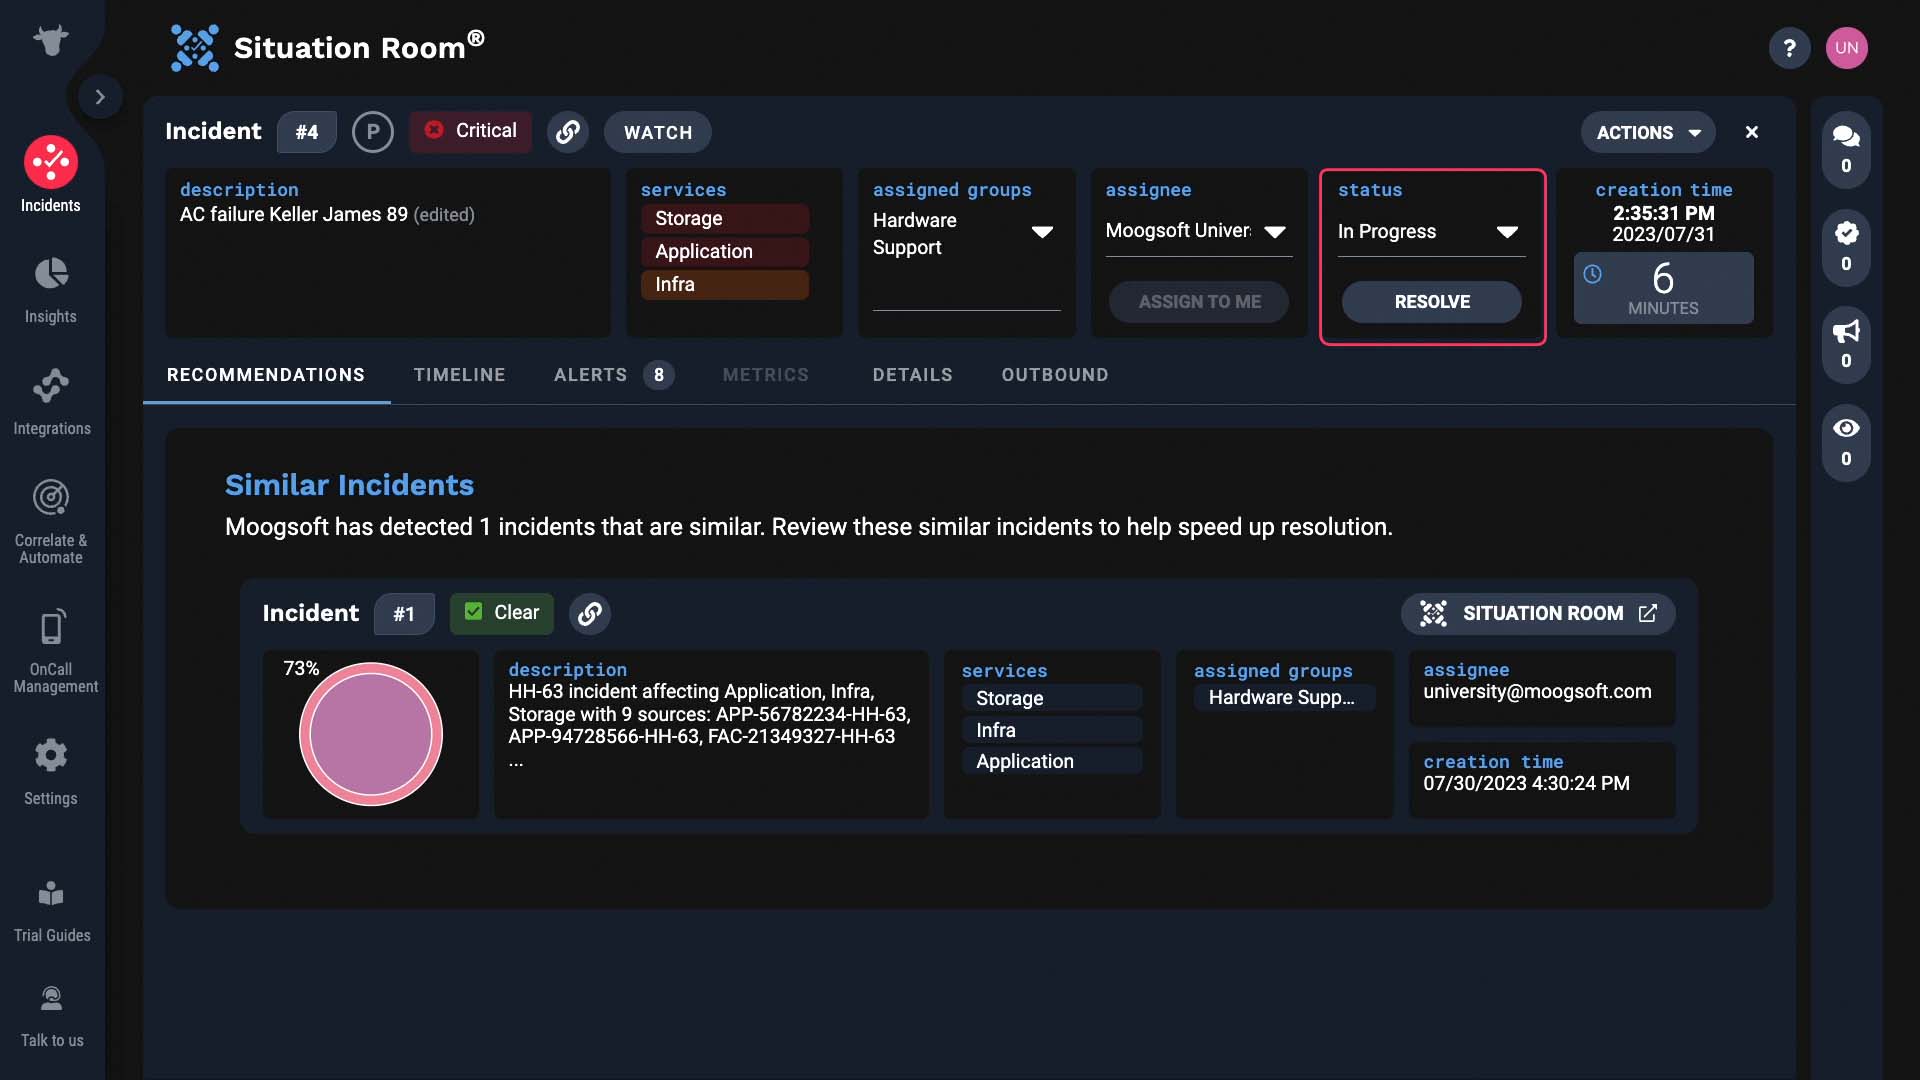
When it’s assigned to a person, the status changes.
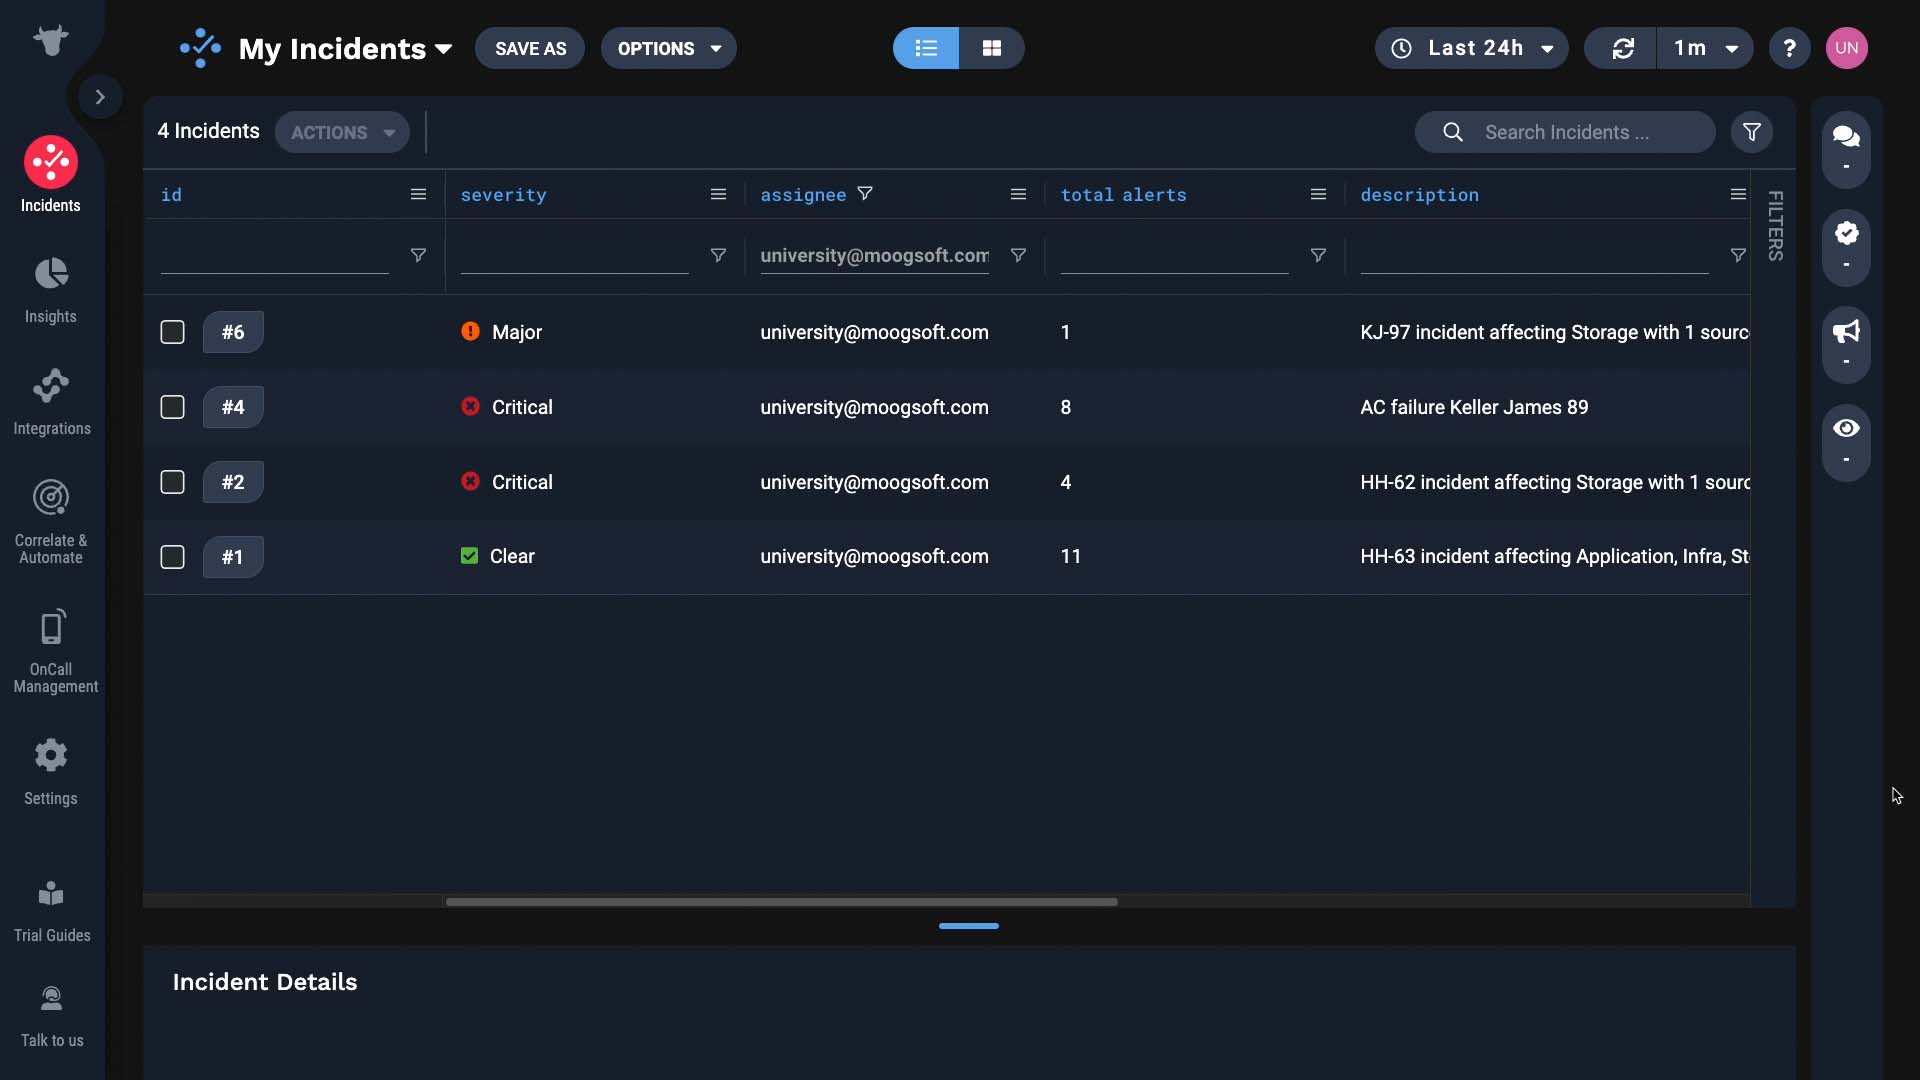
How would you know when you have an incident assigned to you? A few ways. Here you can see all the incidents assigned to you.
Or your administrator may have configured an integration to trigger a notification.
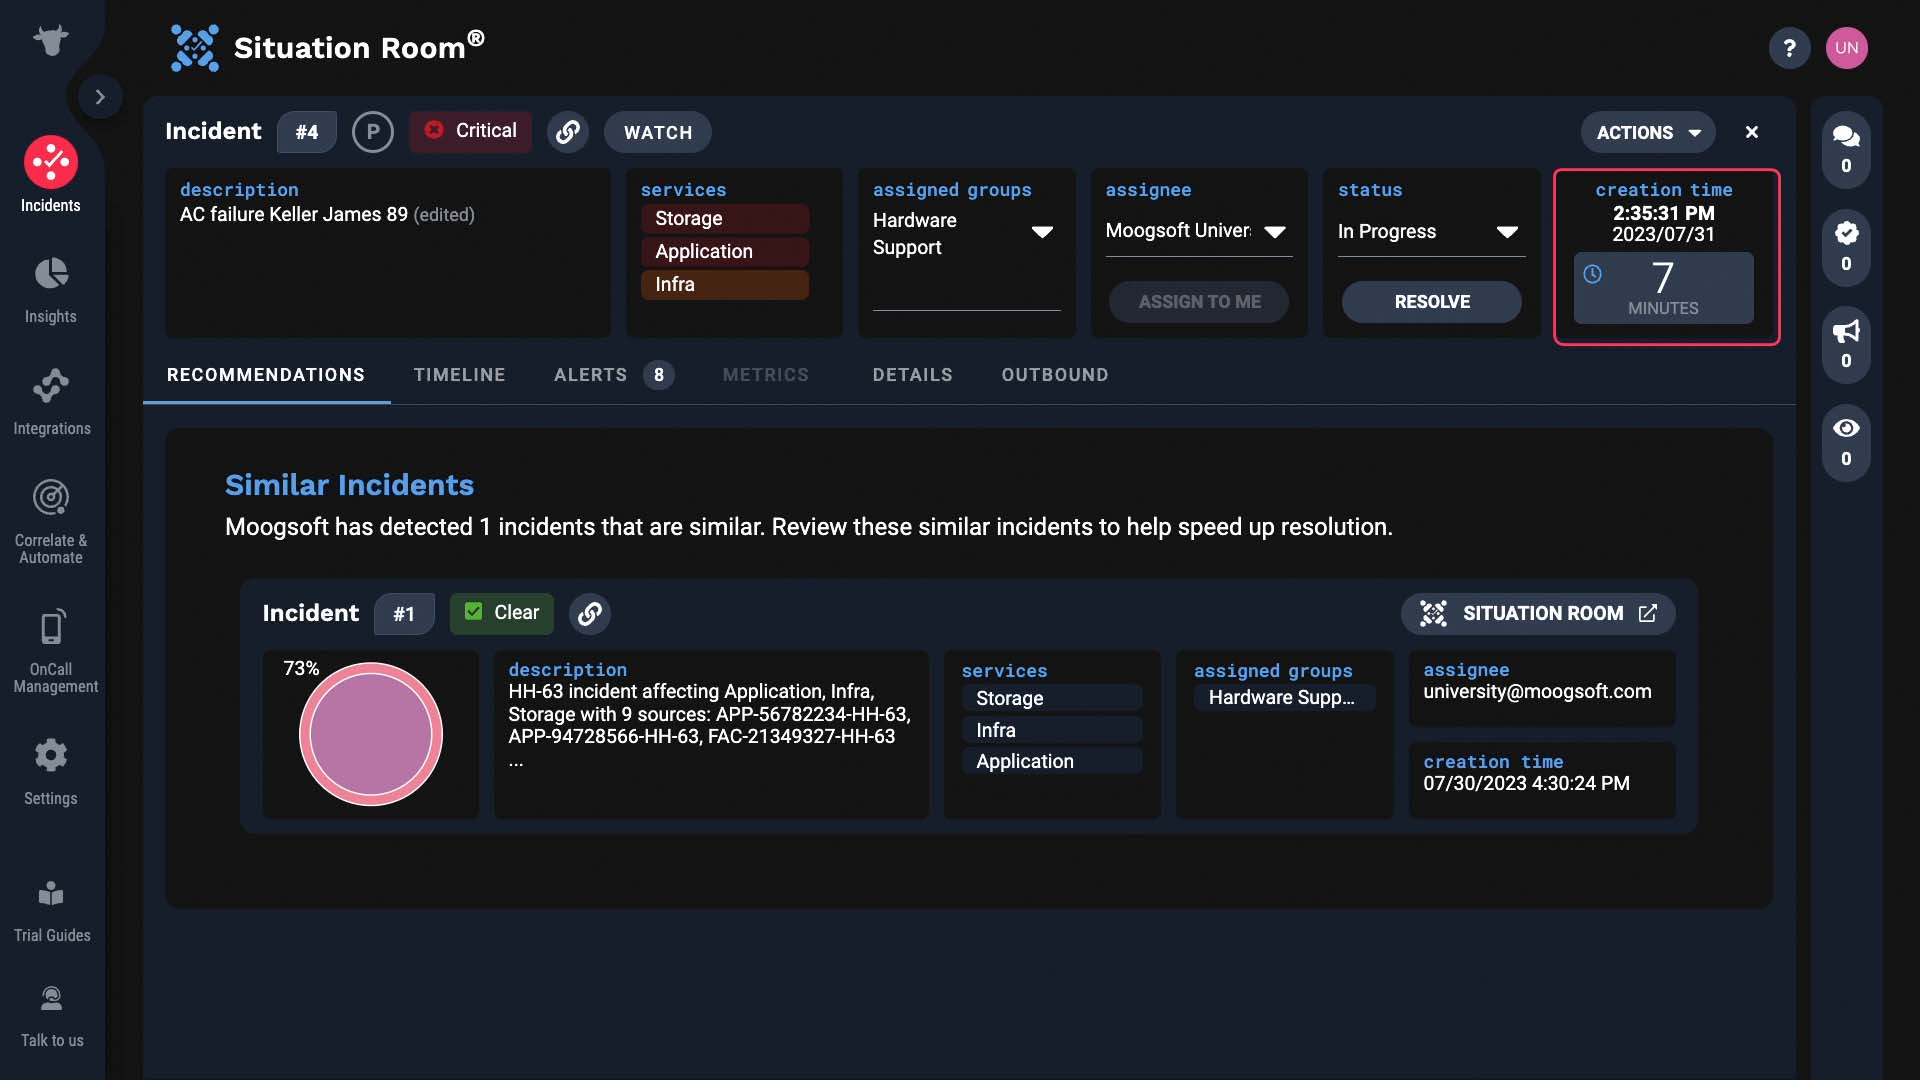
The creation time is the time Incident Management grouped these alerts and created an incident. So note that it’s not the time the first event happened.
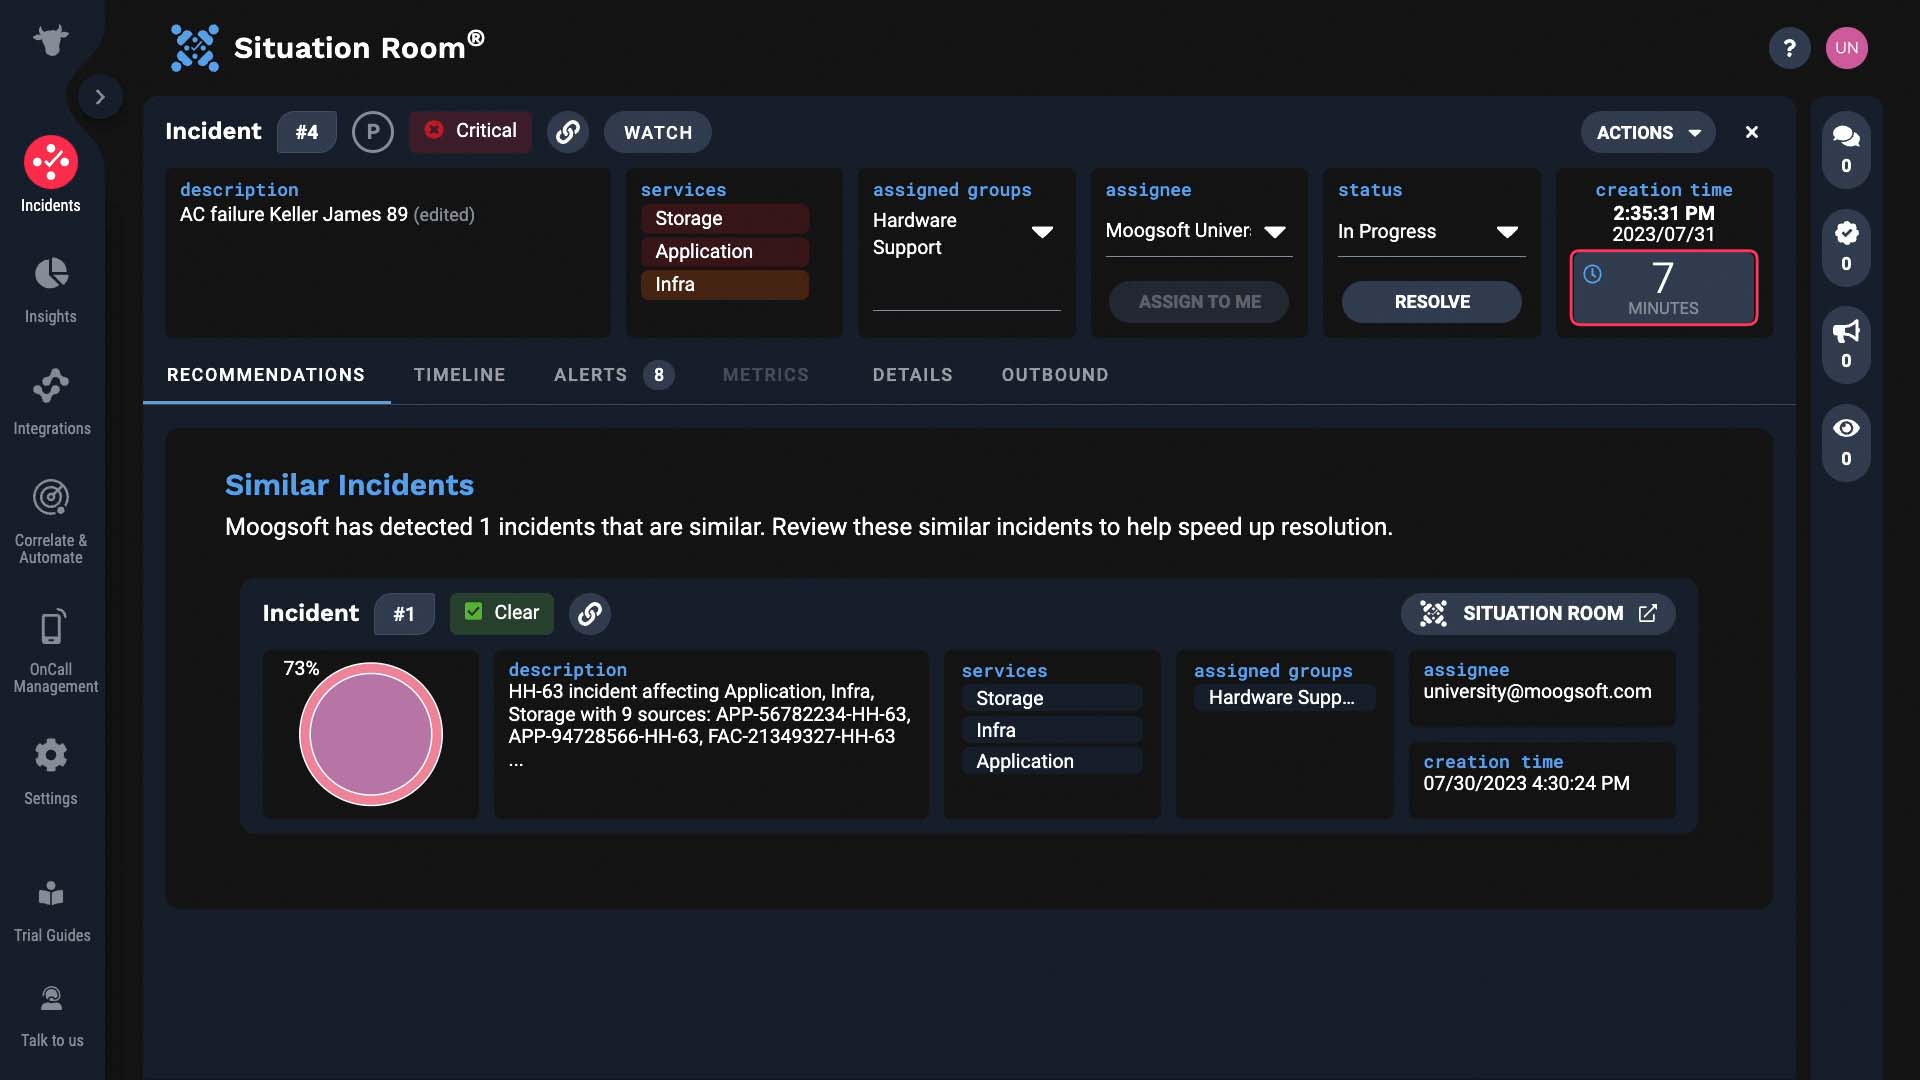
This shows how long the incident has been open.
If your administrator configured this, you can set a tag or perform tasks using a designated URL.
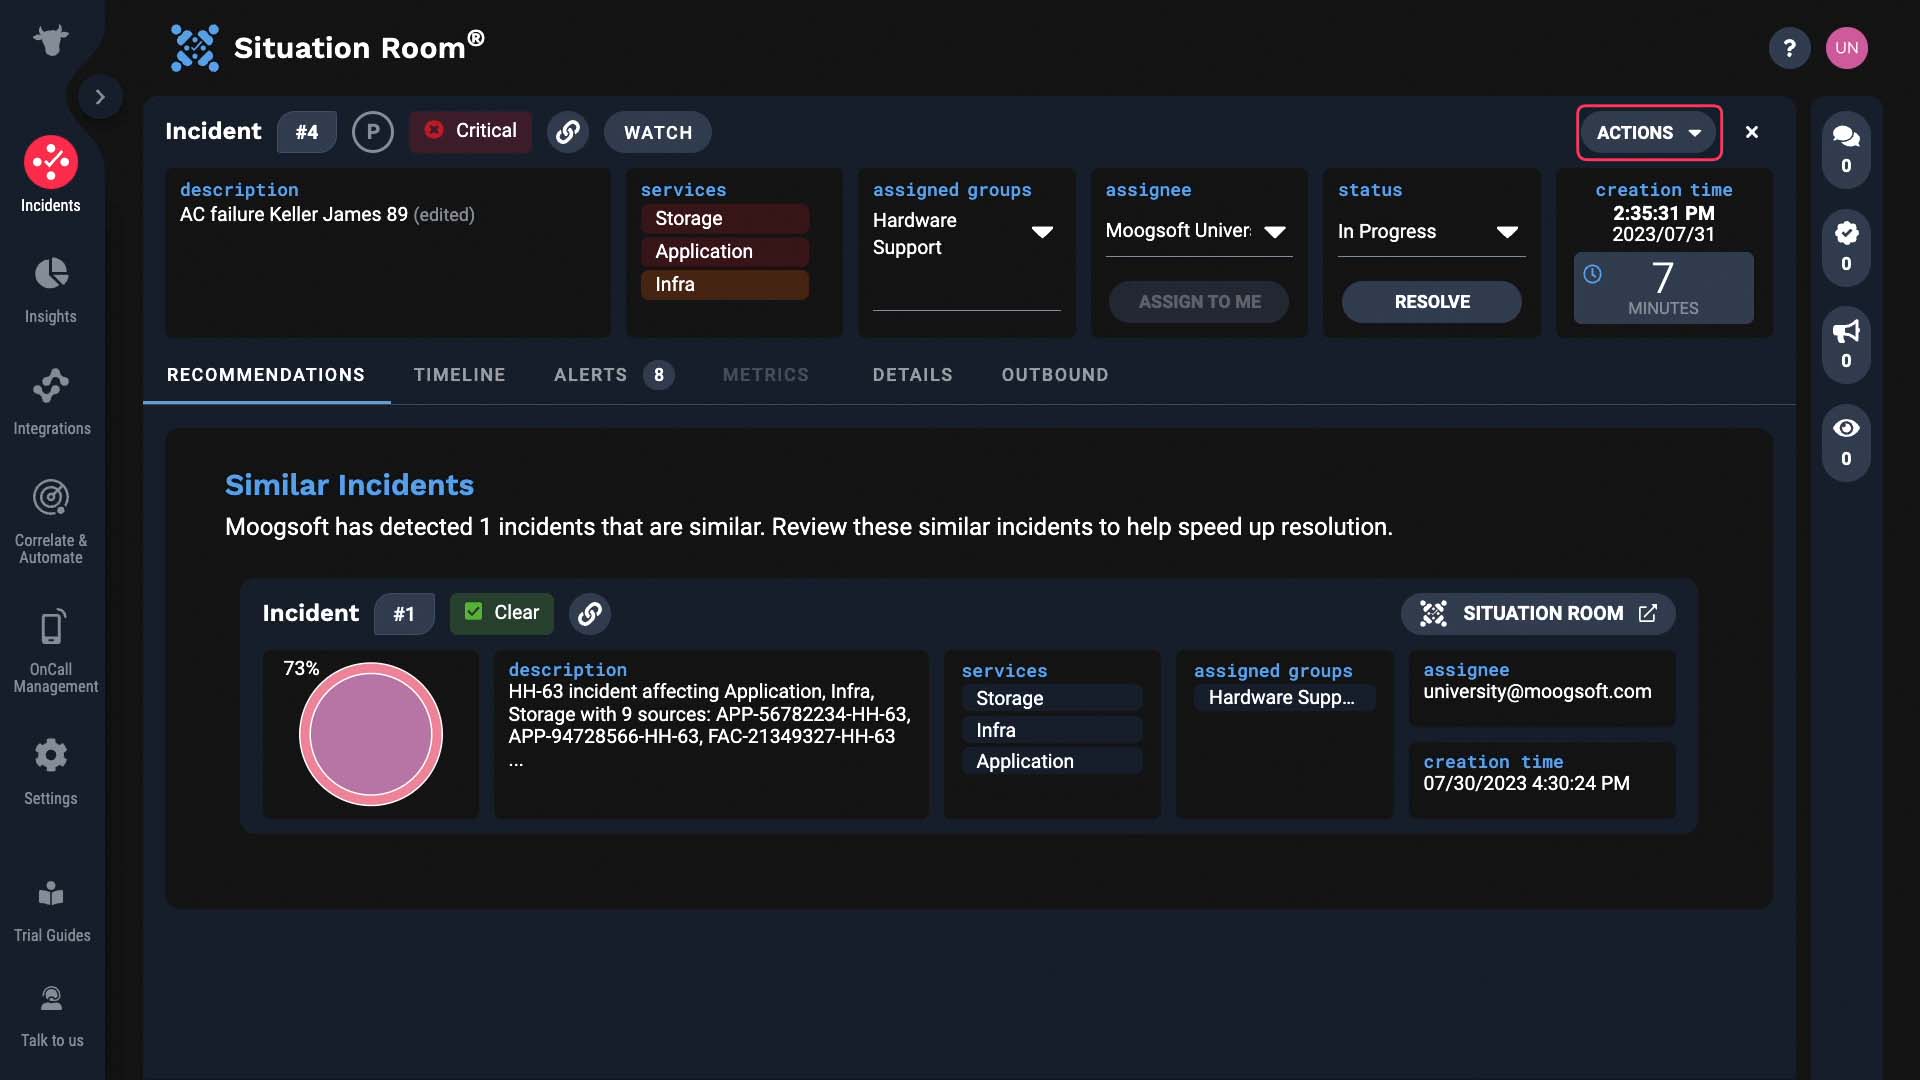
For example, in our environment you can go here to send this incident to ServiceNow.
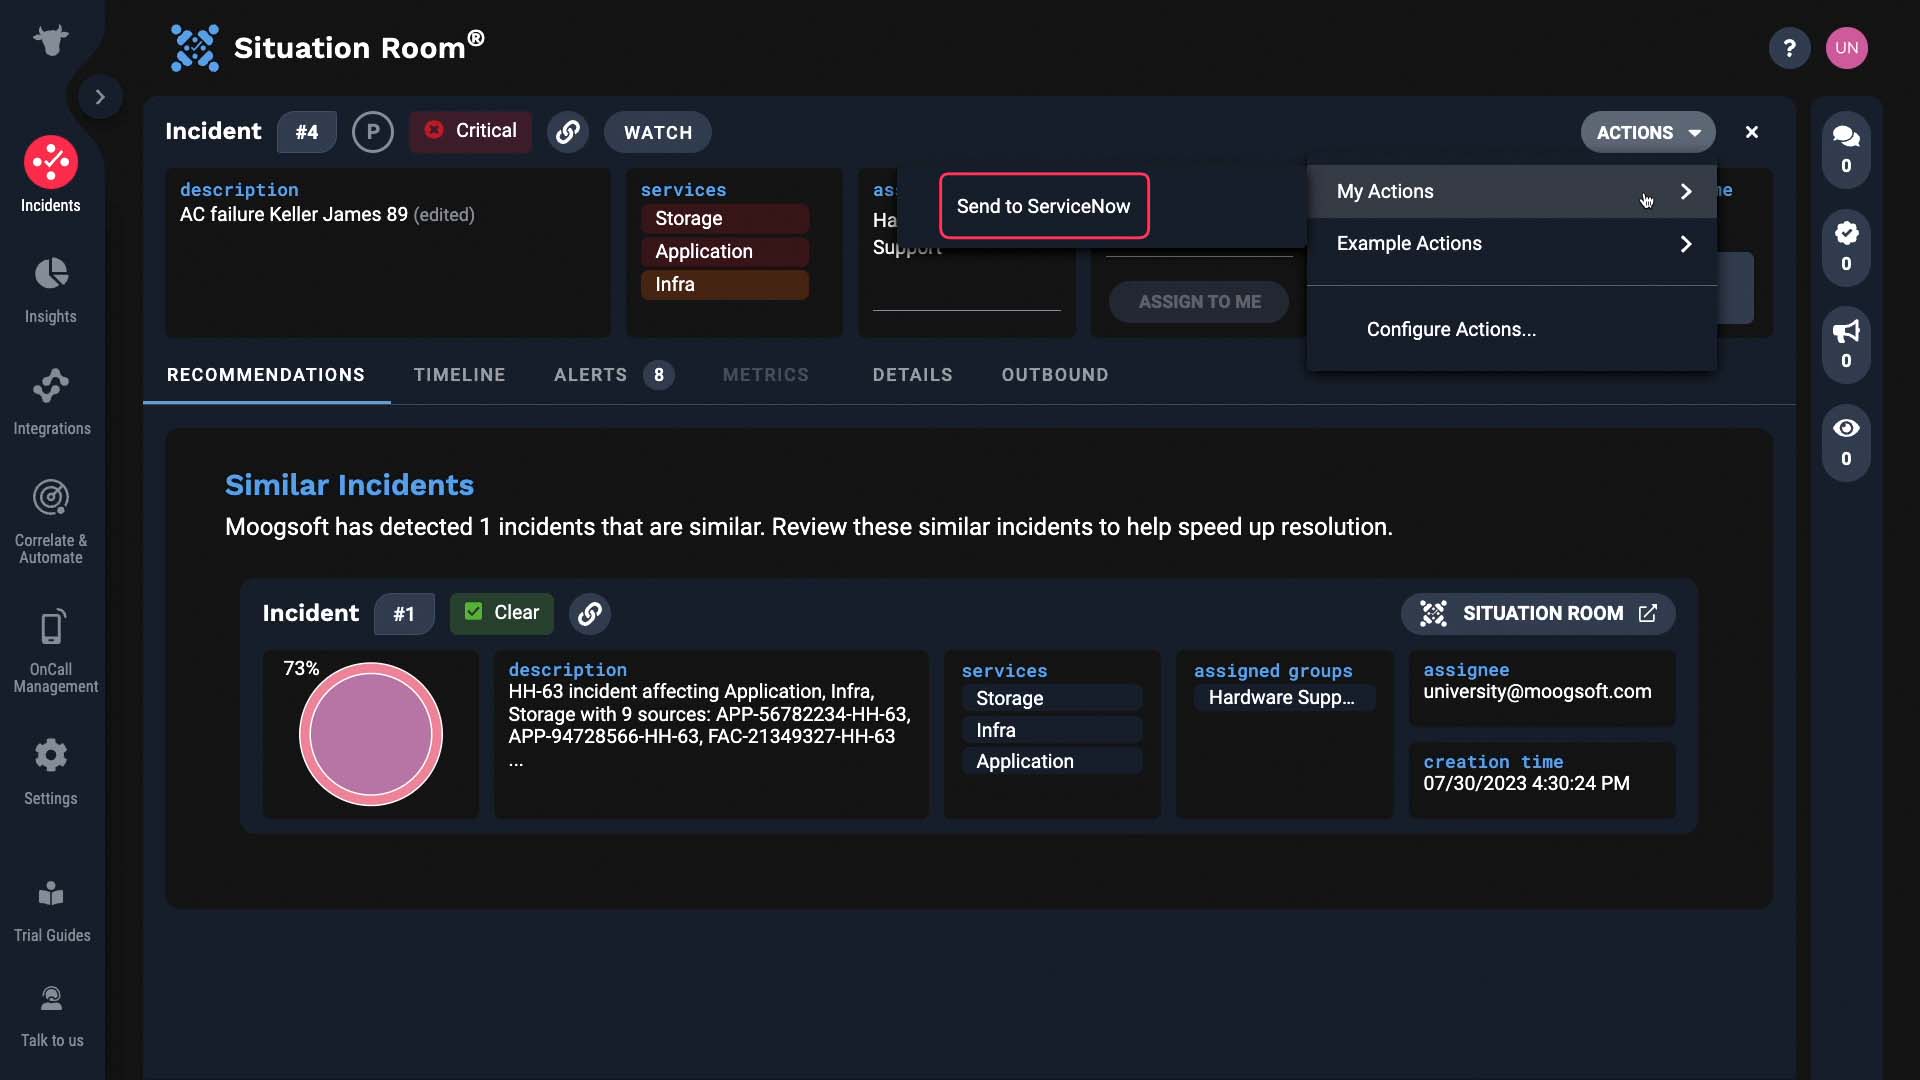
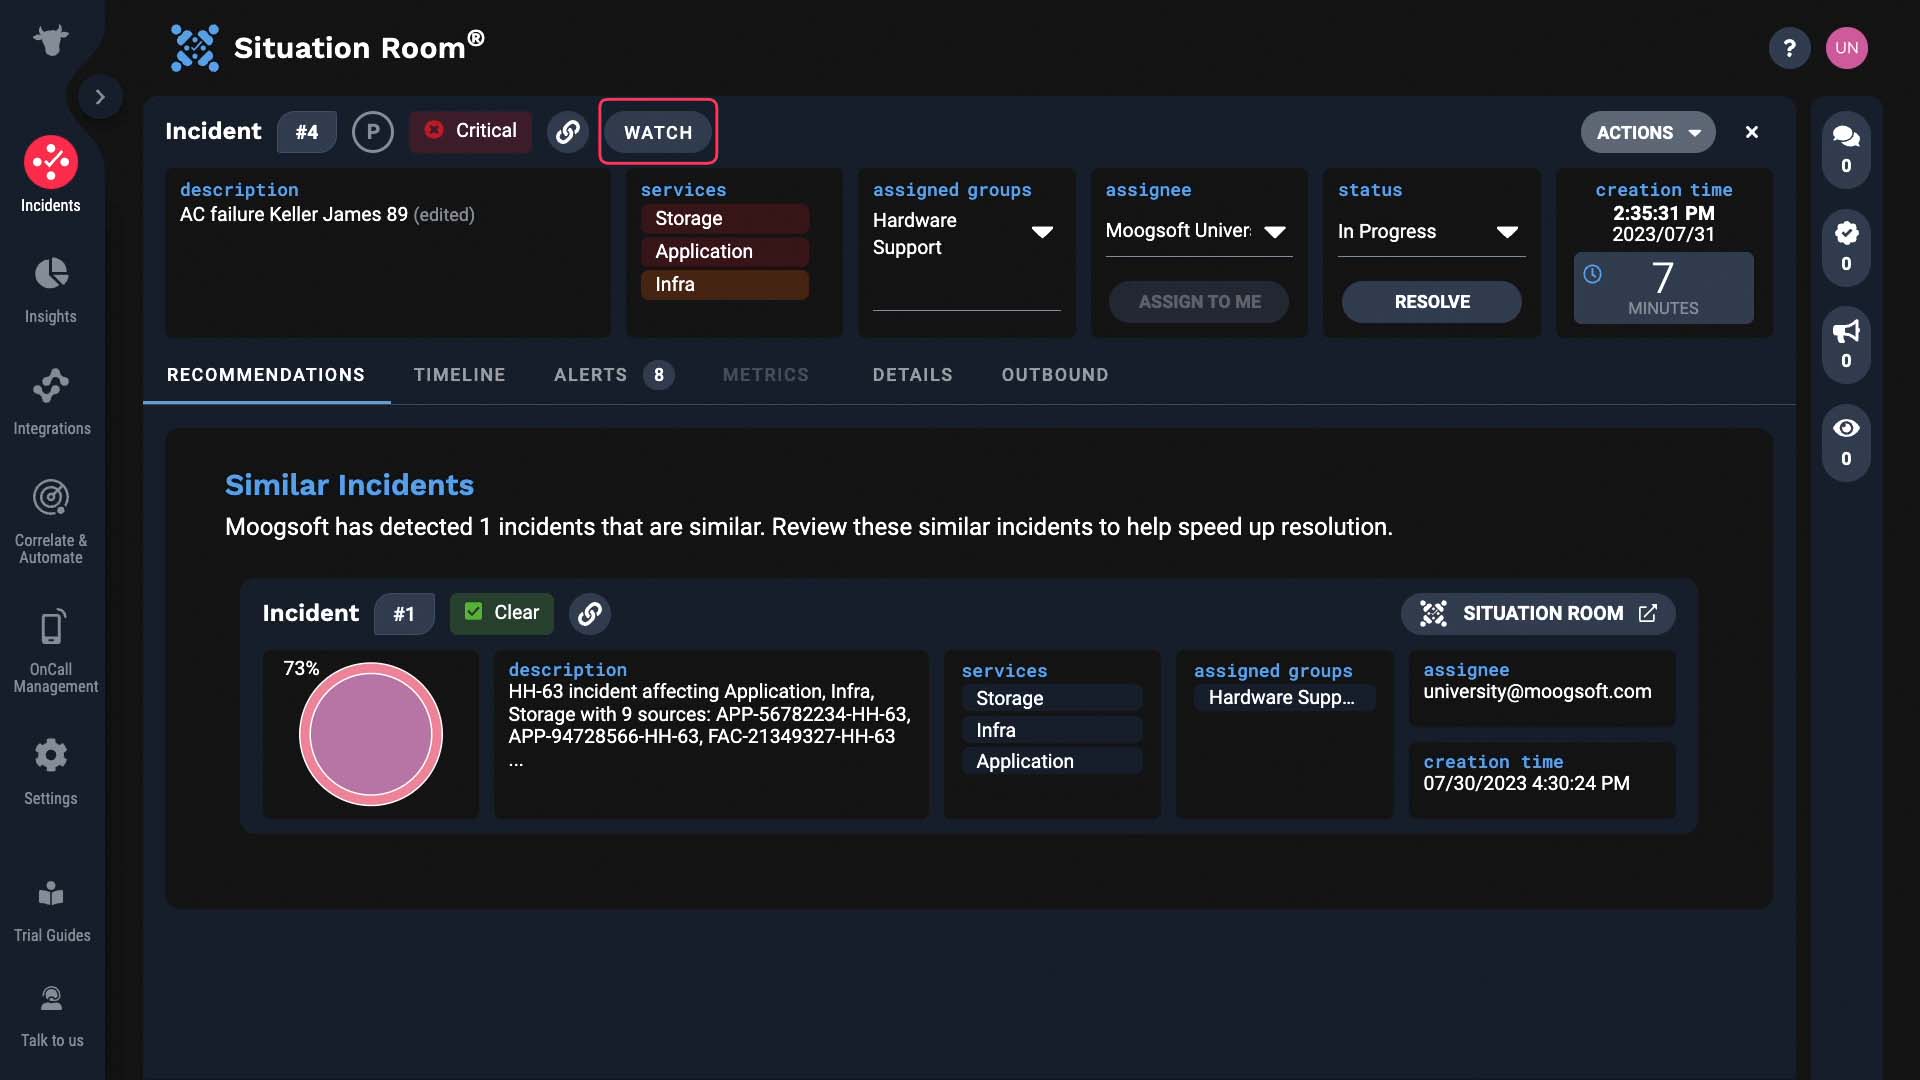
Maybe you don’t need to be actively working on this incident, but just want to stay informed. Then click on the watch button.
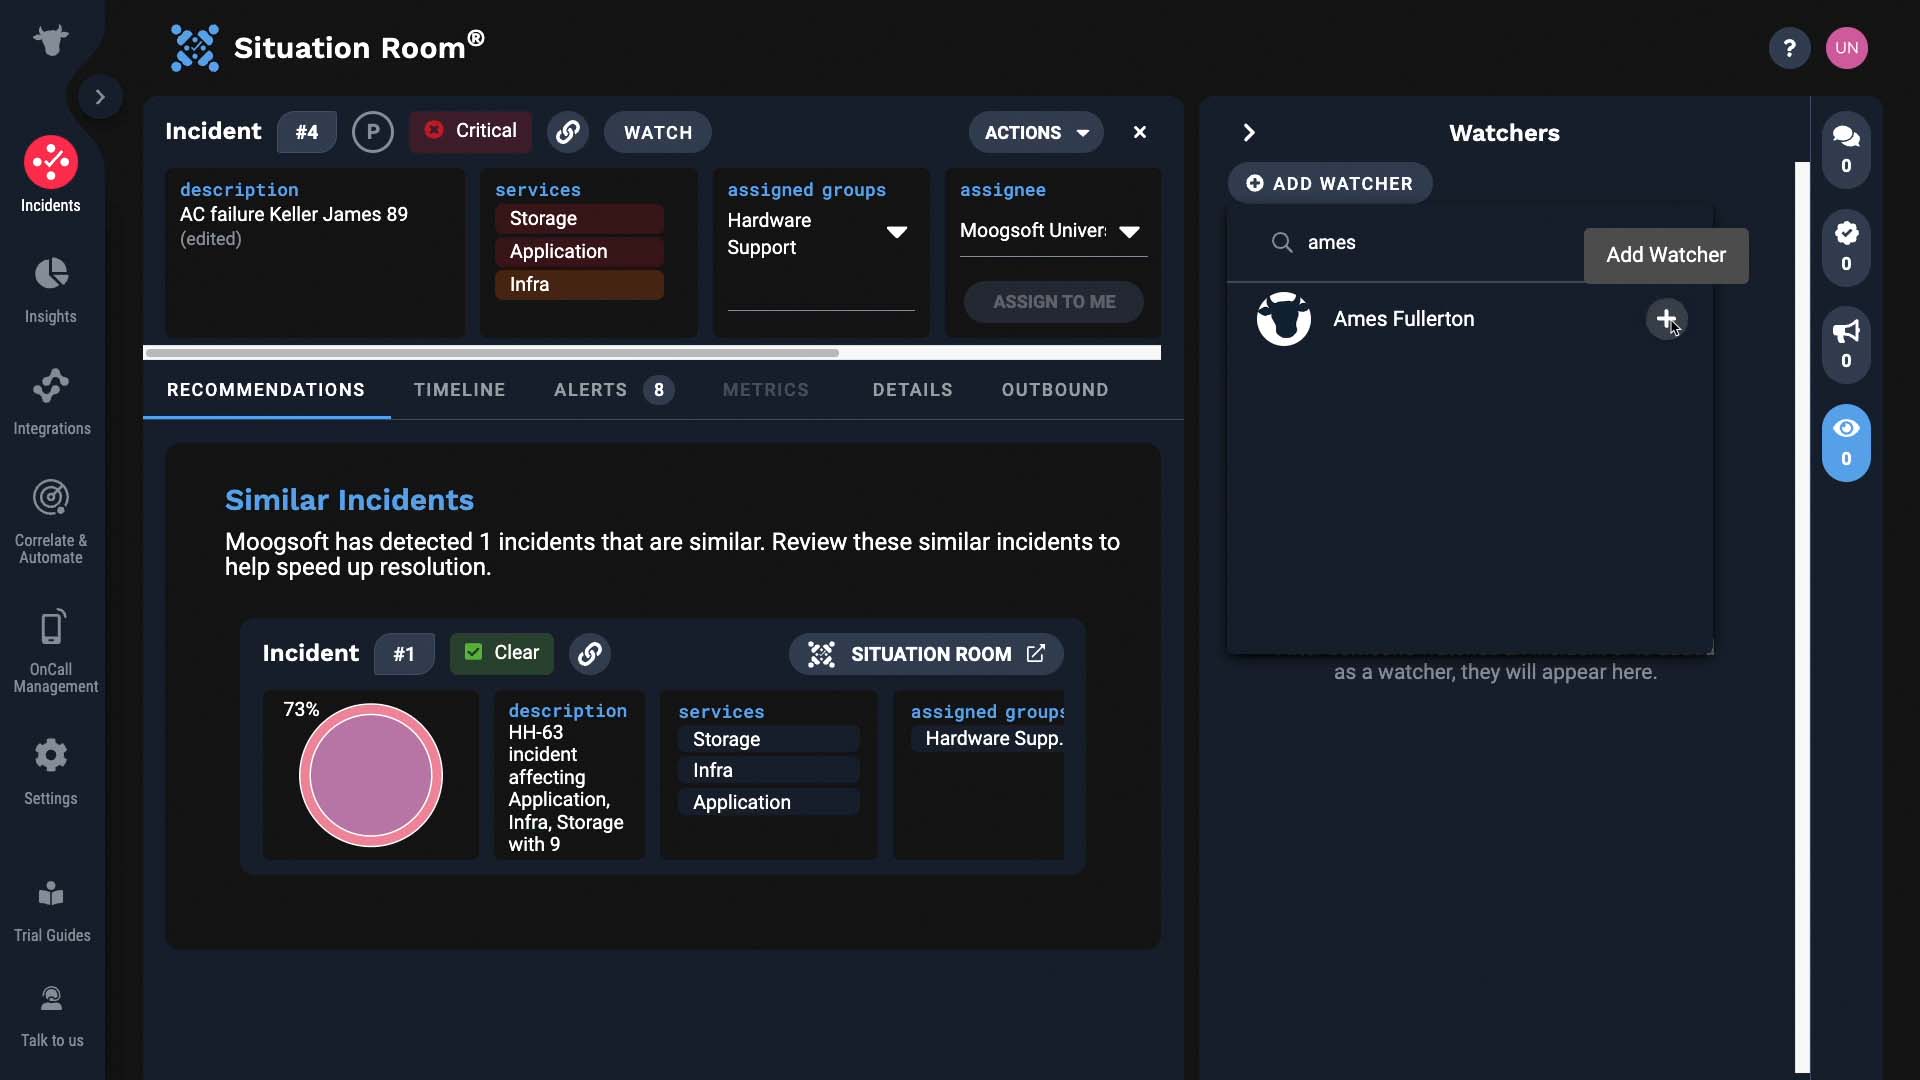
You can add people other than yourself to watch the incident, too.
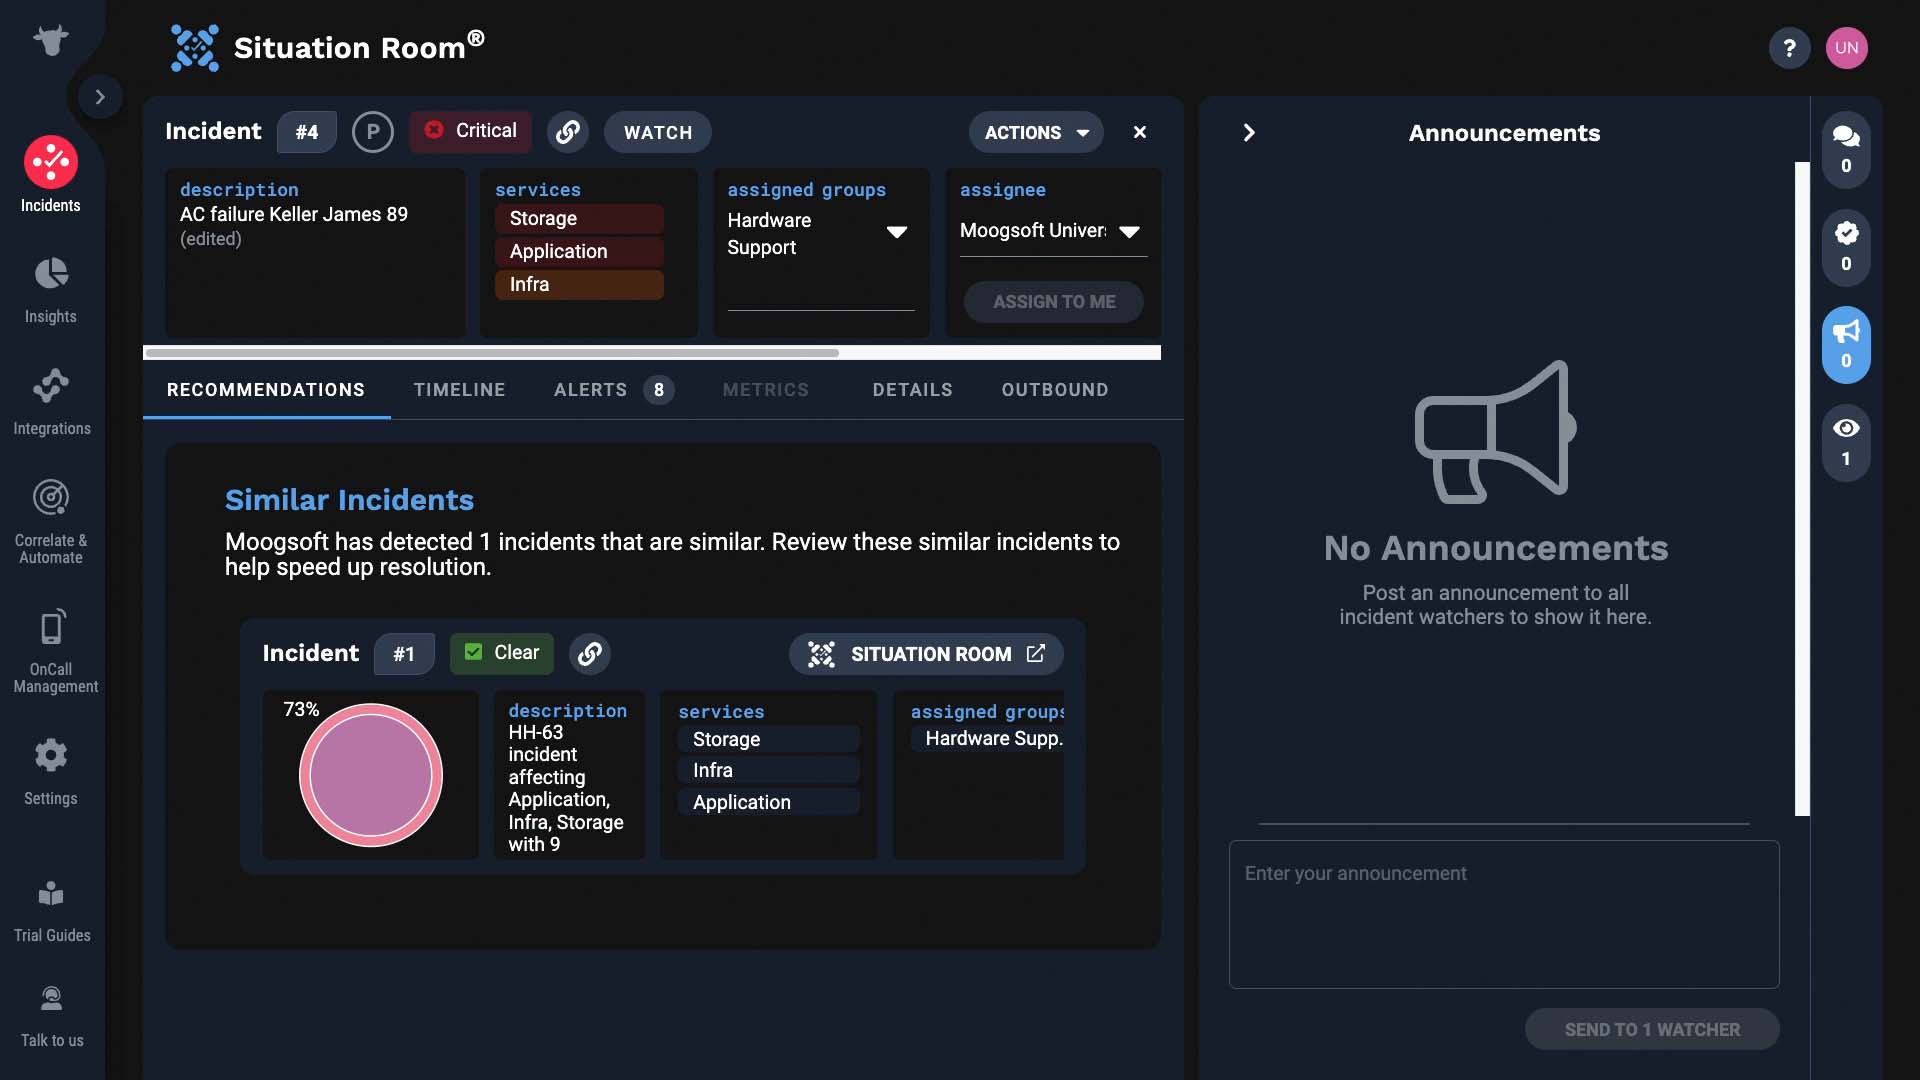
Now whenever there’s an announcement about this incident added here, the watchers will receive a notification.
If you want to set priority for your incidents, you can do so here. Then you can sort by priority and tackle the incidents with higher priority.
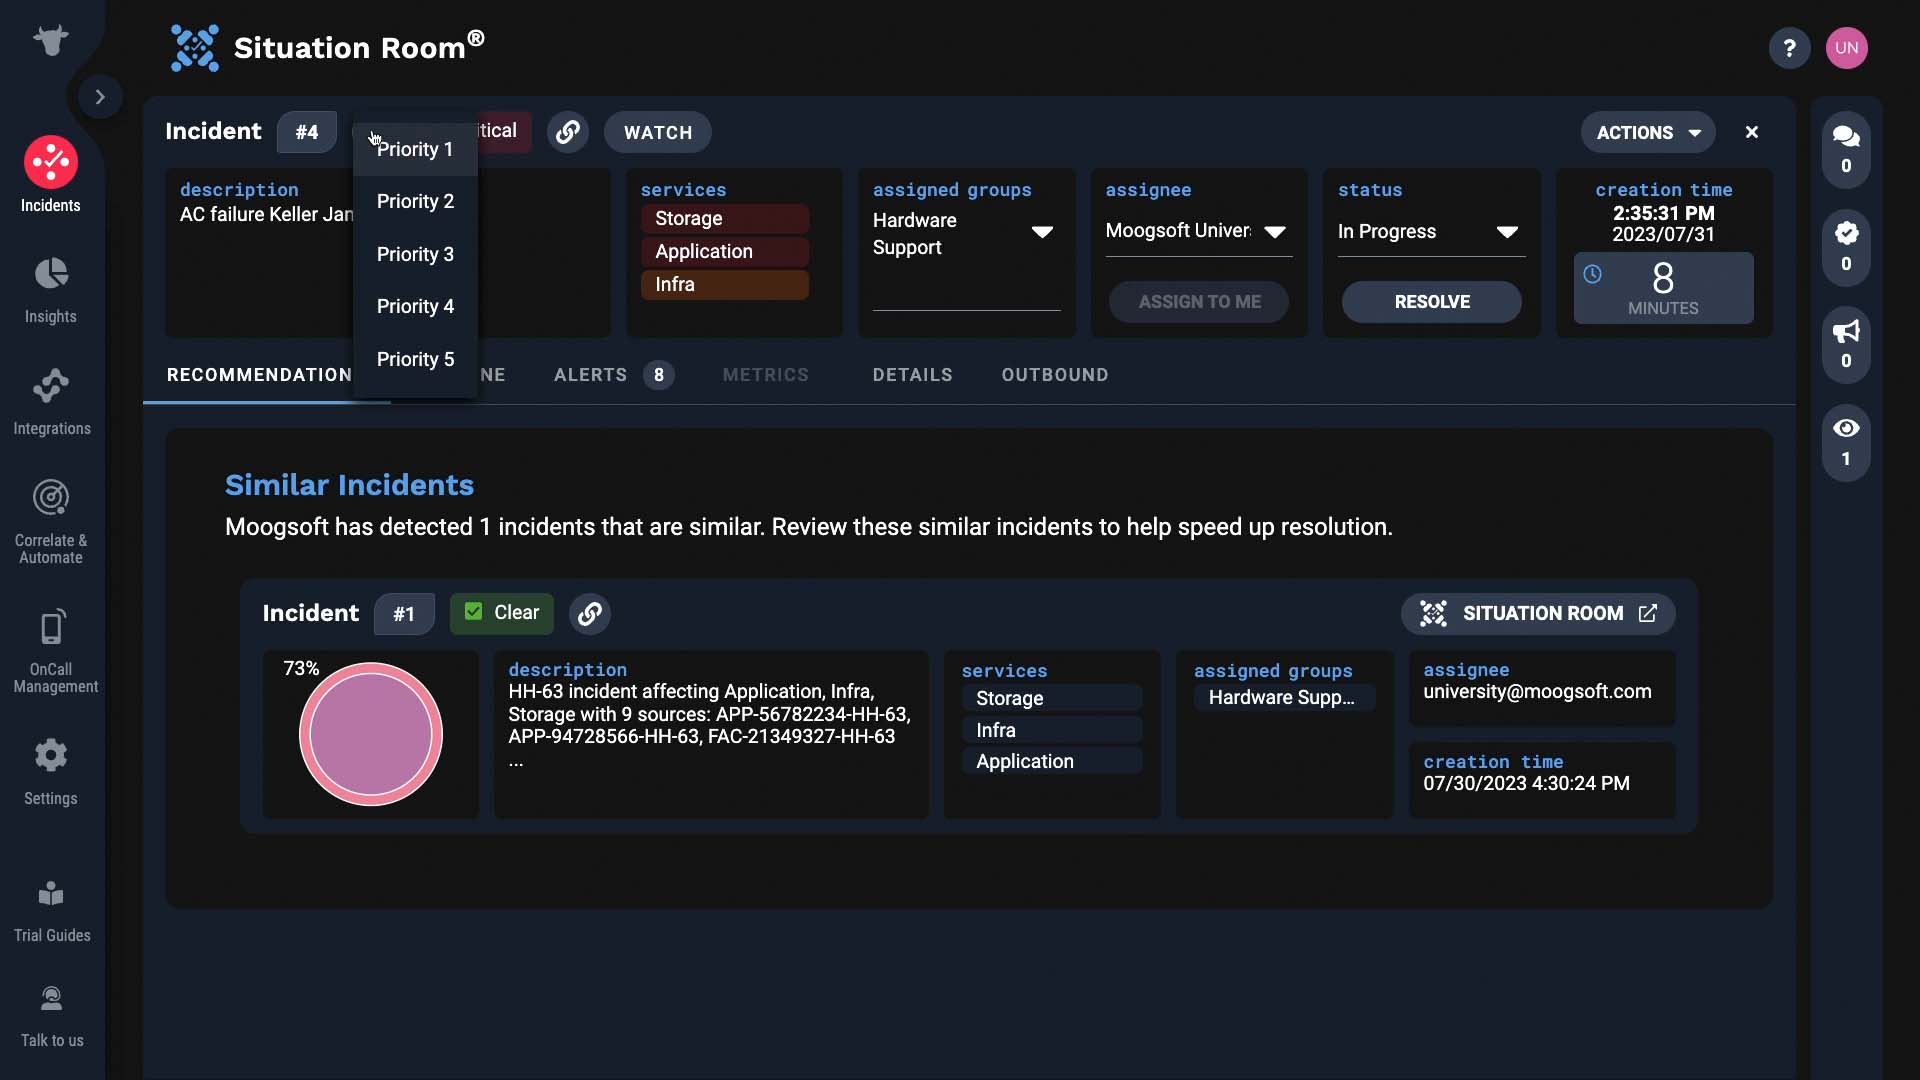
Now you are familiar with the top section of the situation room. Make sure to check out the other Situation Room deep dive videos!
BASIC | 2 MIN
This video shows you how to use the comments pane for collaboration, notifications, and keeping track of how you resolve incidents.
Use case walkthrough: Comments in Situation Room ►
This video steps through a use case for using comments in the Situation Room to collaborate with team members and stakeholders.
*Please note Moogsoft is now part of Dell's IT Operations solution called APEX AIOps, and changed its name to APEX AIOps Incident Management. The UI in this video may differ slightly but the content covered is still relevant.
The comments tab lets you collaborate with your team easily.
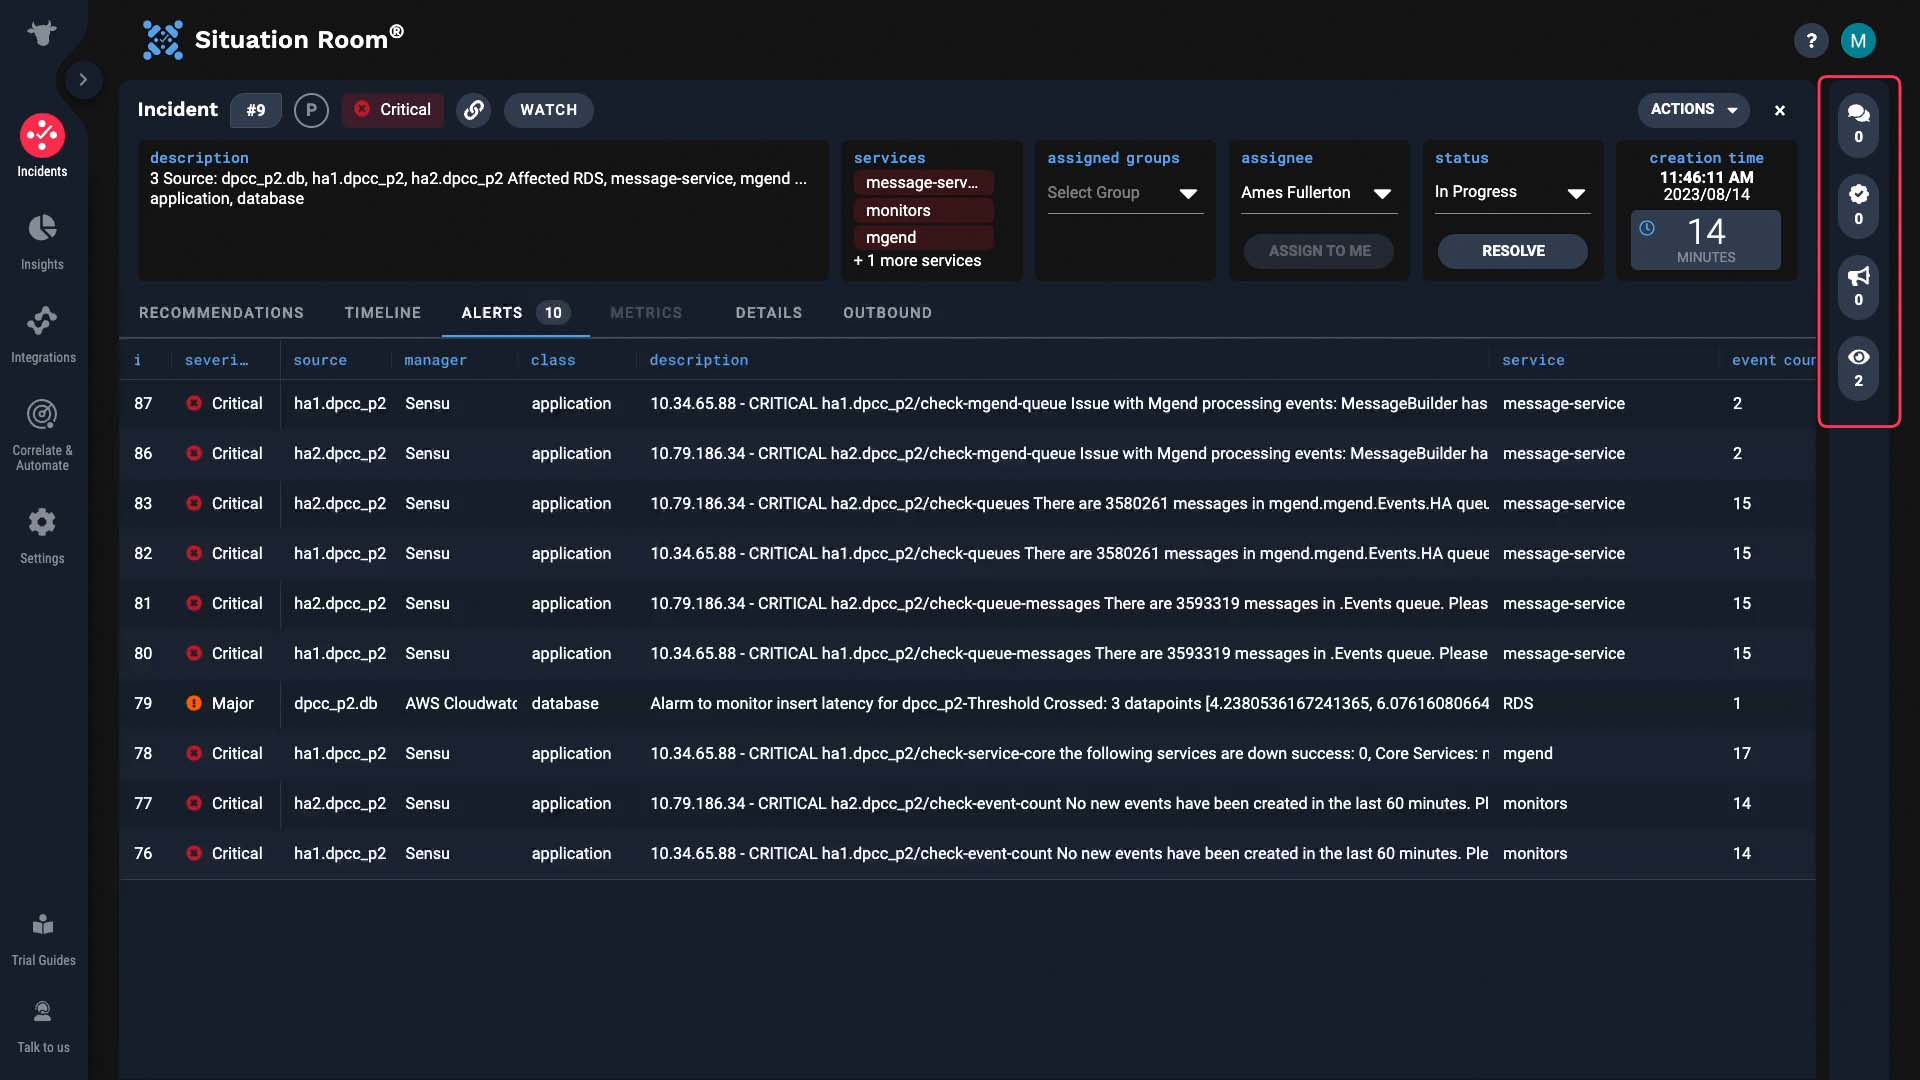
As you work through an incident, all participants can chat in the comments tab.
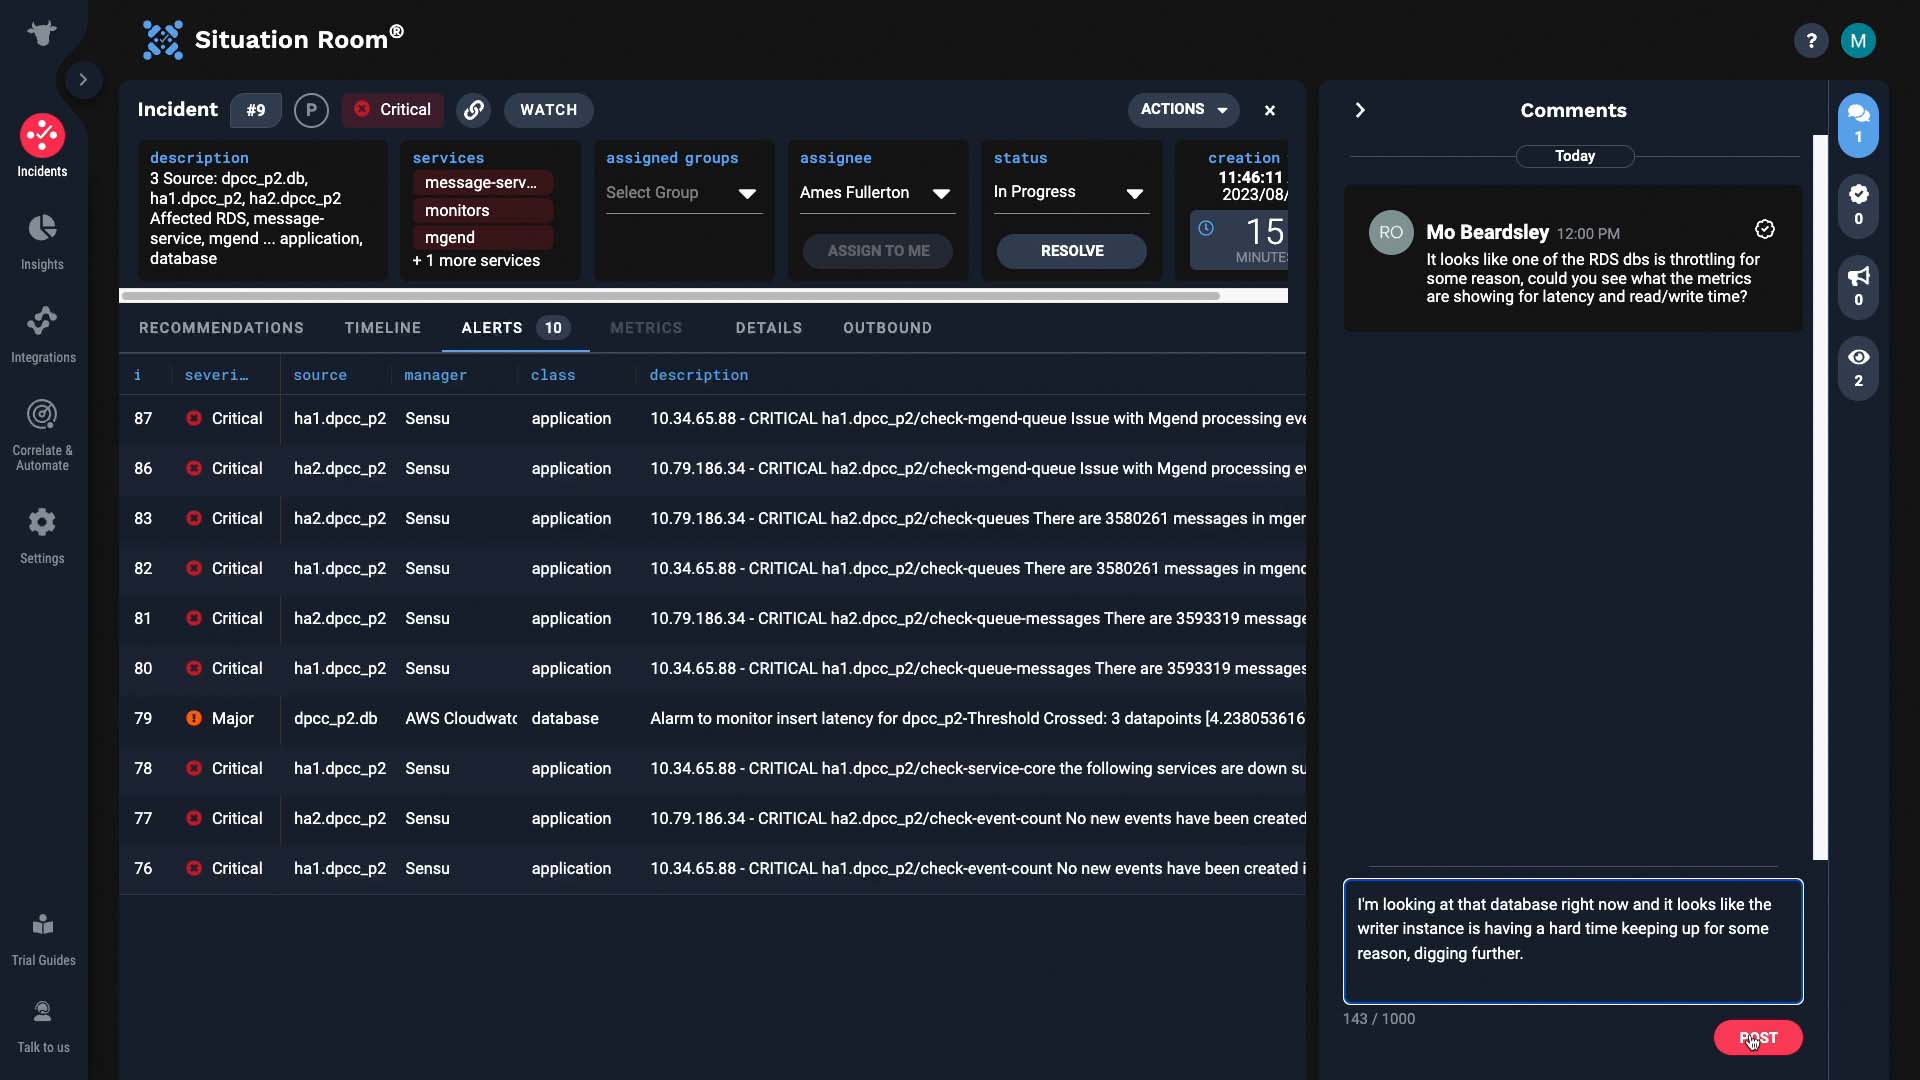
If you want to update stakeholders who aren’t actively working in the situation room with you, comment in the announcements tab.
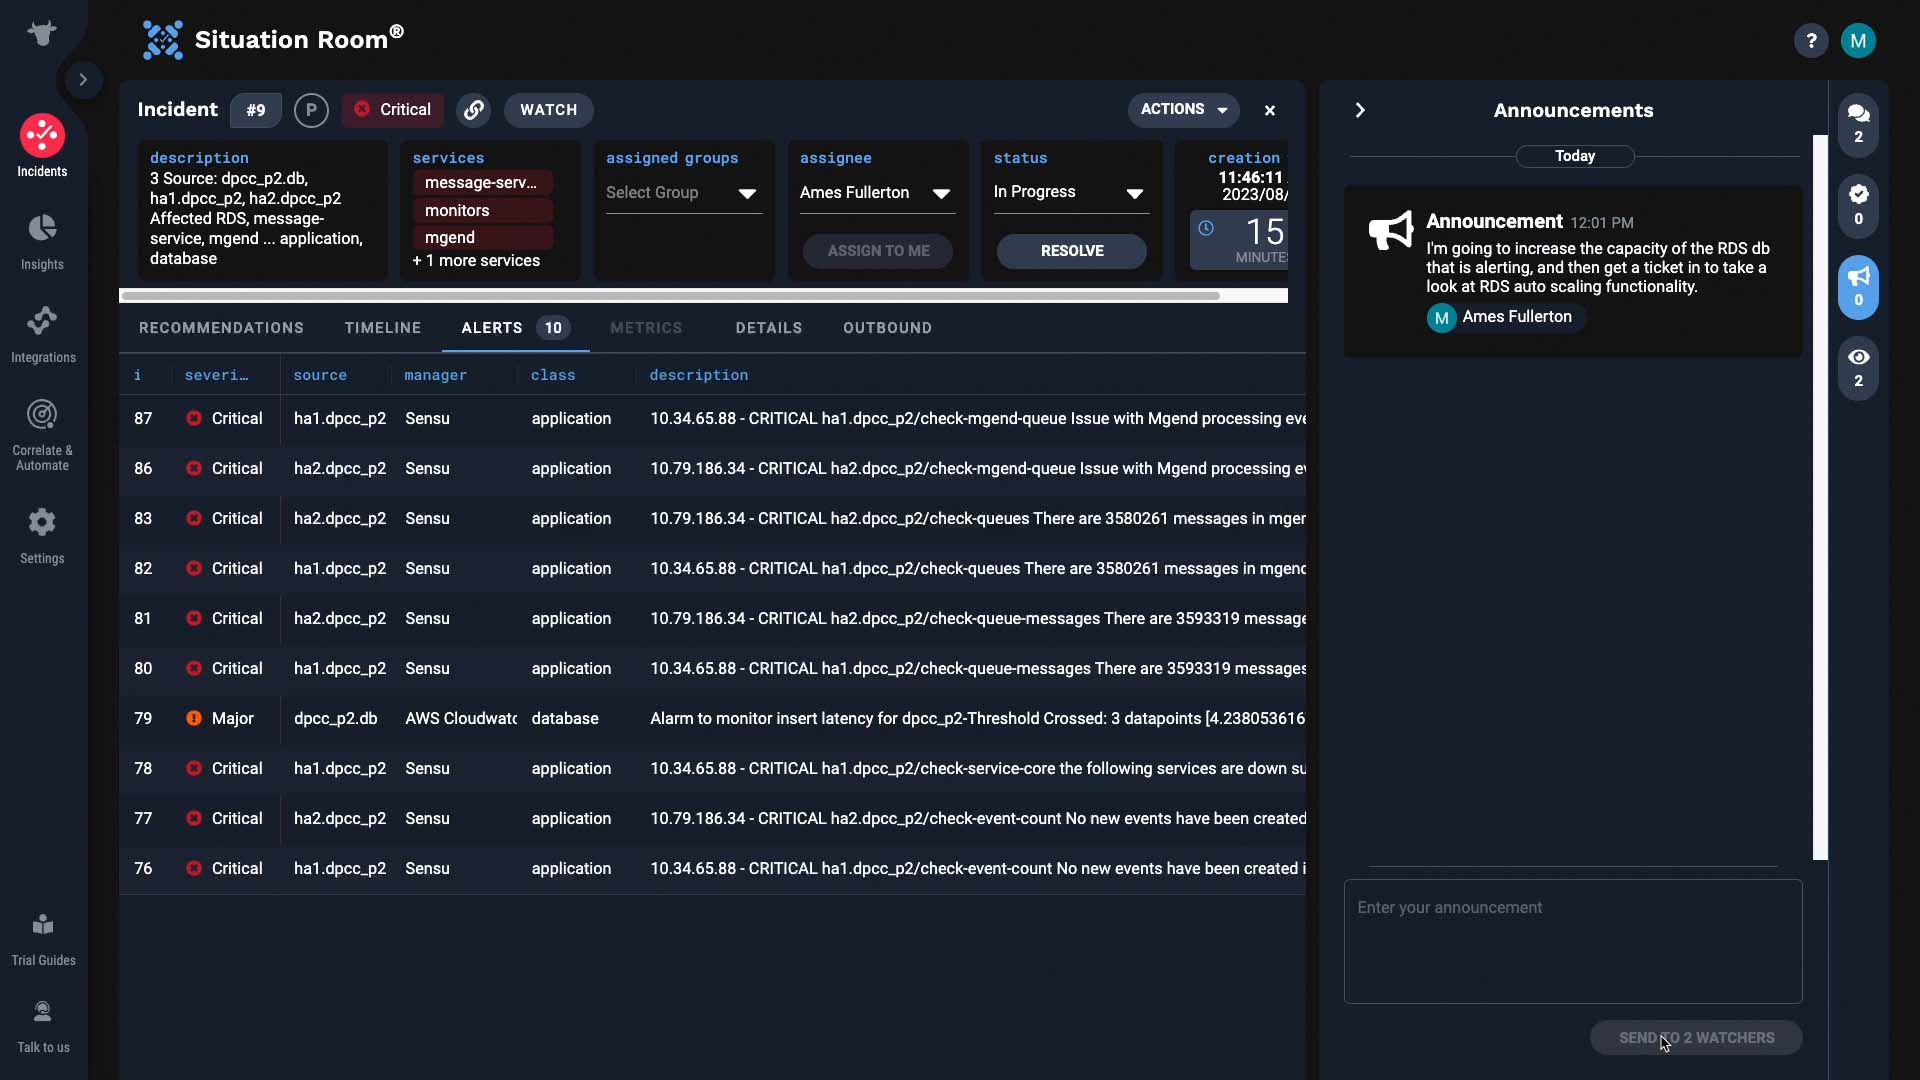
Your comment appears here like any other input...
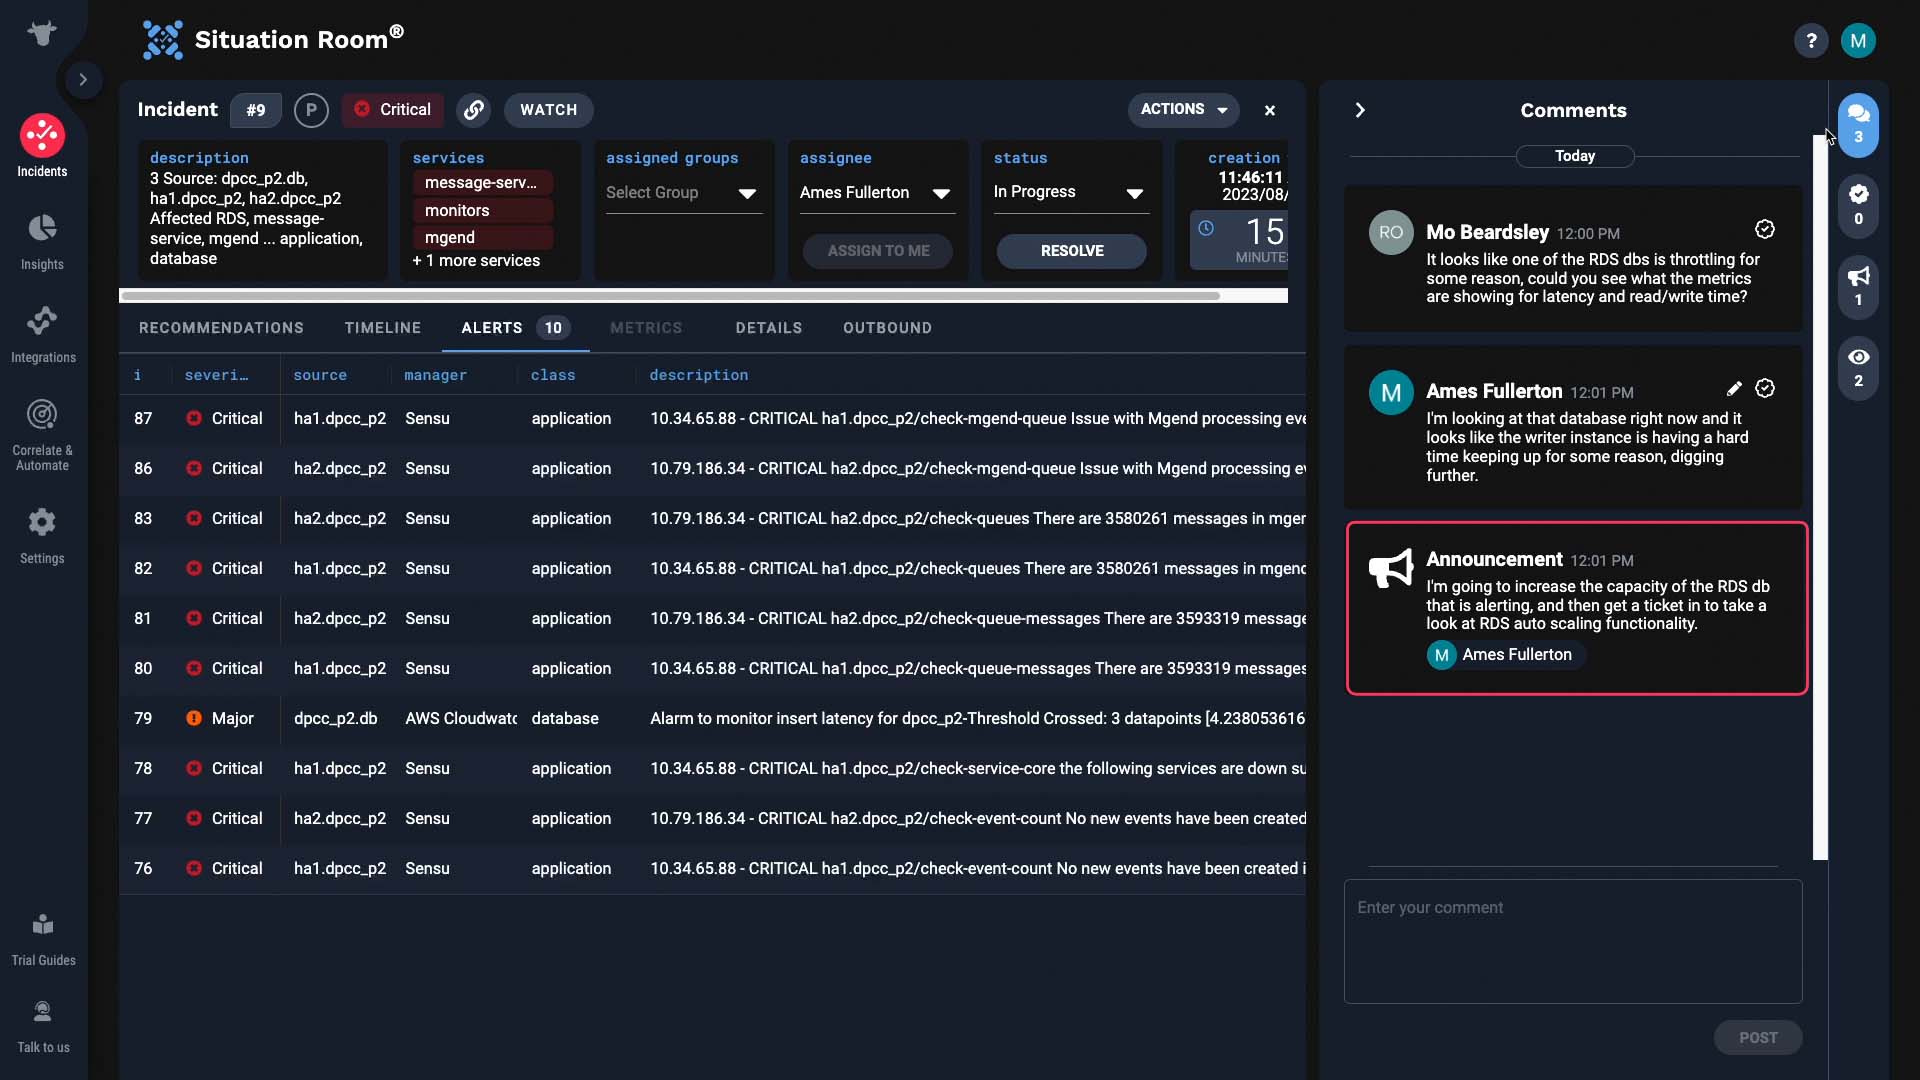
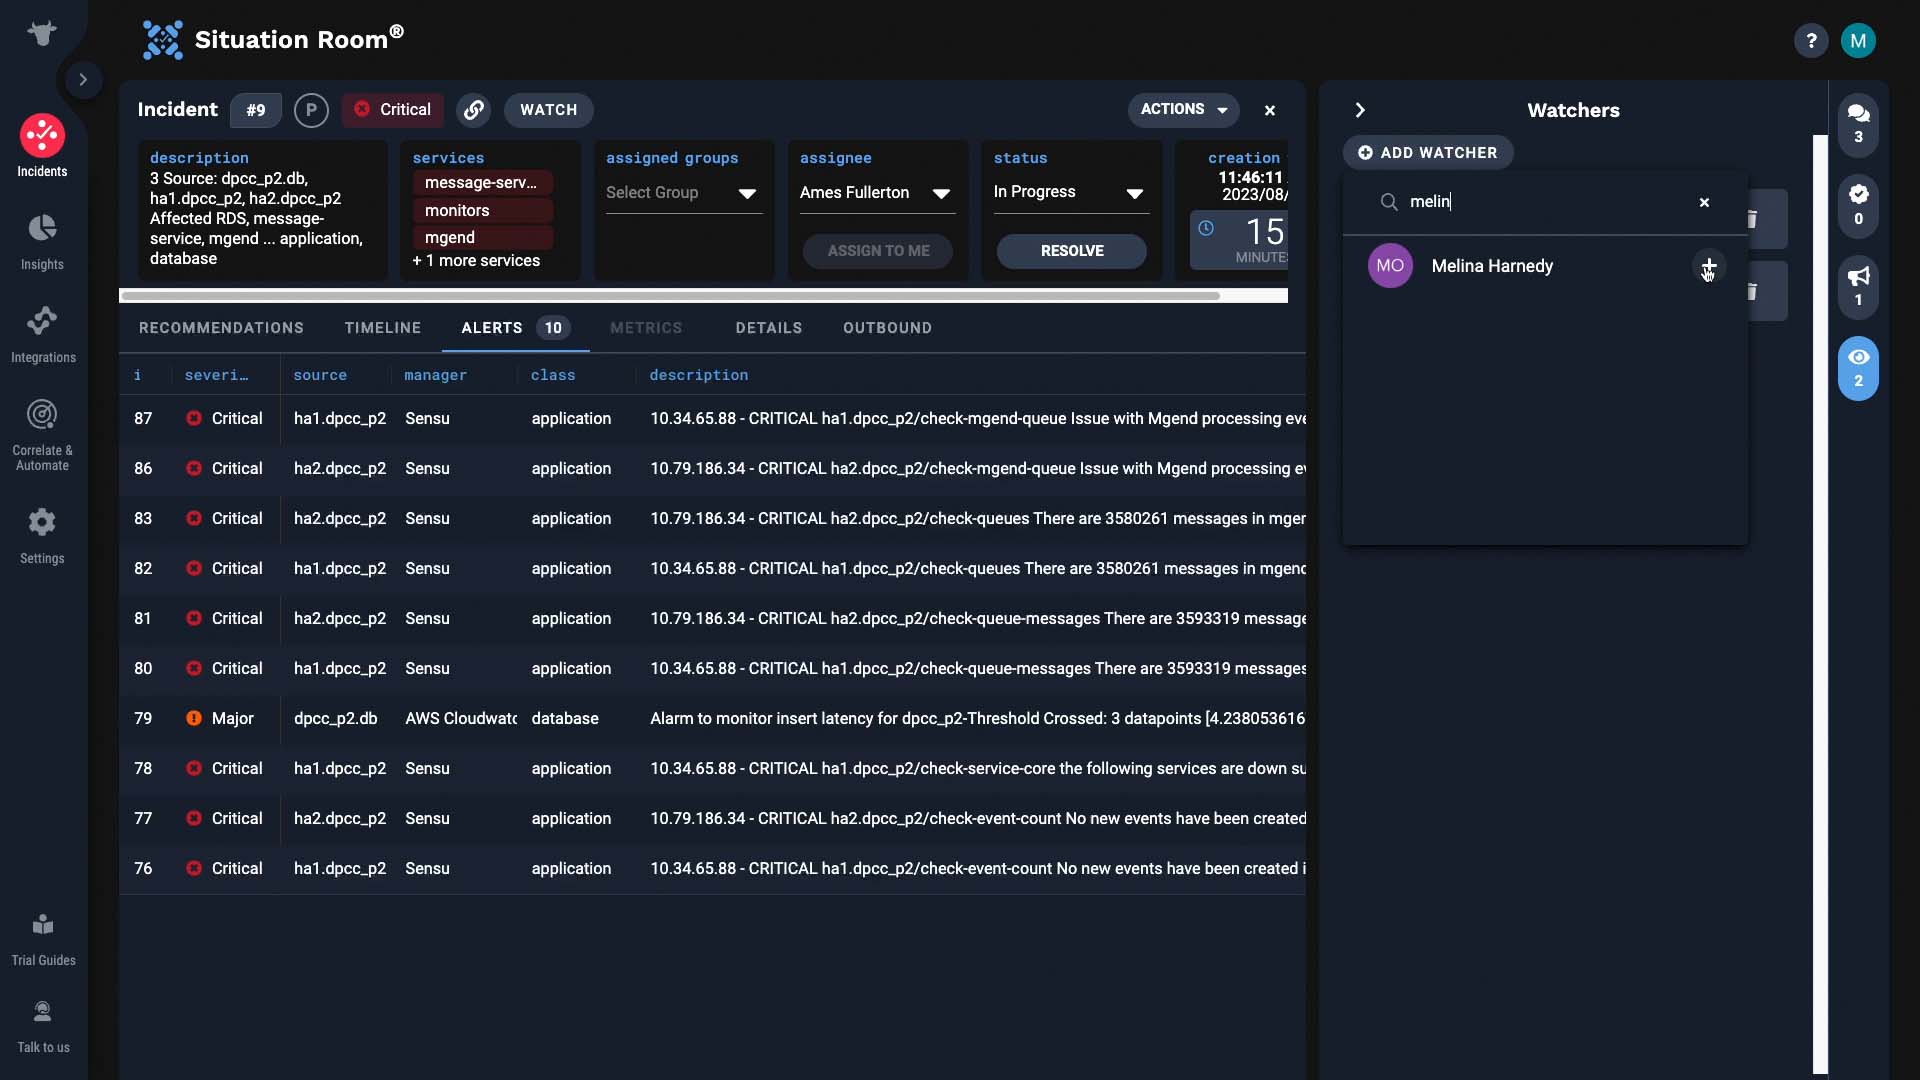
But it is also emailed to these people, keeping them informed about key progress. Someone who should be notified not listed here? You can add them!
When you find out how to fix the problem, log that under the resolving steps tab.
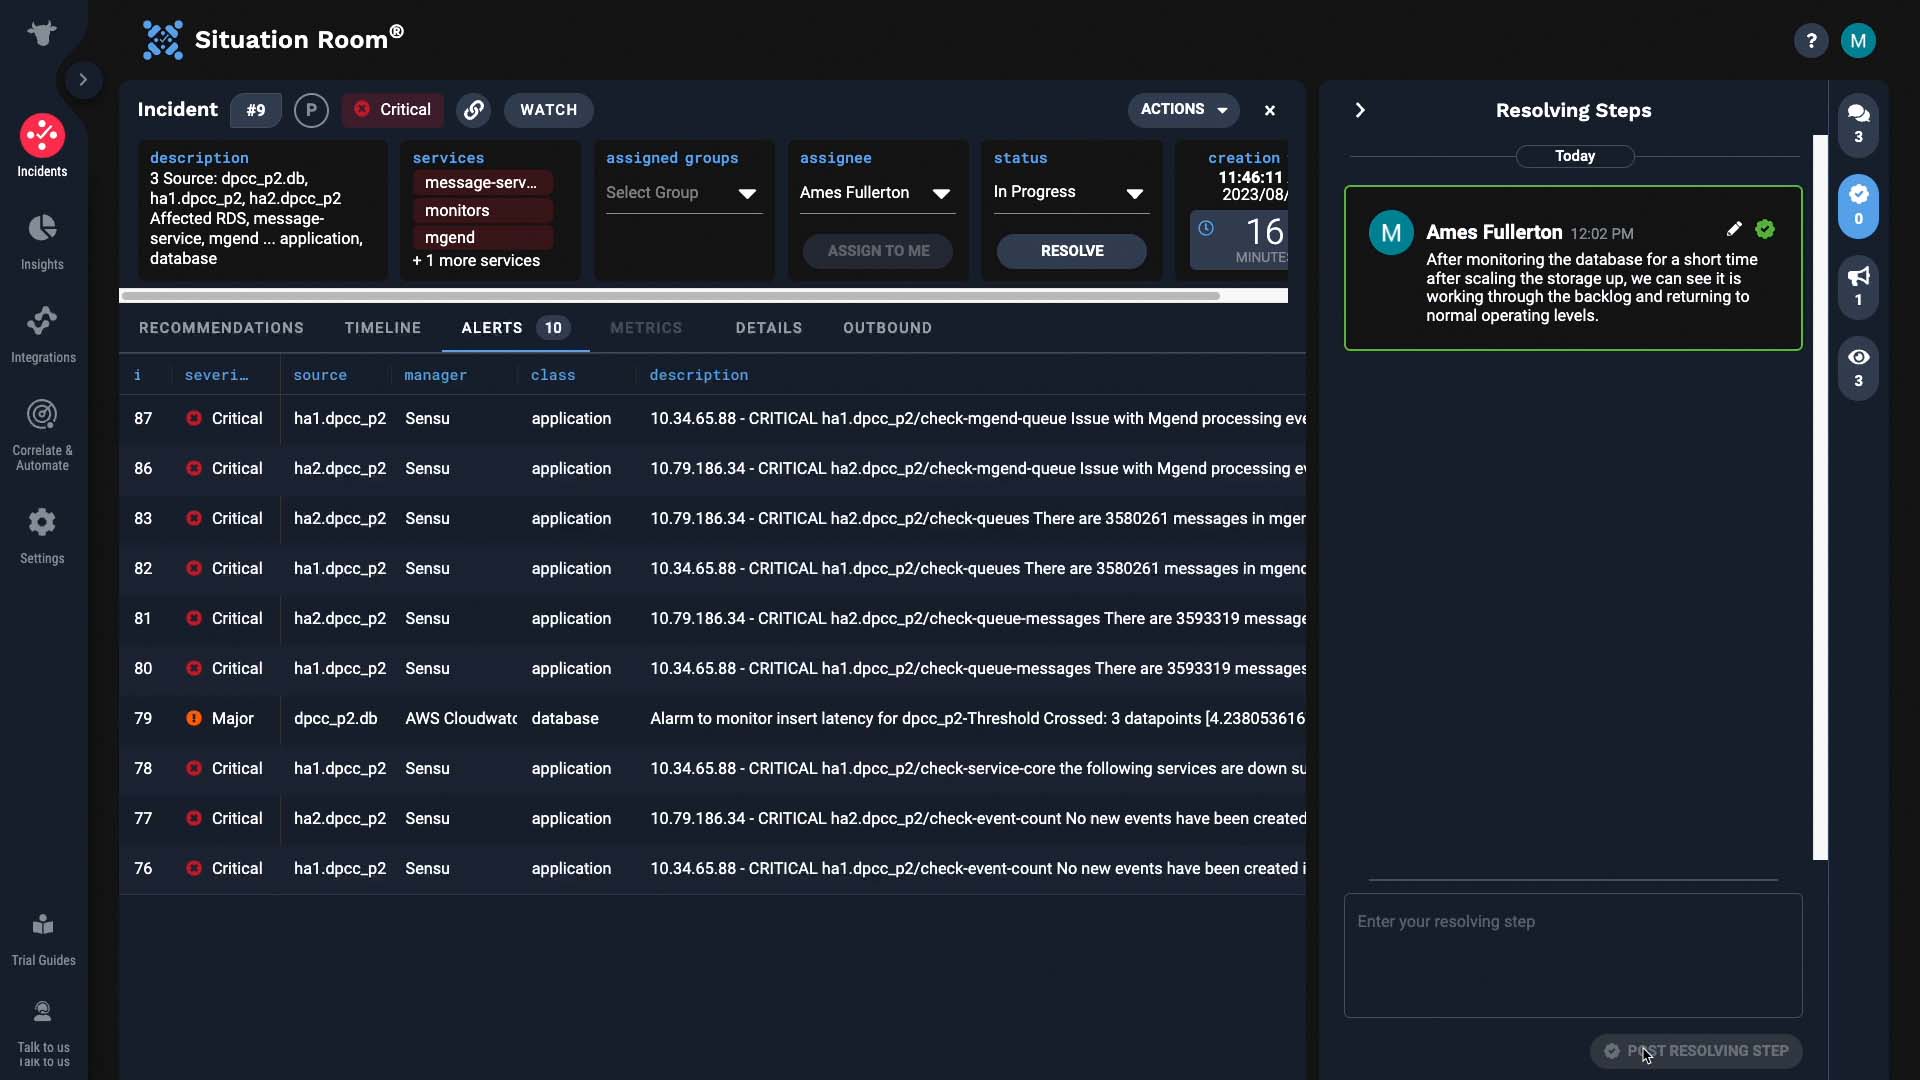
The input also shows up in the comment thread, but there’s more to it.
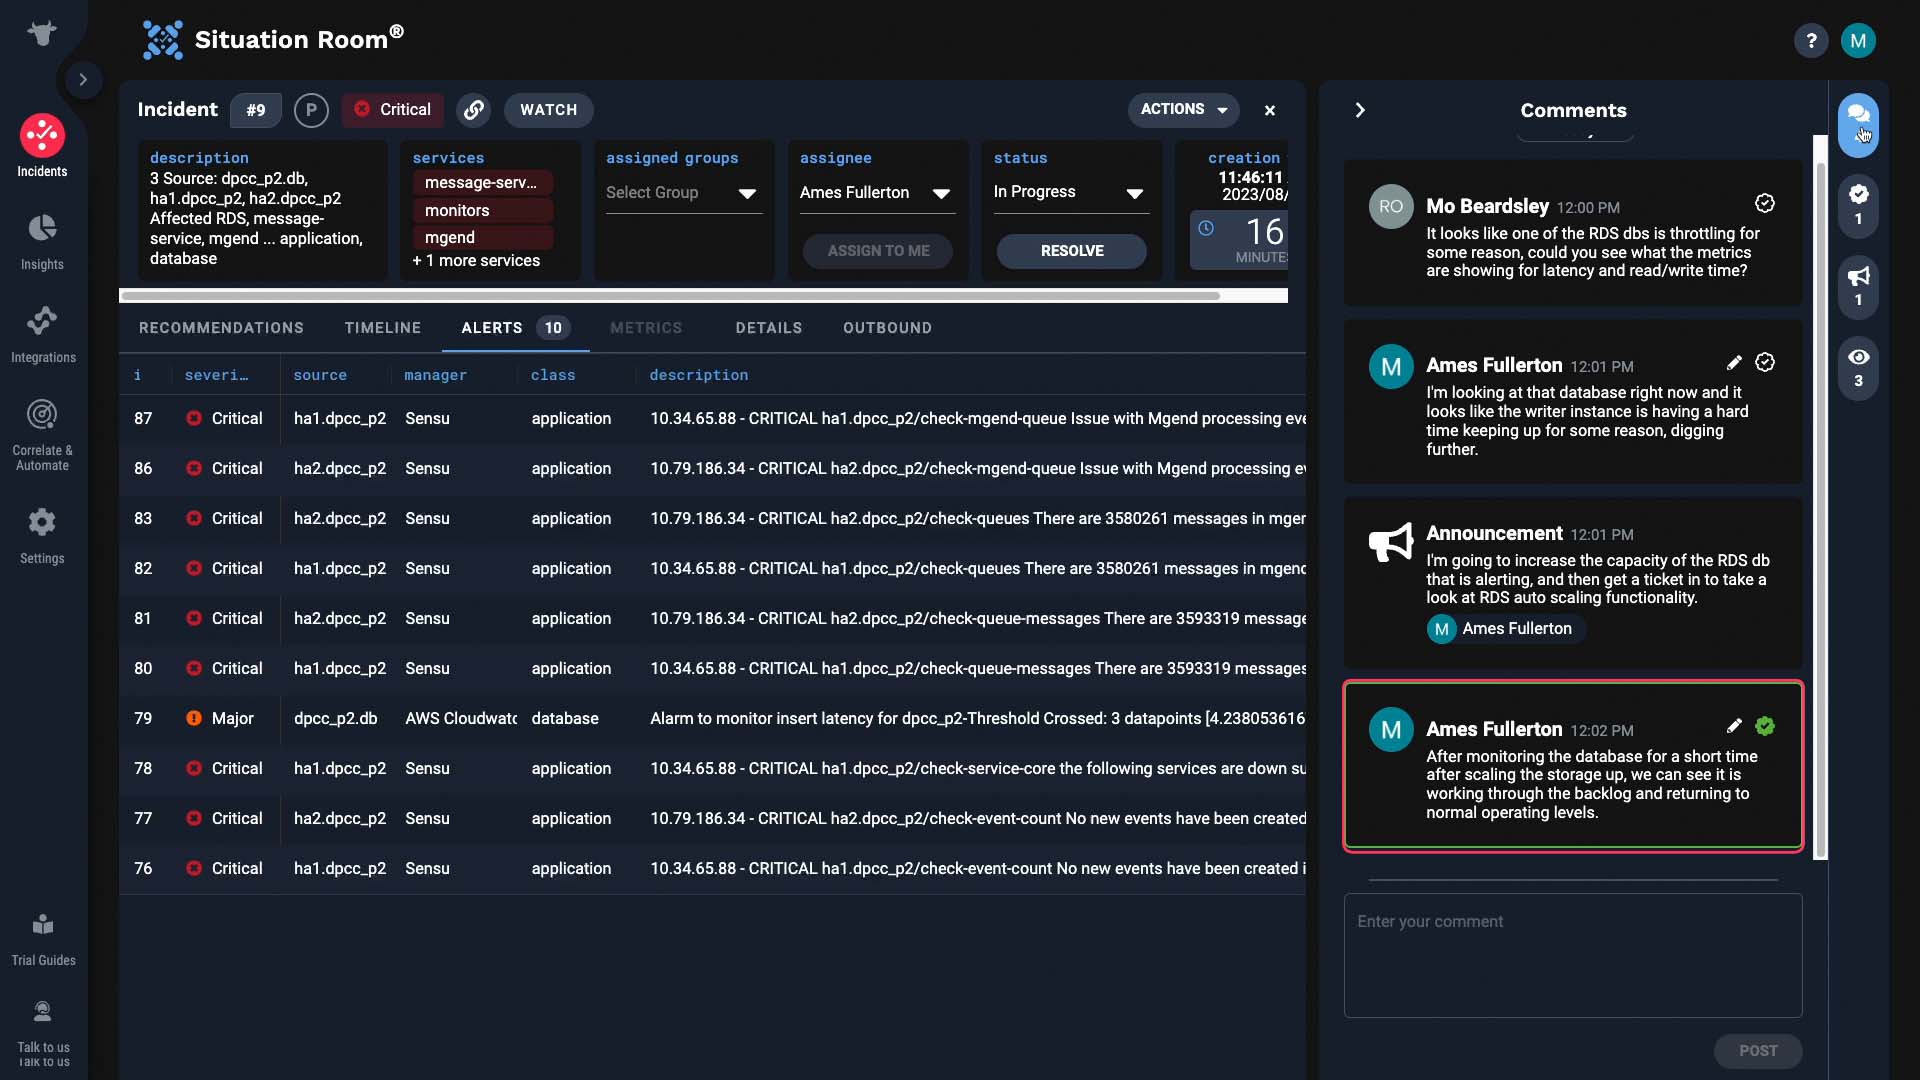
Suppose a similar incident happens in future. Then Incident Management will suggest this incident as related...
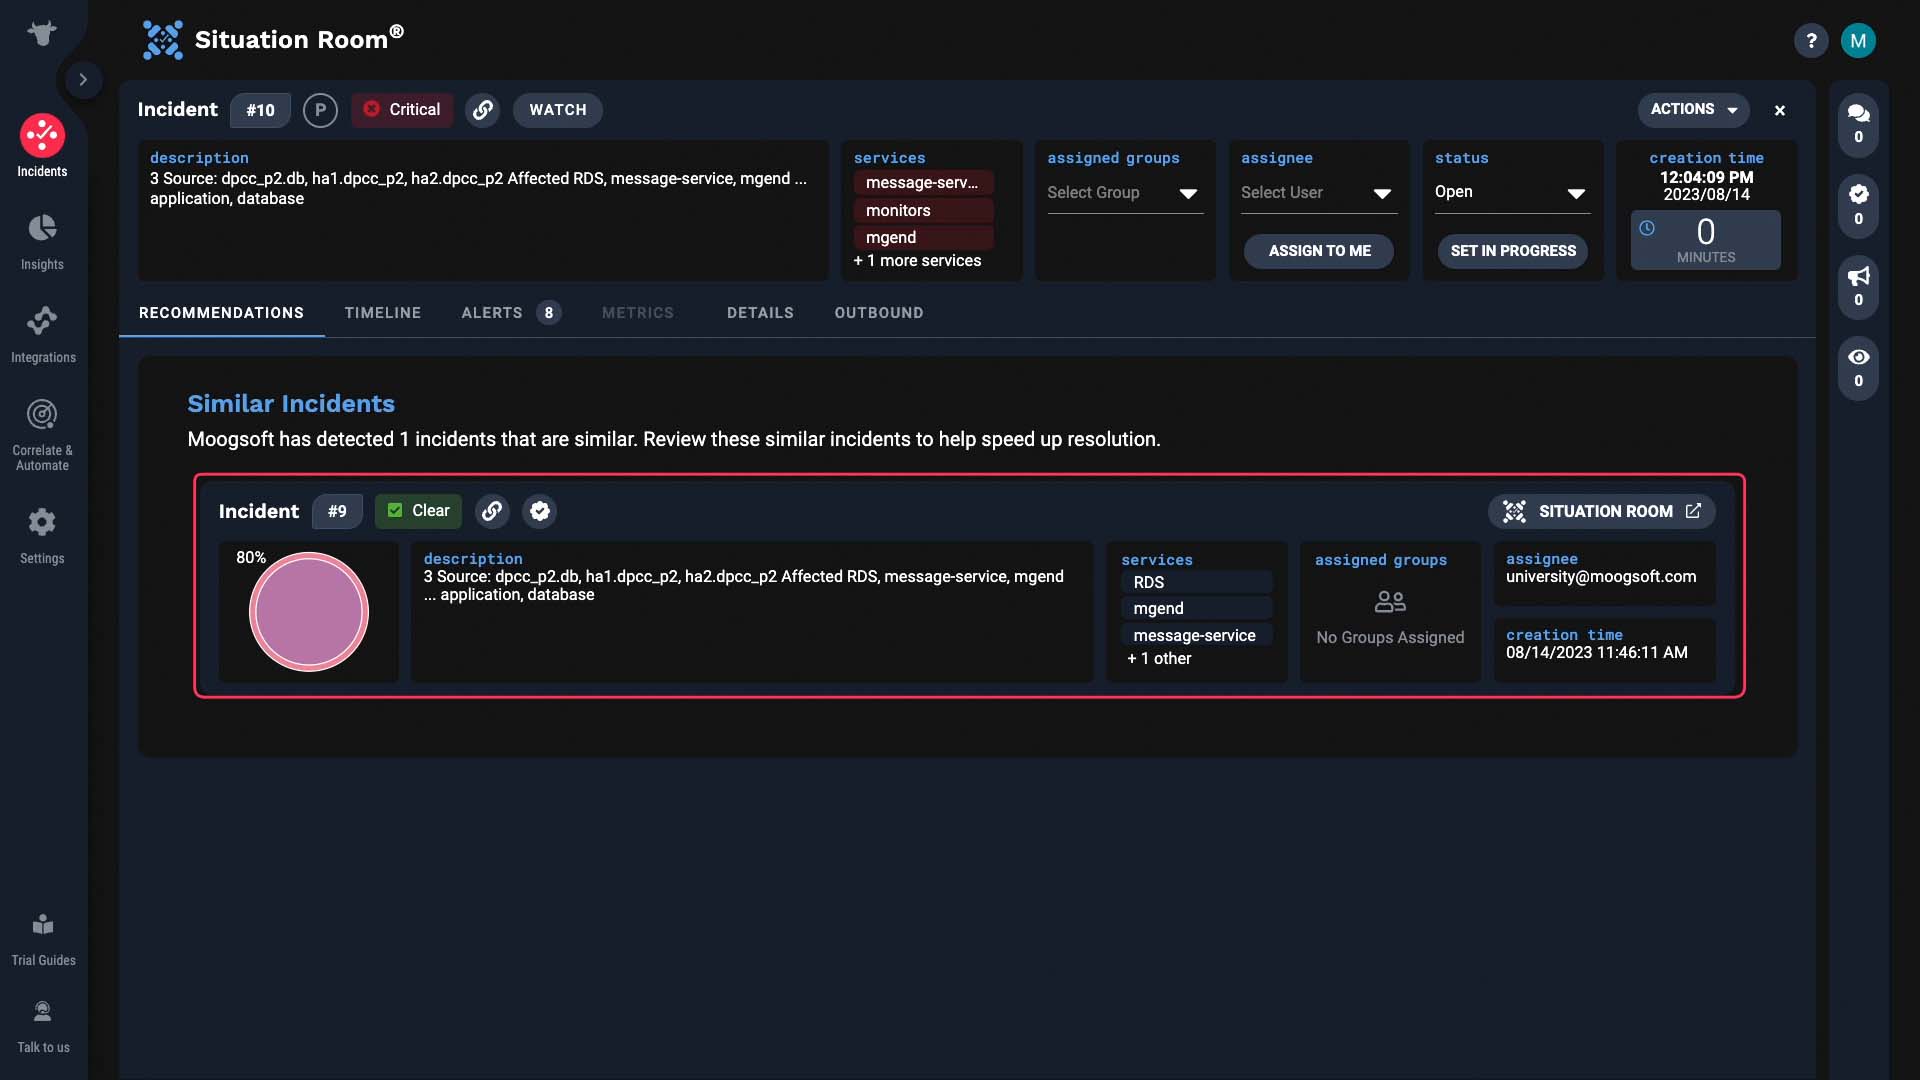
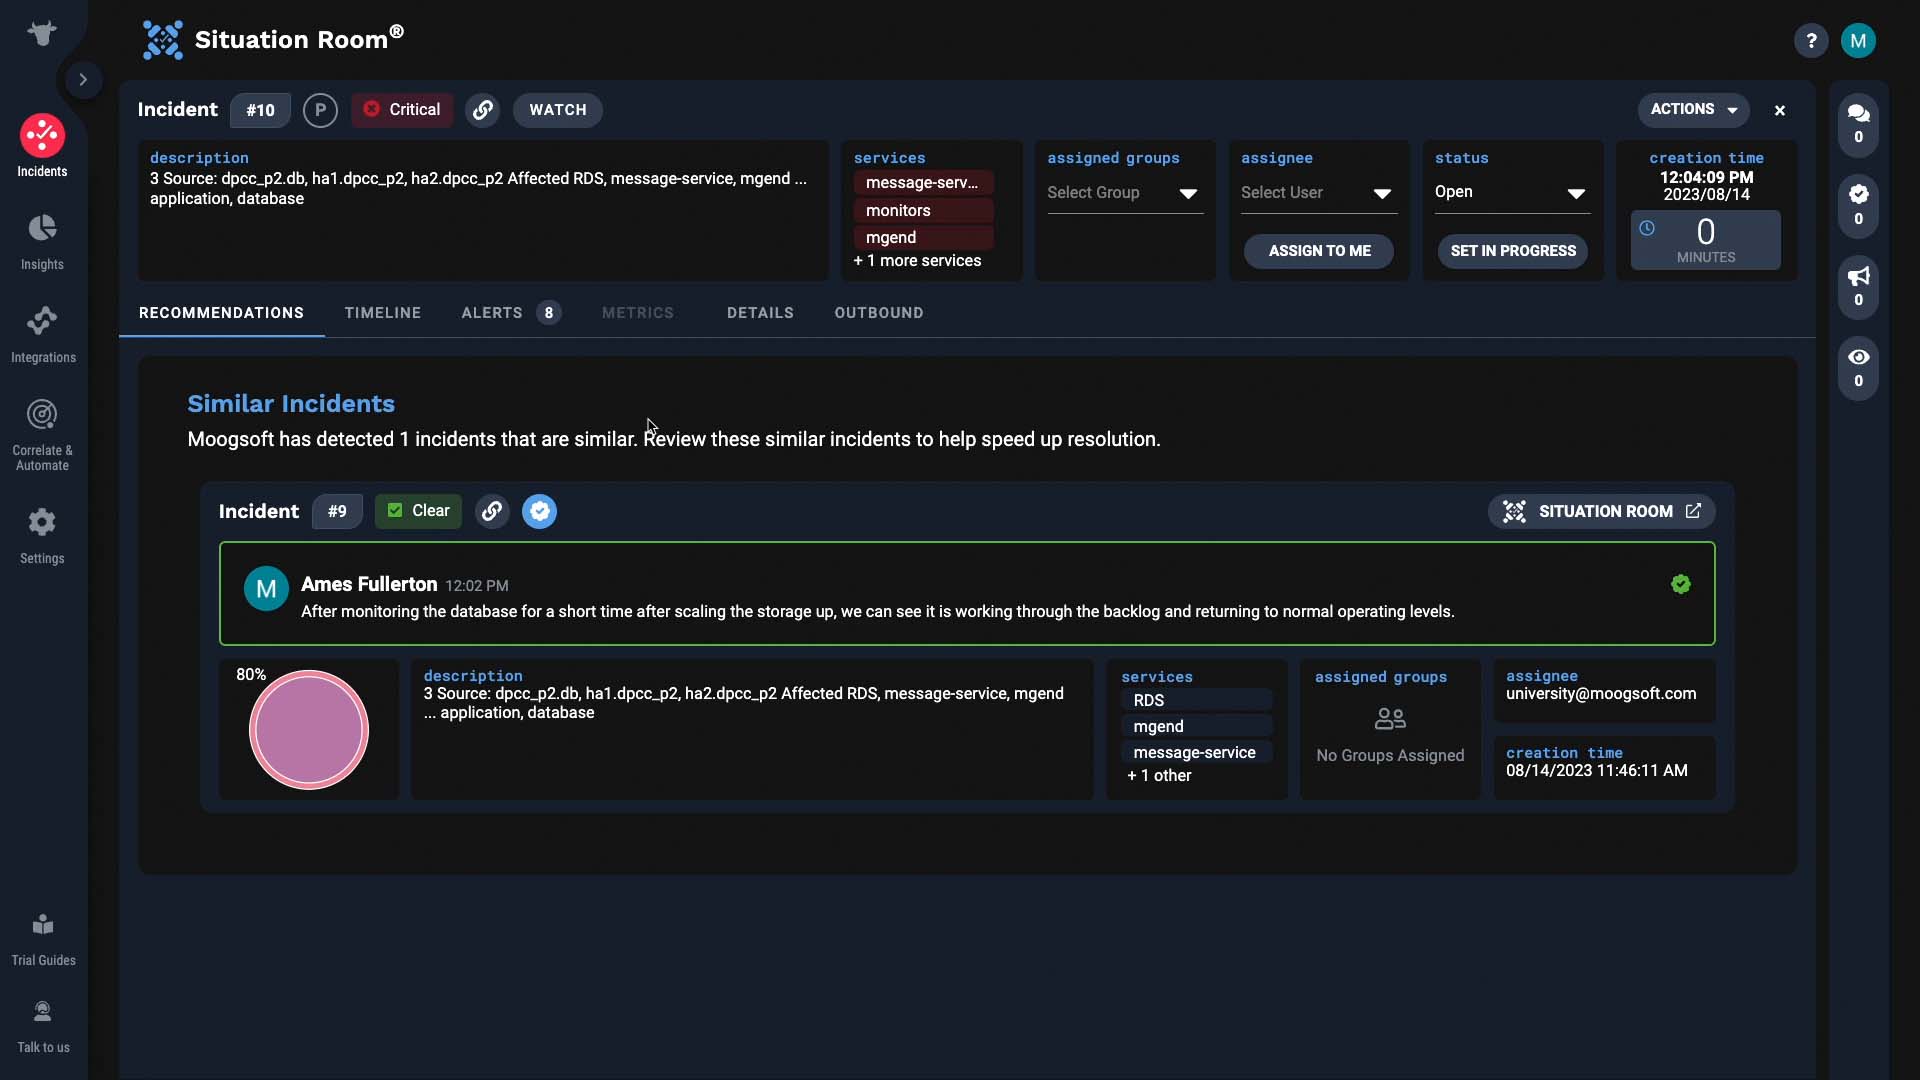
...with an indicator that there’s a resolving step.
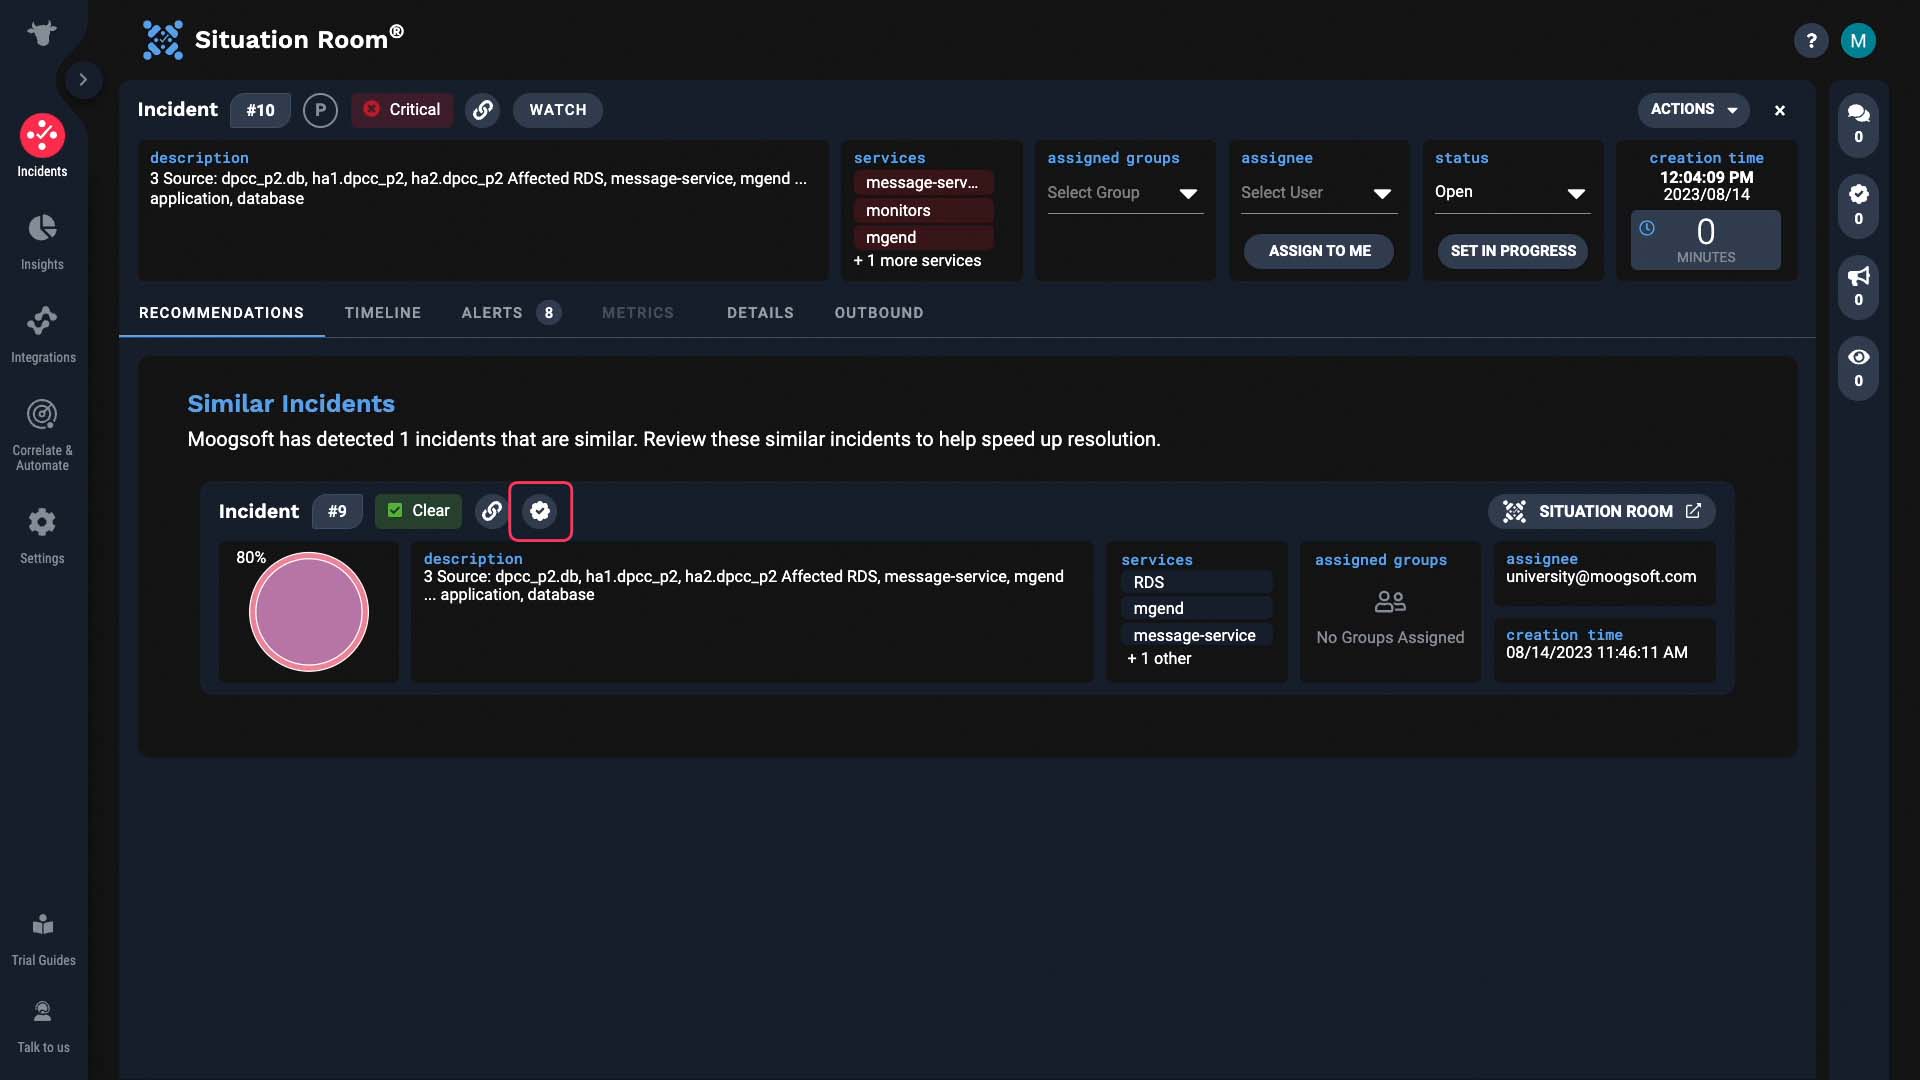
And the future 'you' will thank you for making it so easy to find how you fixed the problem last time.
Alternatively, you can mark a regular comment as the resolving step after the fact.
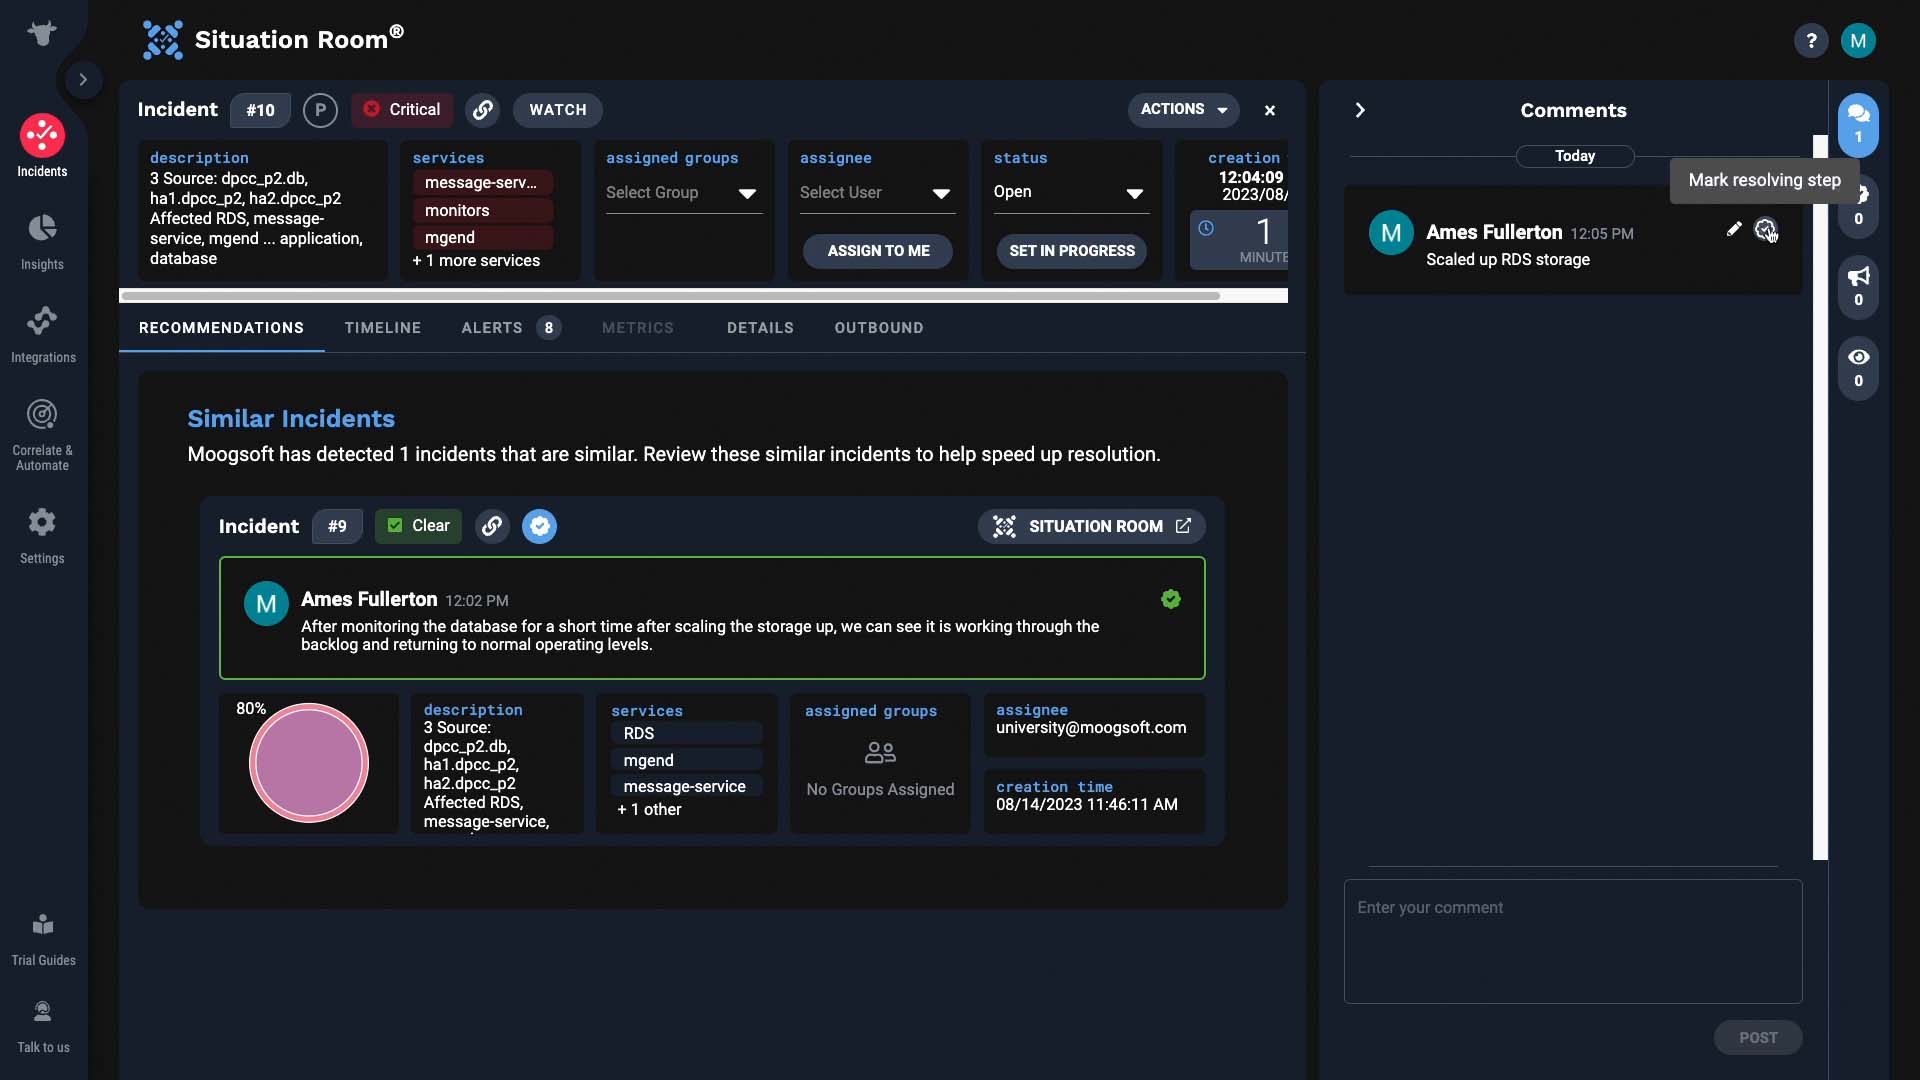
It works the same way as a comment you enter in the resolving steps tab.
Now you know how to use comments. Thanks for watching!
BASIC | 2 MIN
In this video, learn more about the recommendations tab in Situation Room.
Use case walkthrough: Recommendations tab in Situation Room ►
This video explains how to use the recommendations tab in Situation Room to reference similar incidents, suggest resolving steps, and expedite incident resolution.
*Please note Moogsoft is now part of Dell's IT Operations solution called APEX AIOps, and changed its name to APEX AIOps Incident Management. The UI in this video may differ slightly but the content covered is still relevant.
Let’s spend a few minutes learning about the recommendations tab in Situation Room.
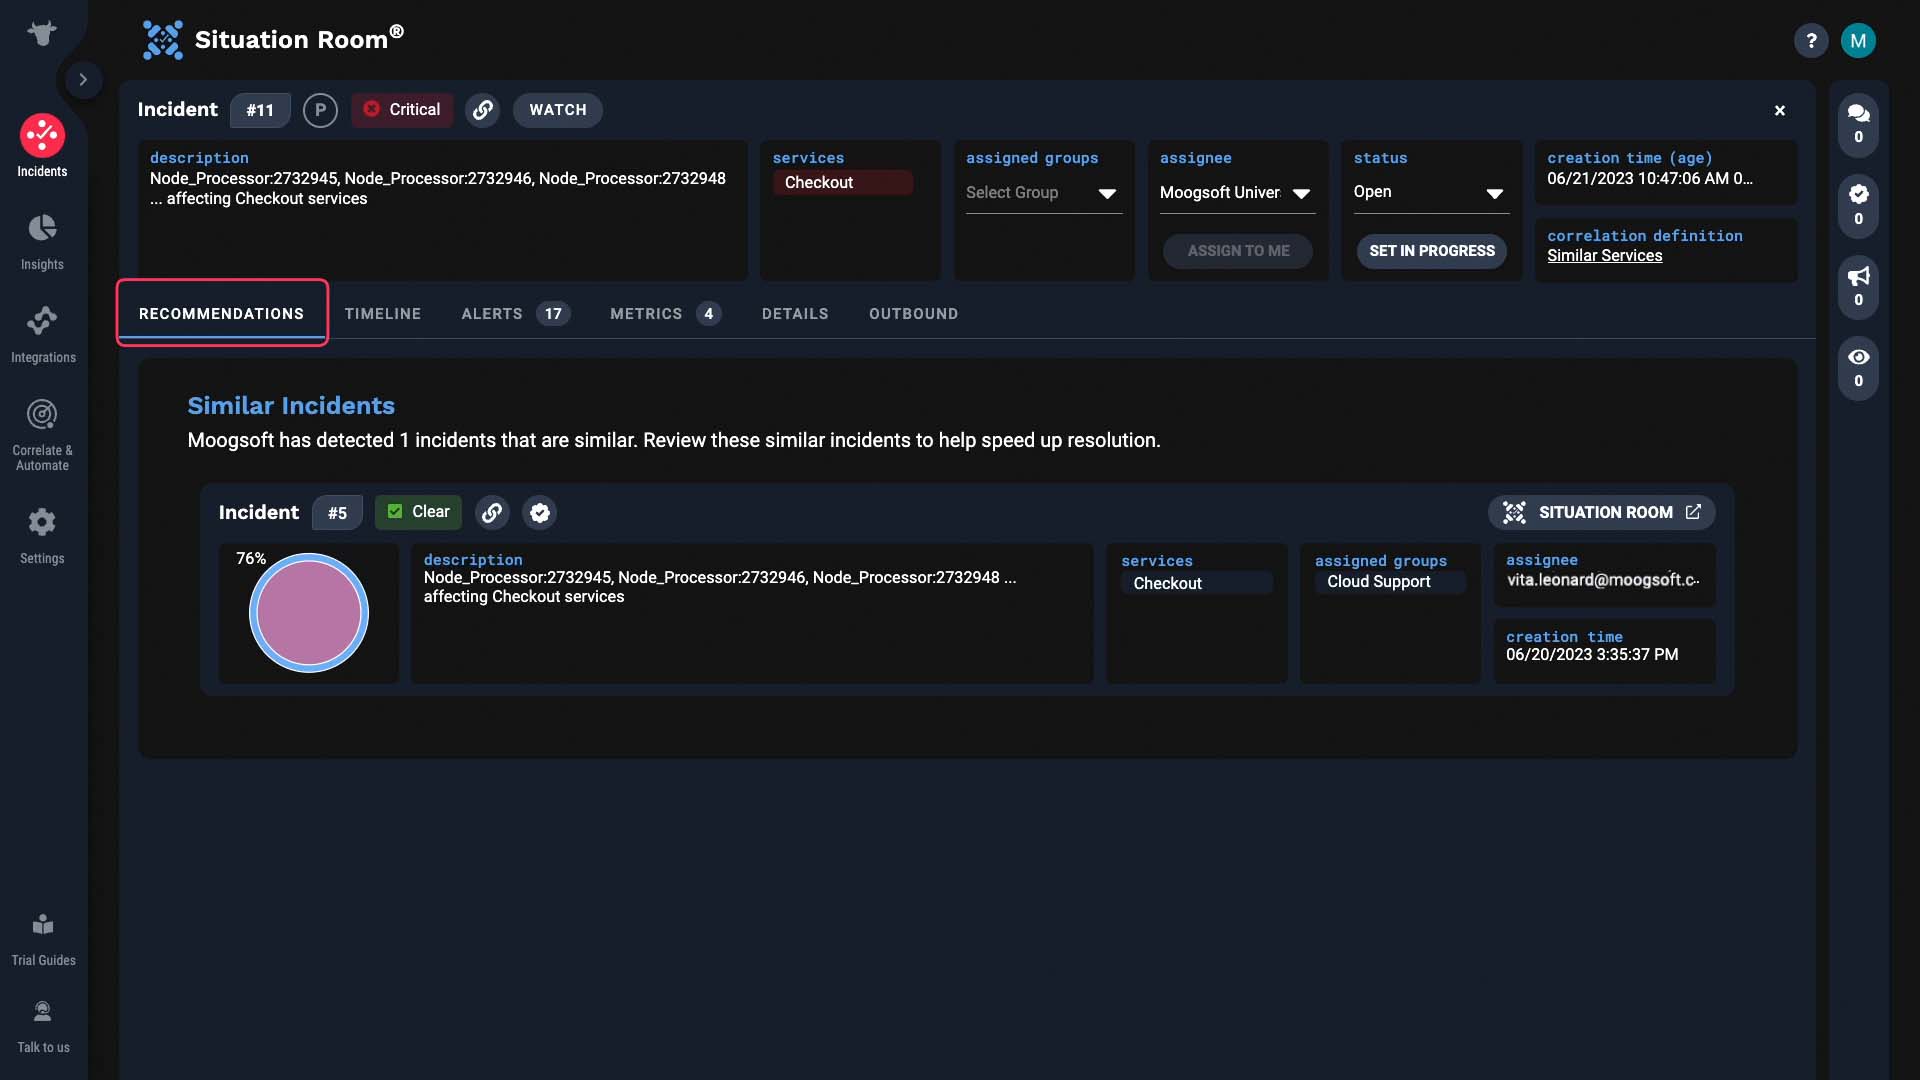
Incident Management checks if there are incidents similar to the one at hand. And if there are, it will surface them for you to reference.
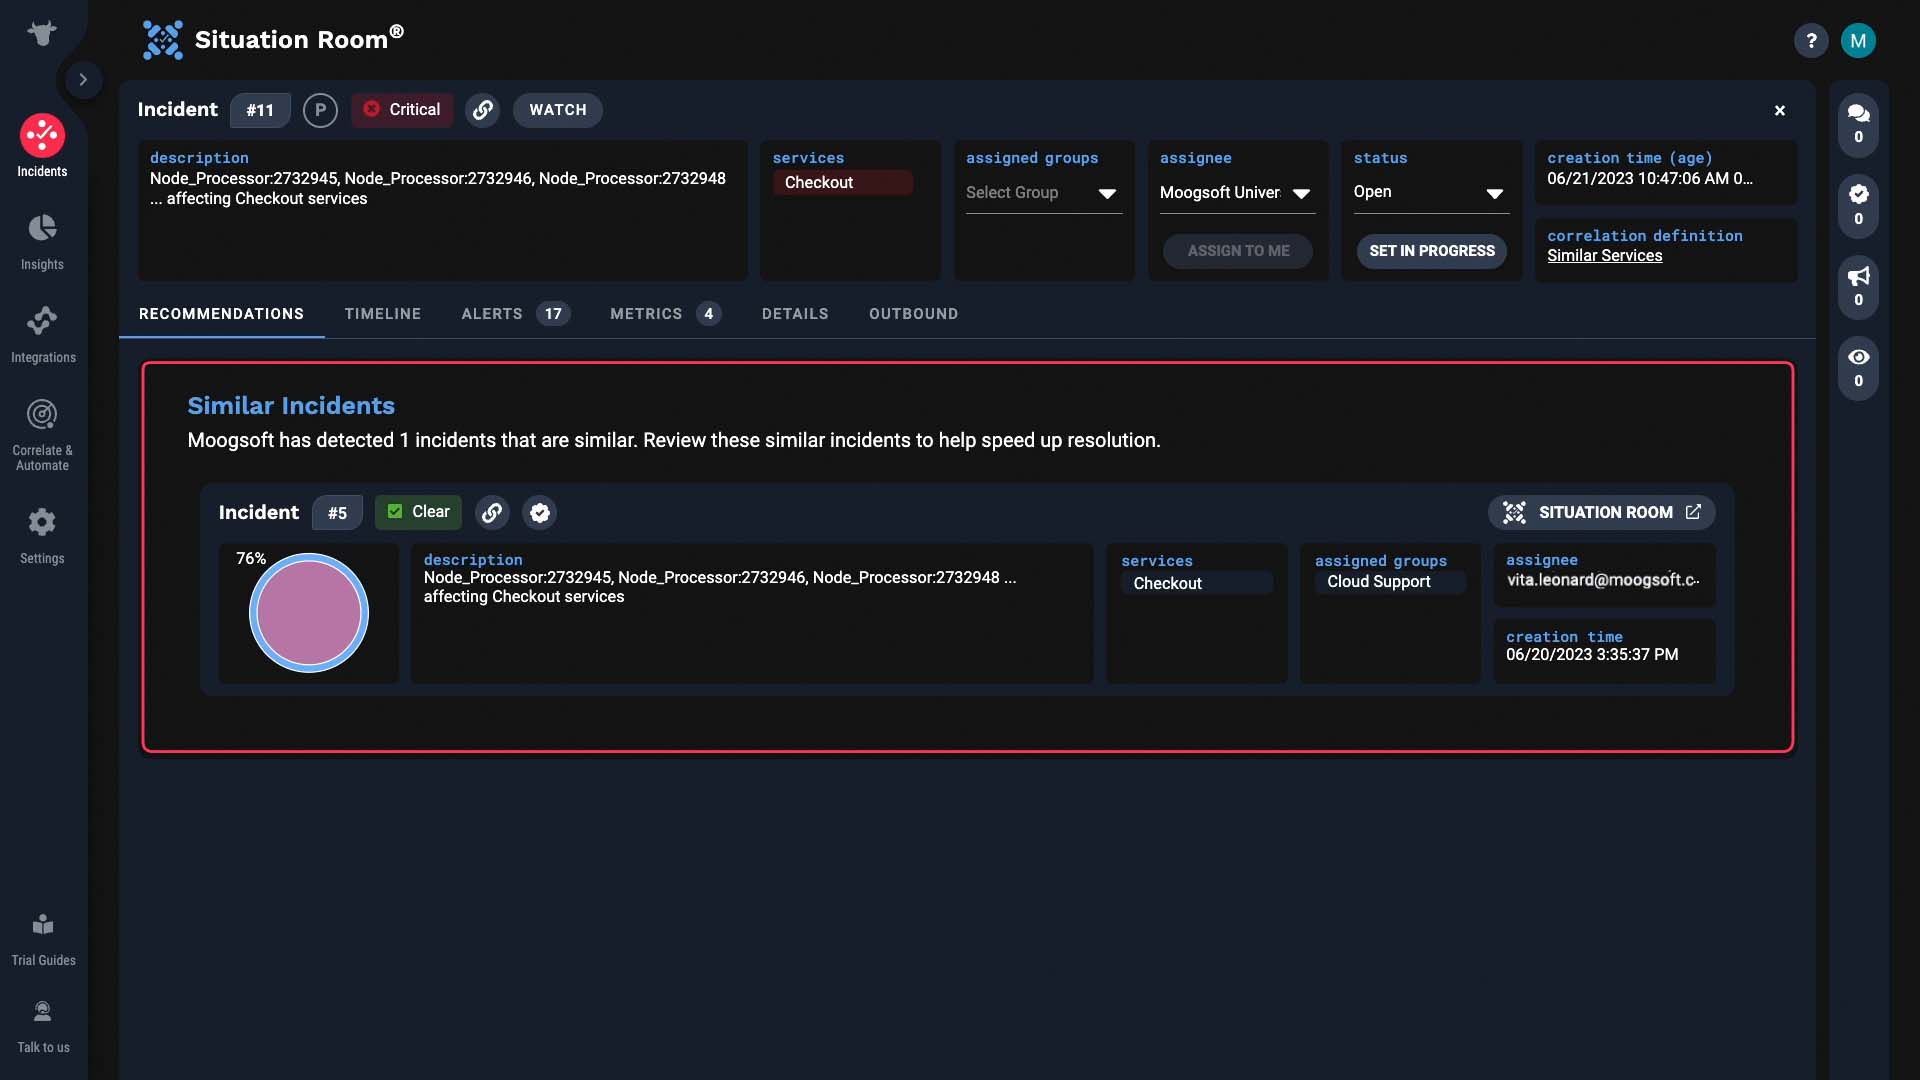
In this case, we have one similar incident.
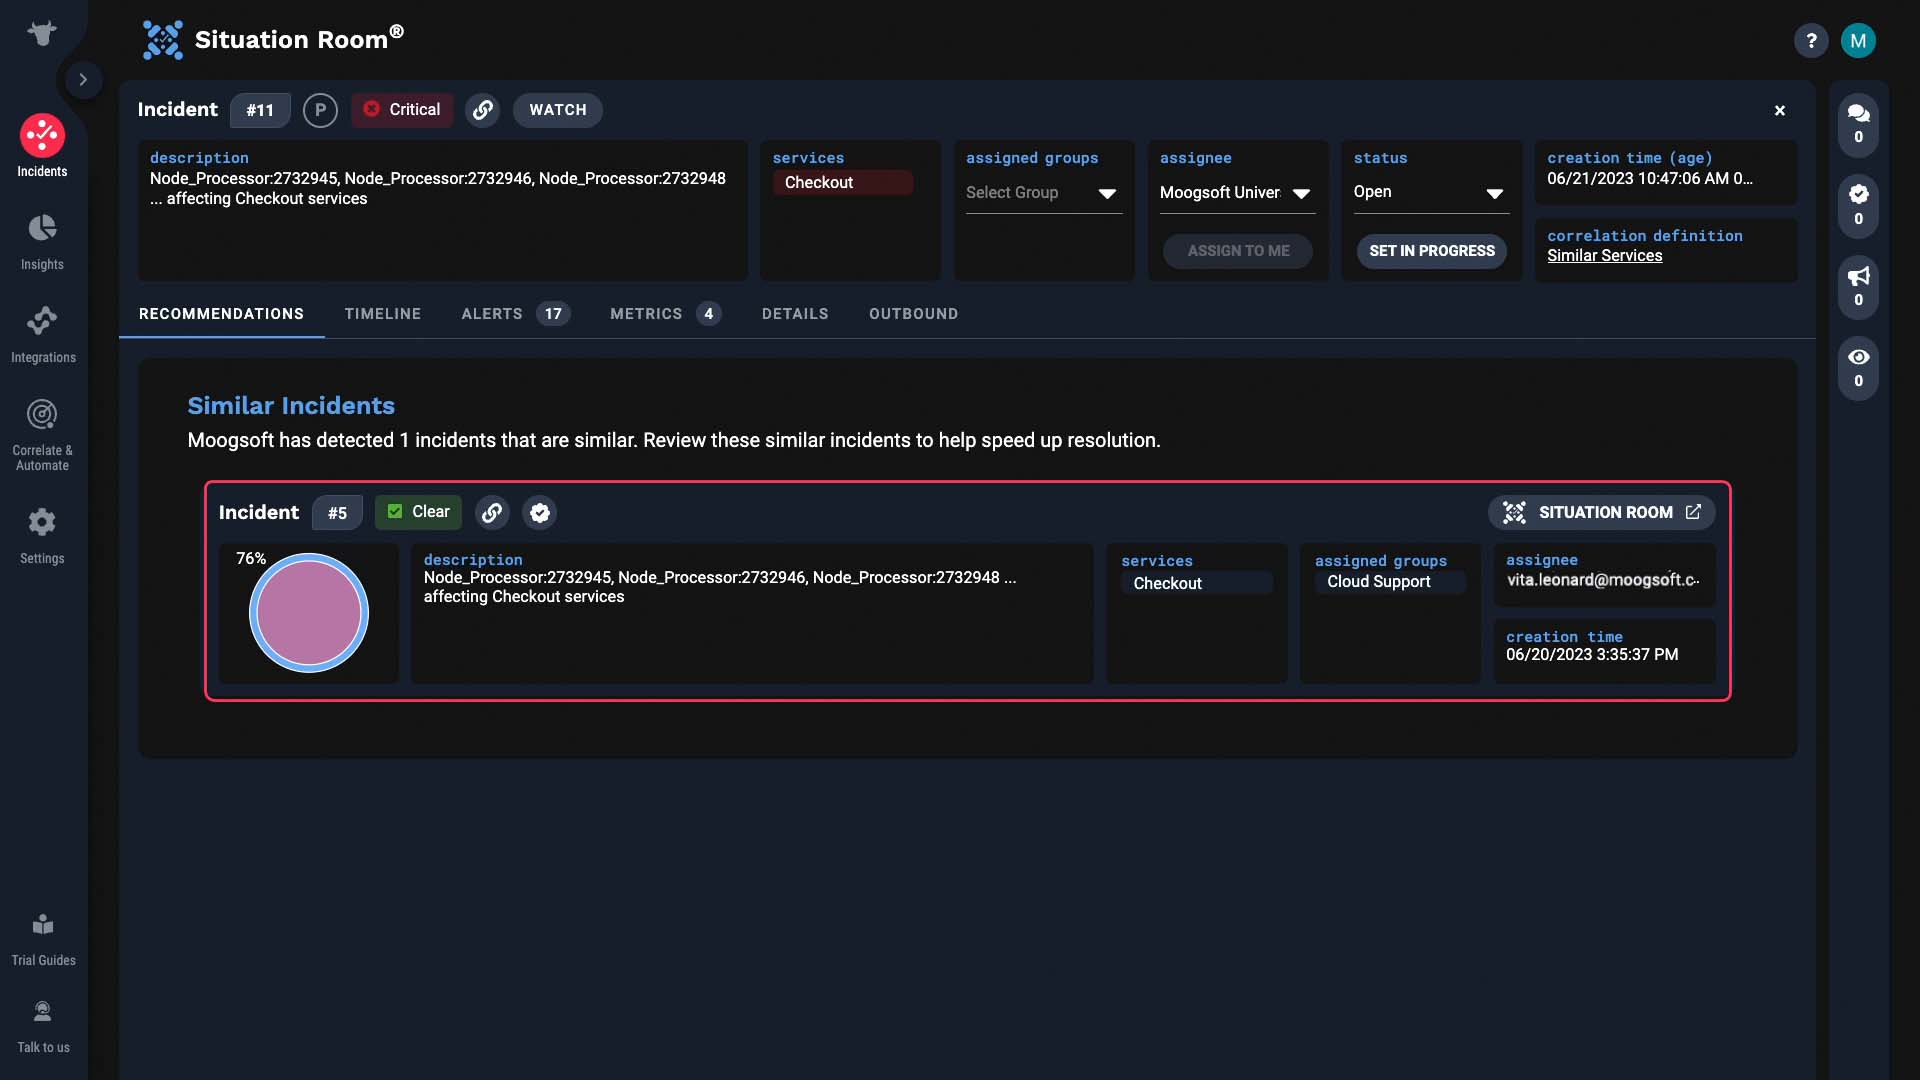
This one is 76% similar to our incident.
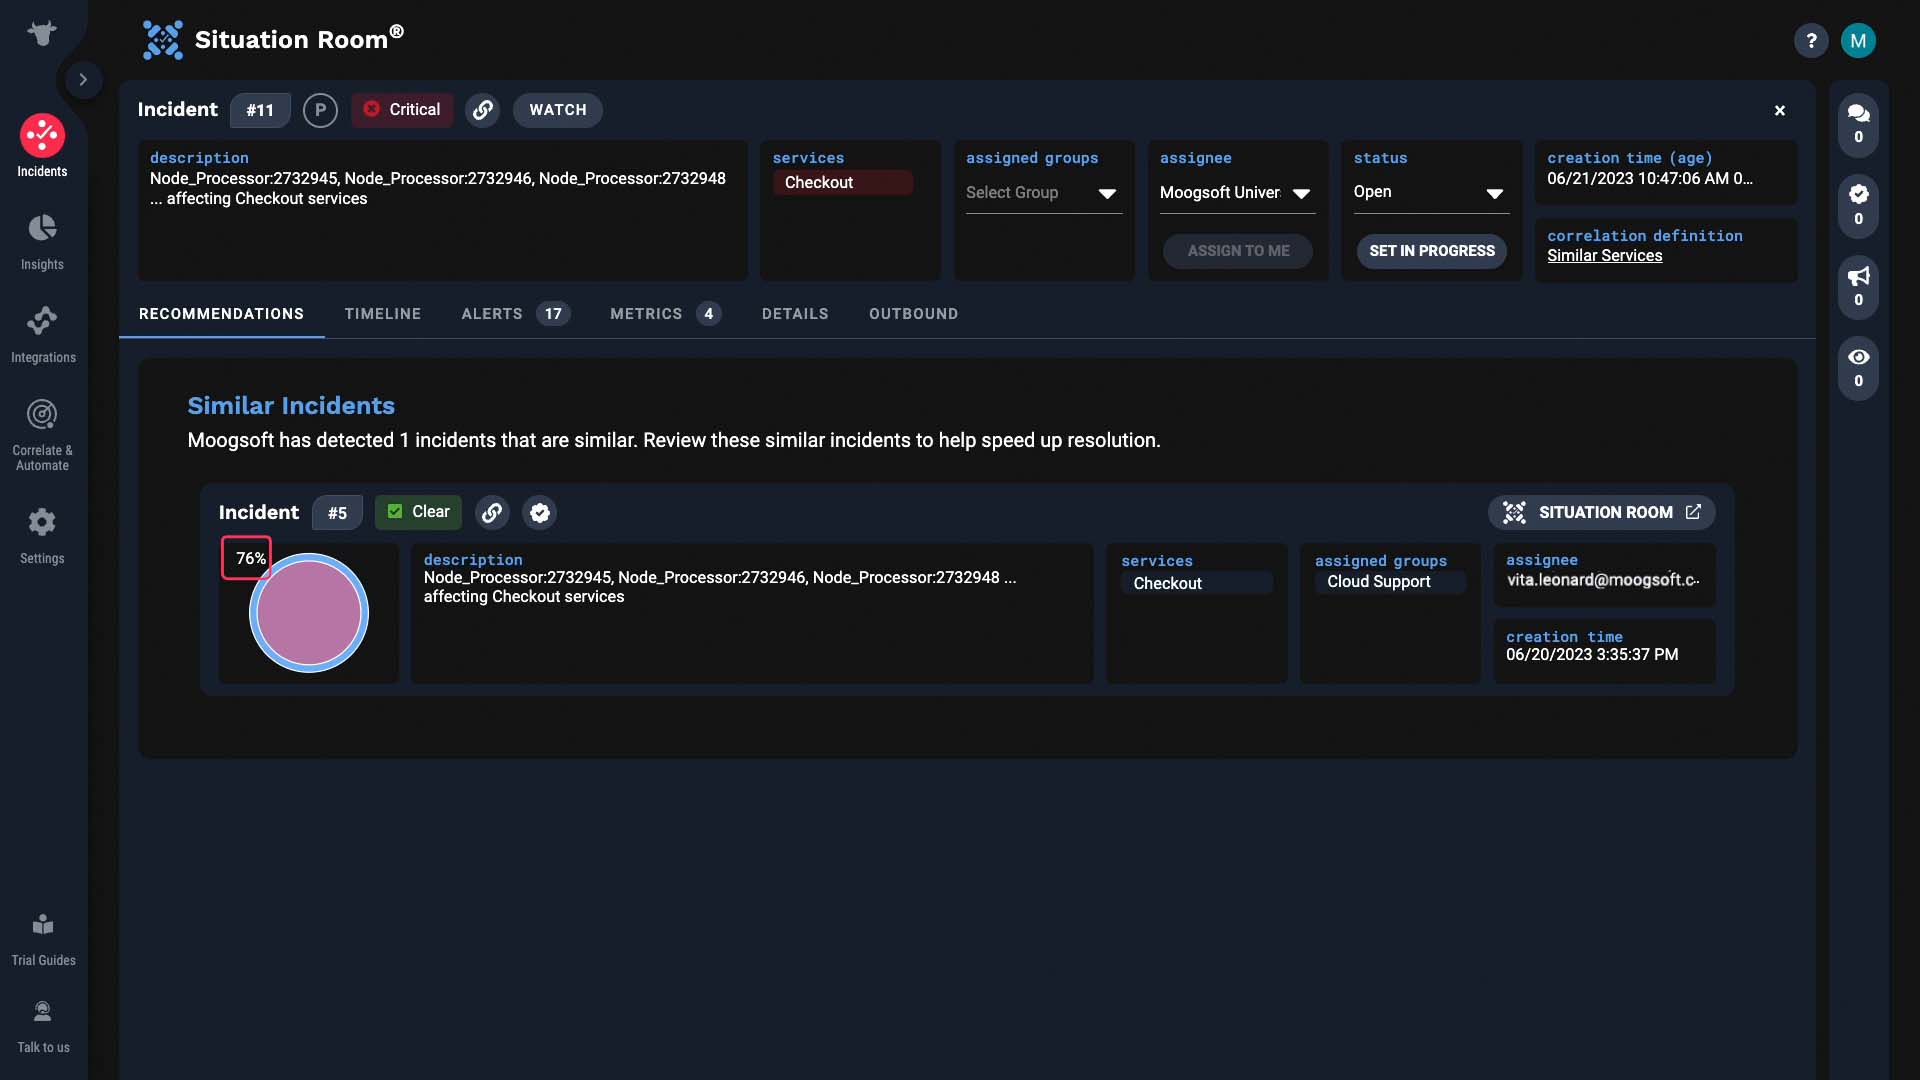
And note this icon! This means information on what resolved this incident is available! With this past incident, it looks like the problems were related to a code push. Let’s learn more about it.
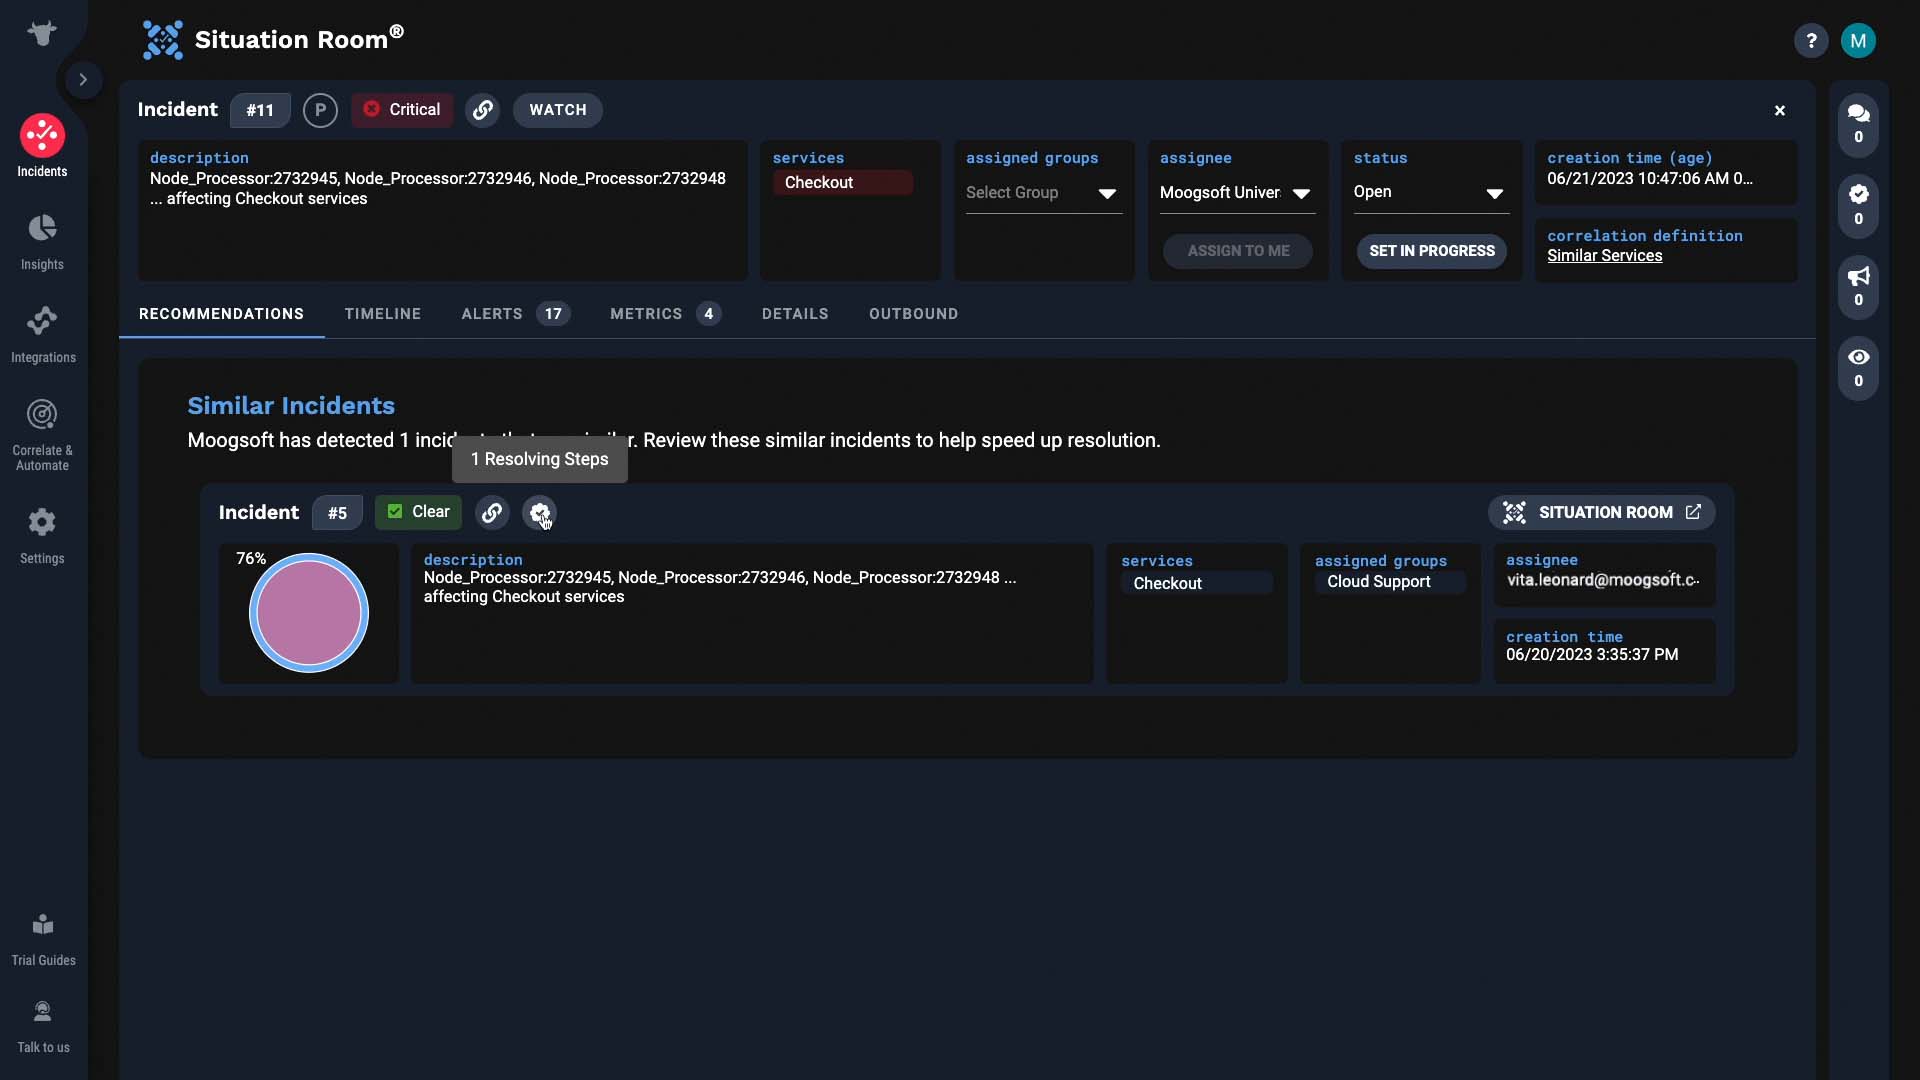
Okay, now we have some more context.
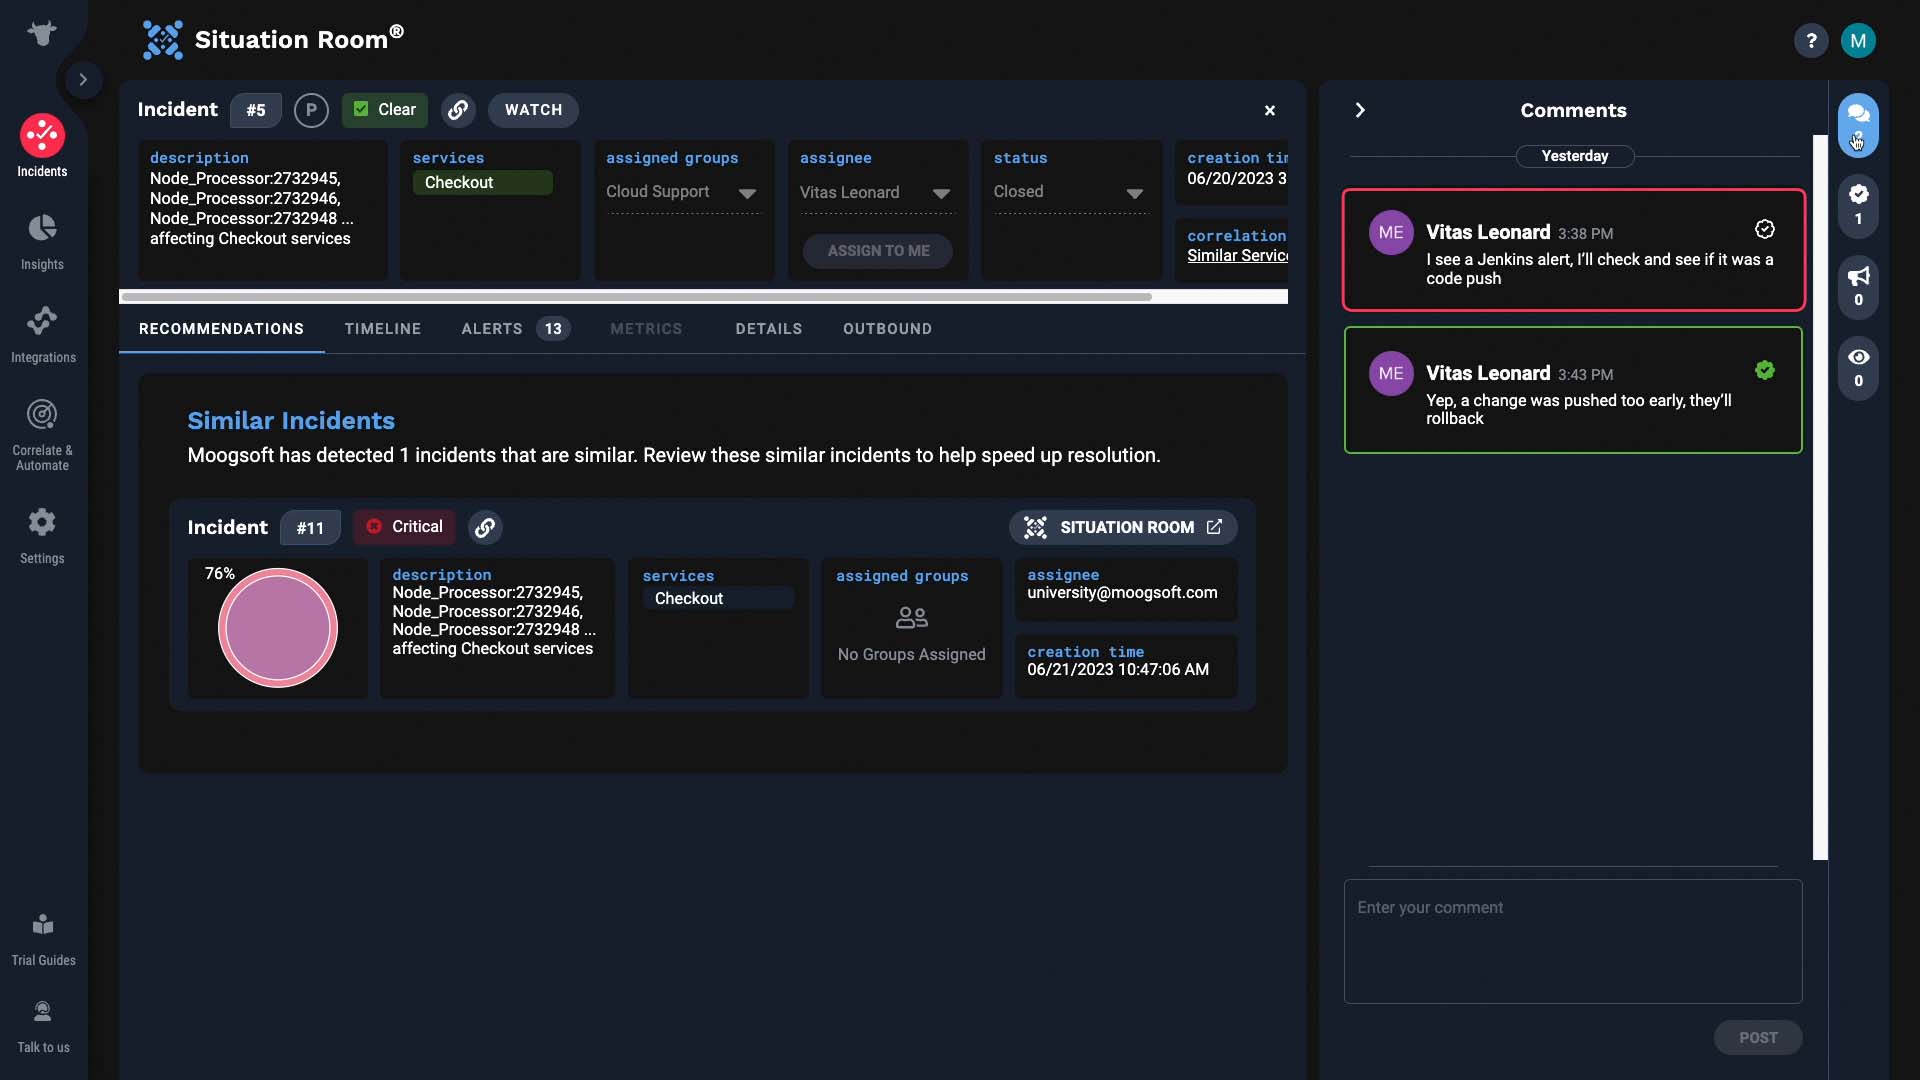
Now we can go back to the incident you are working on and see if it’s got that Jenkins alert.
And indeed, here it is. So just like this, the recommendations tab expedites your problem solving.
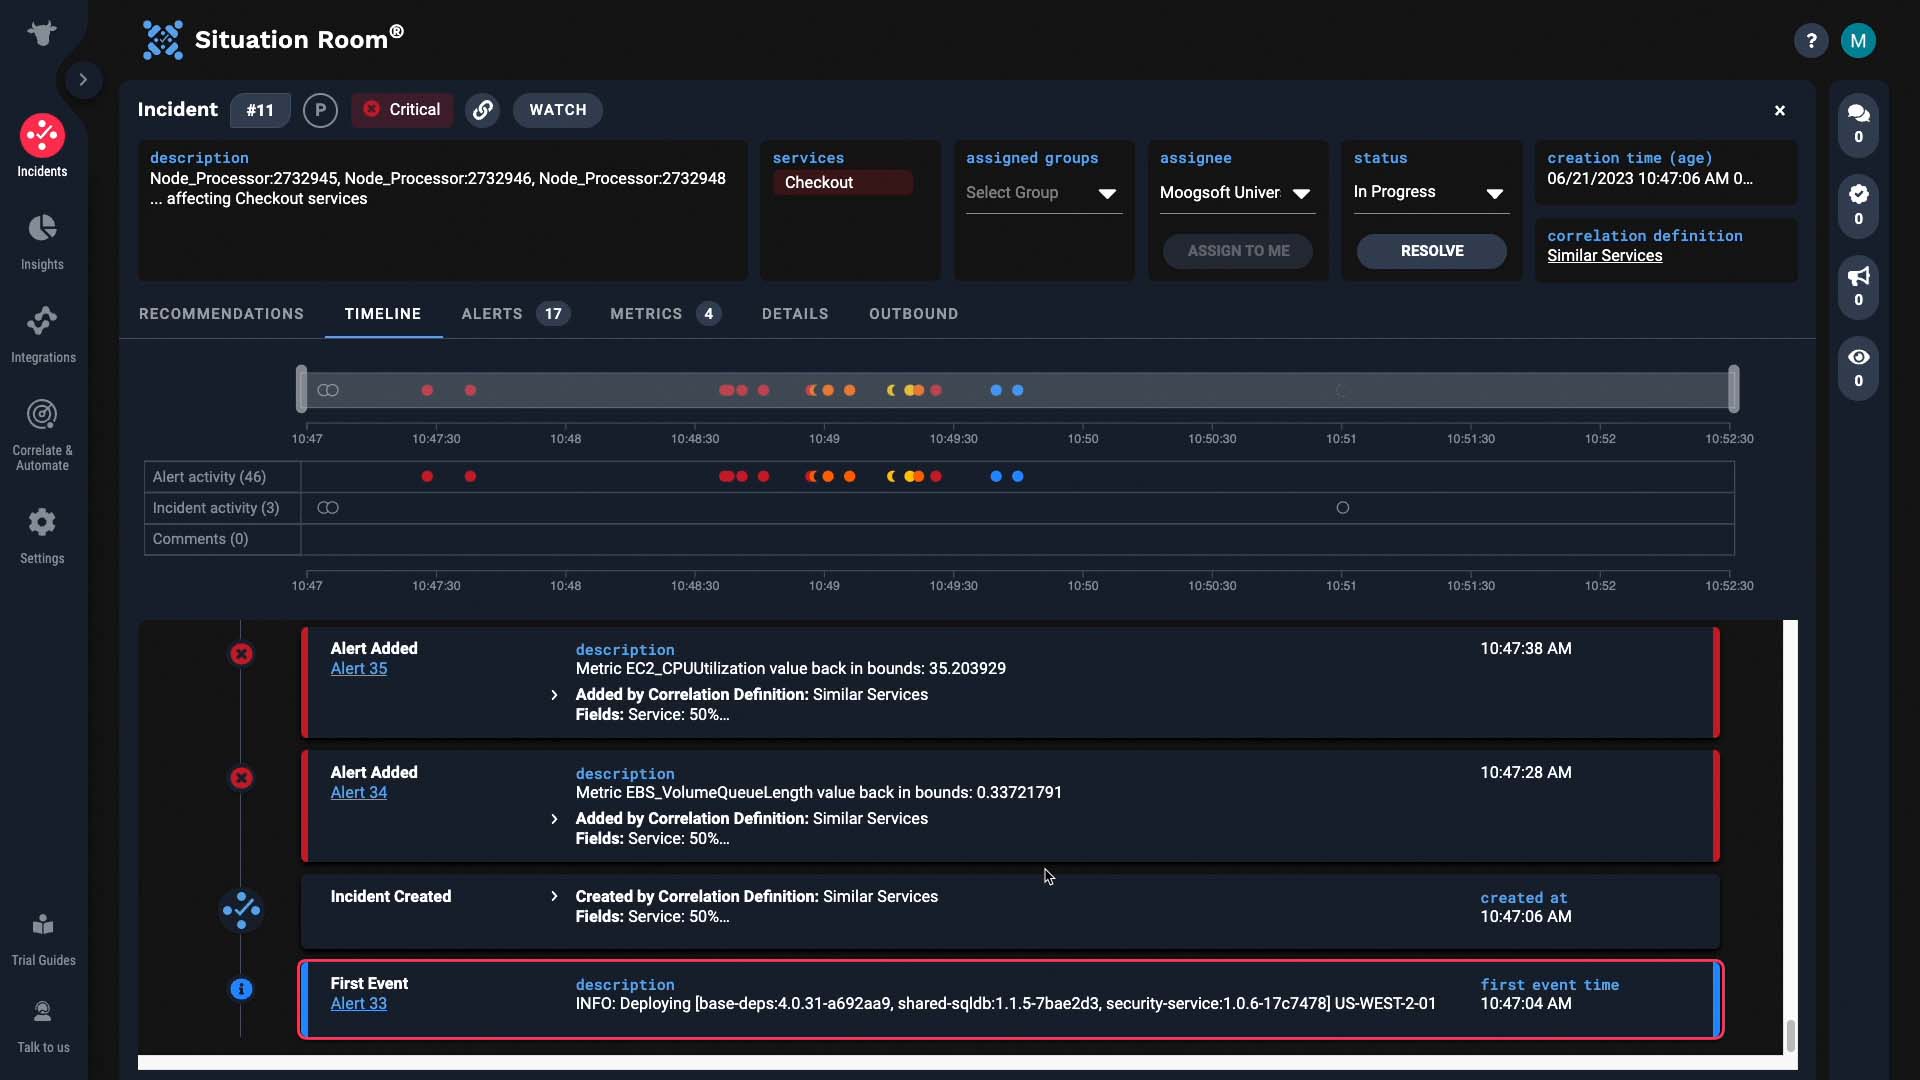
But how did Incident Management surface that particular incident for us?
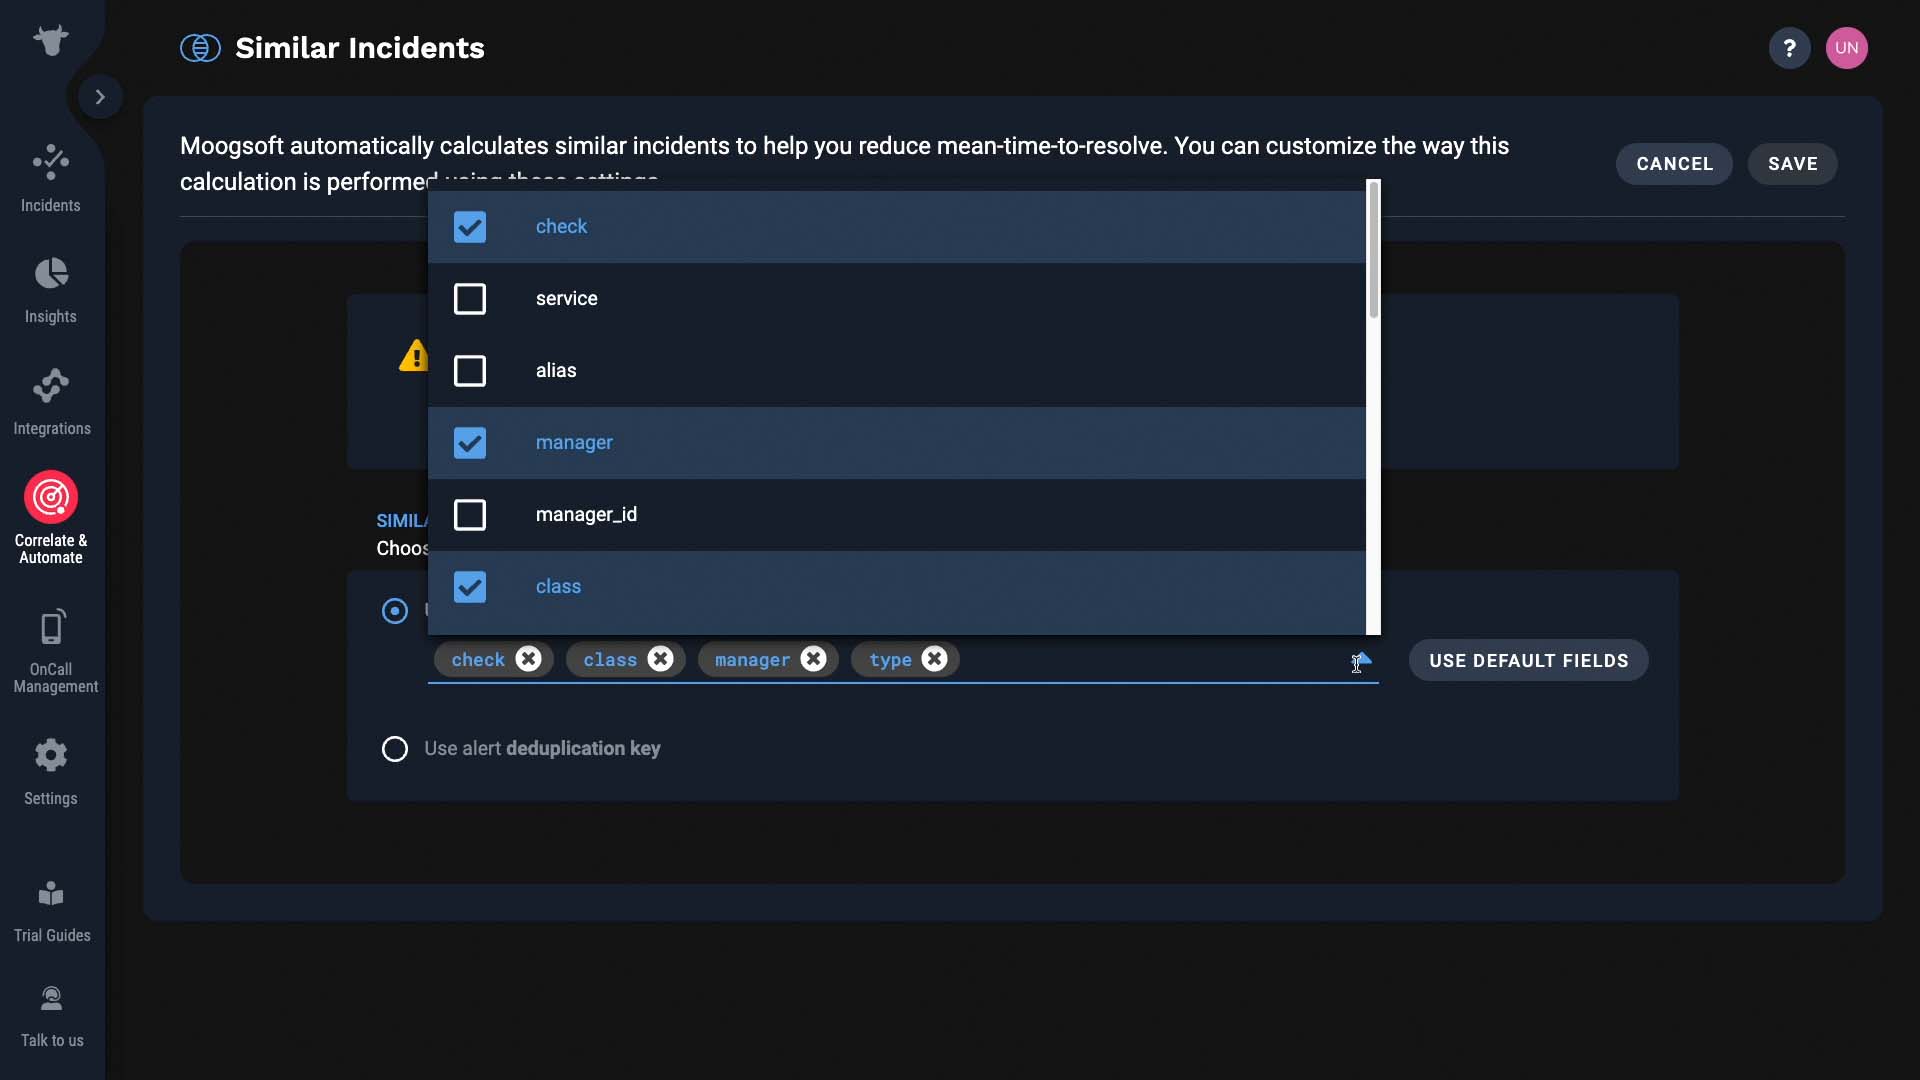
How Incident Management identifies similar incidents is configured here.
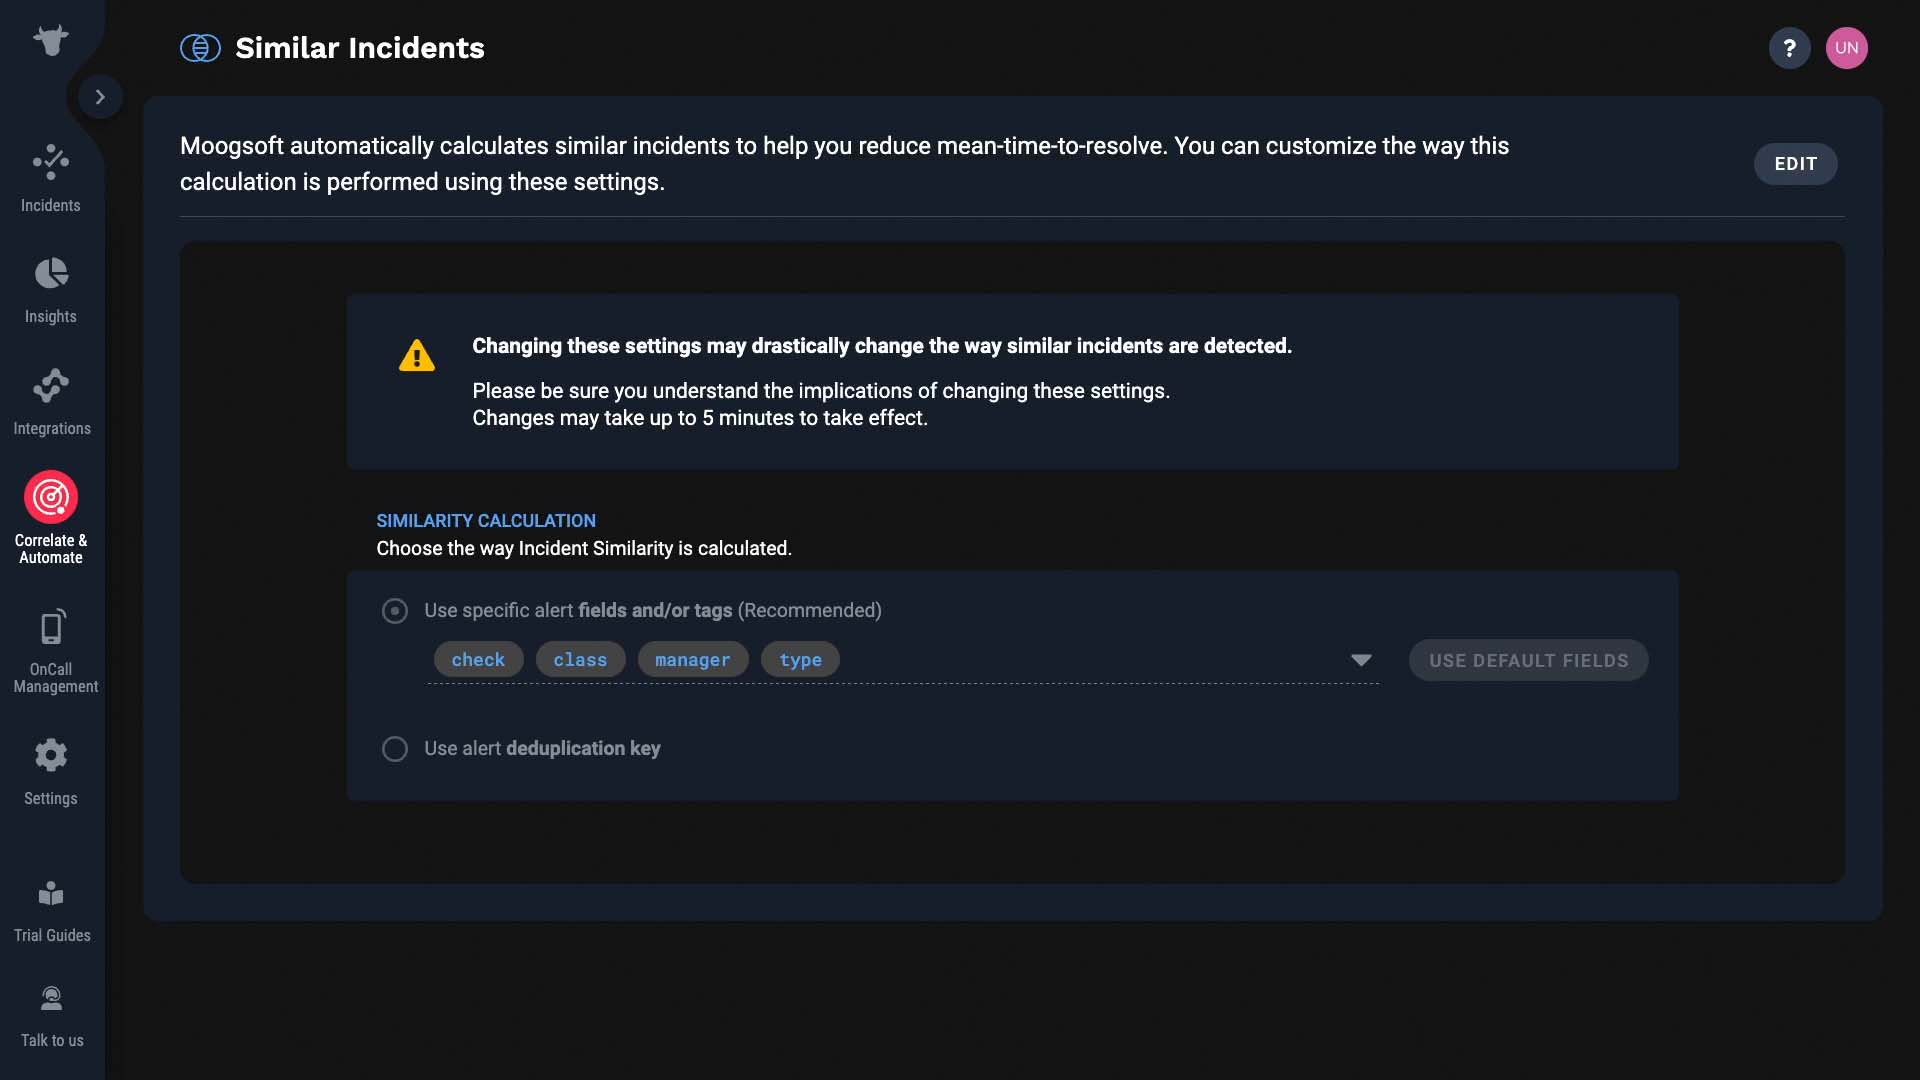
By default, Incident Management compares these fields and tags to determine similarity. But you can change which fields to use.
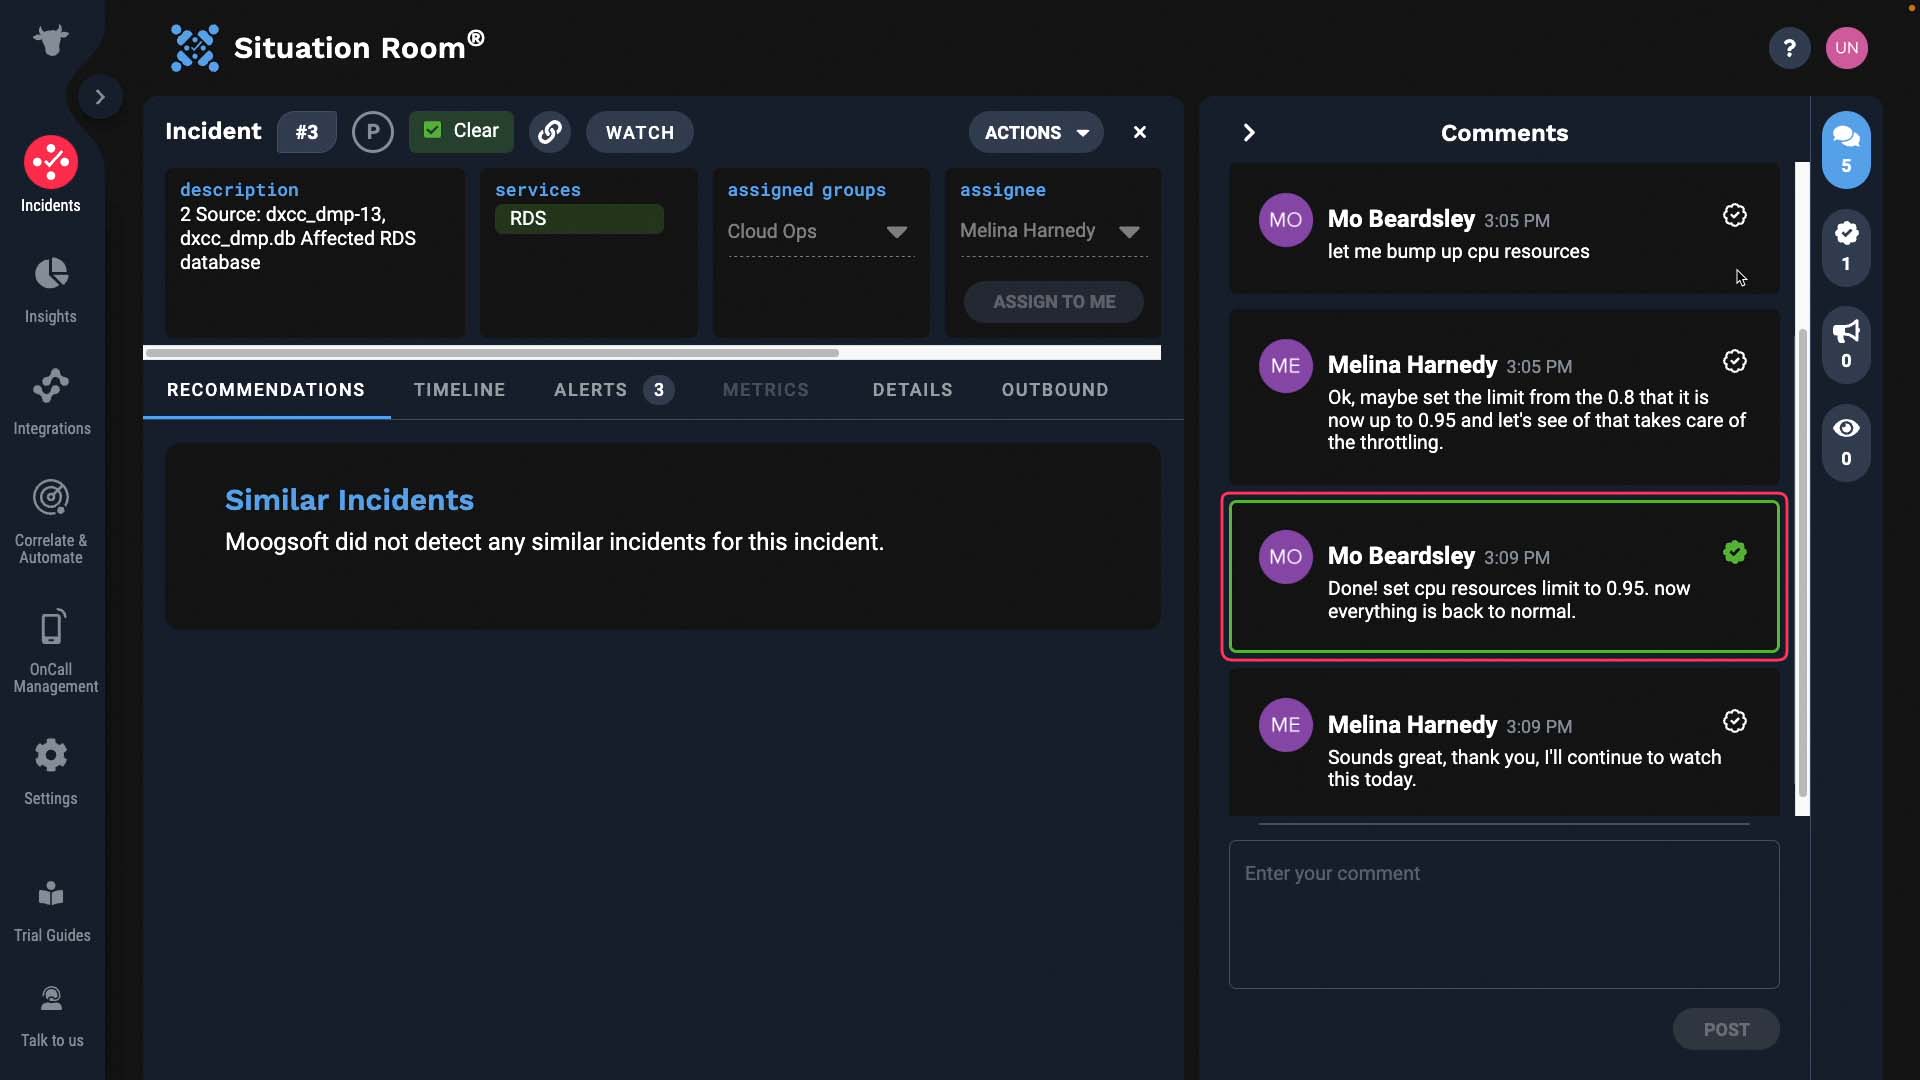
And how are resolving steps suggested?
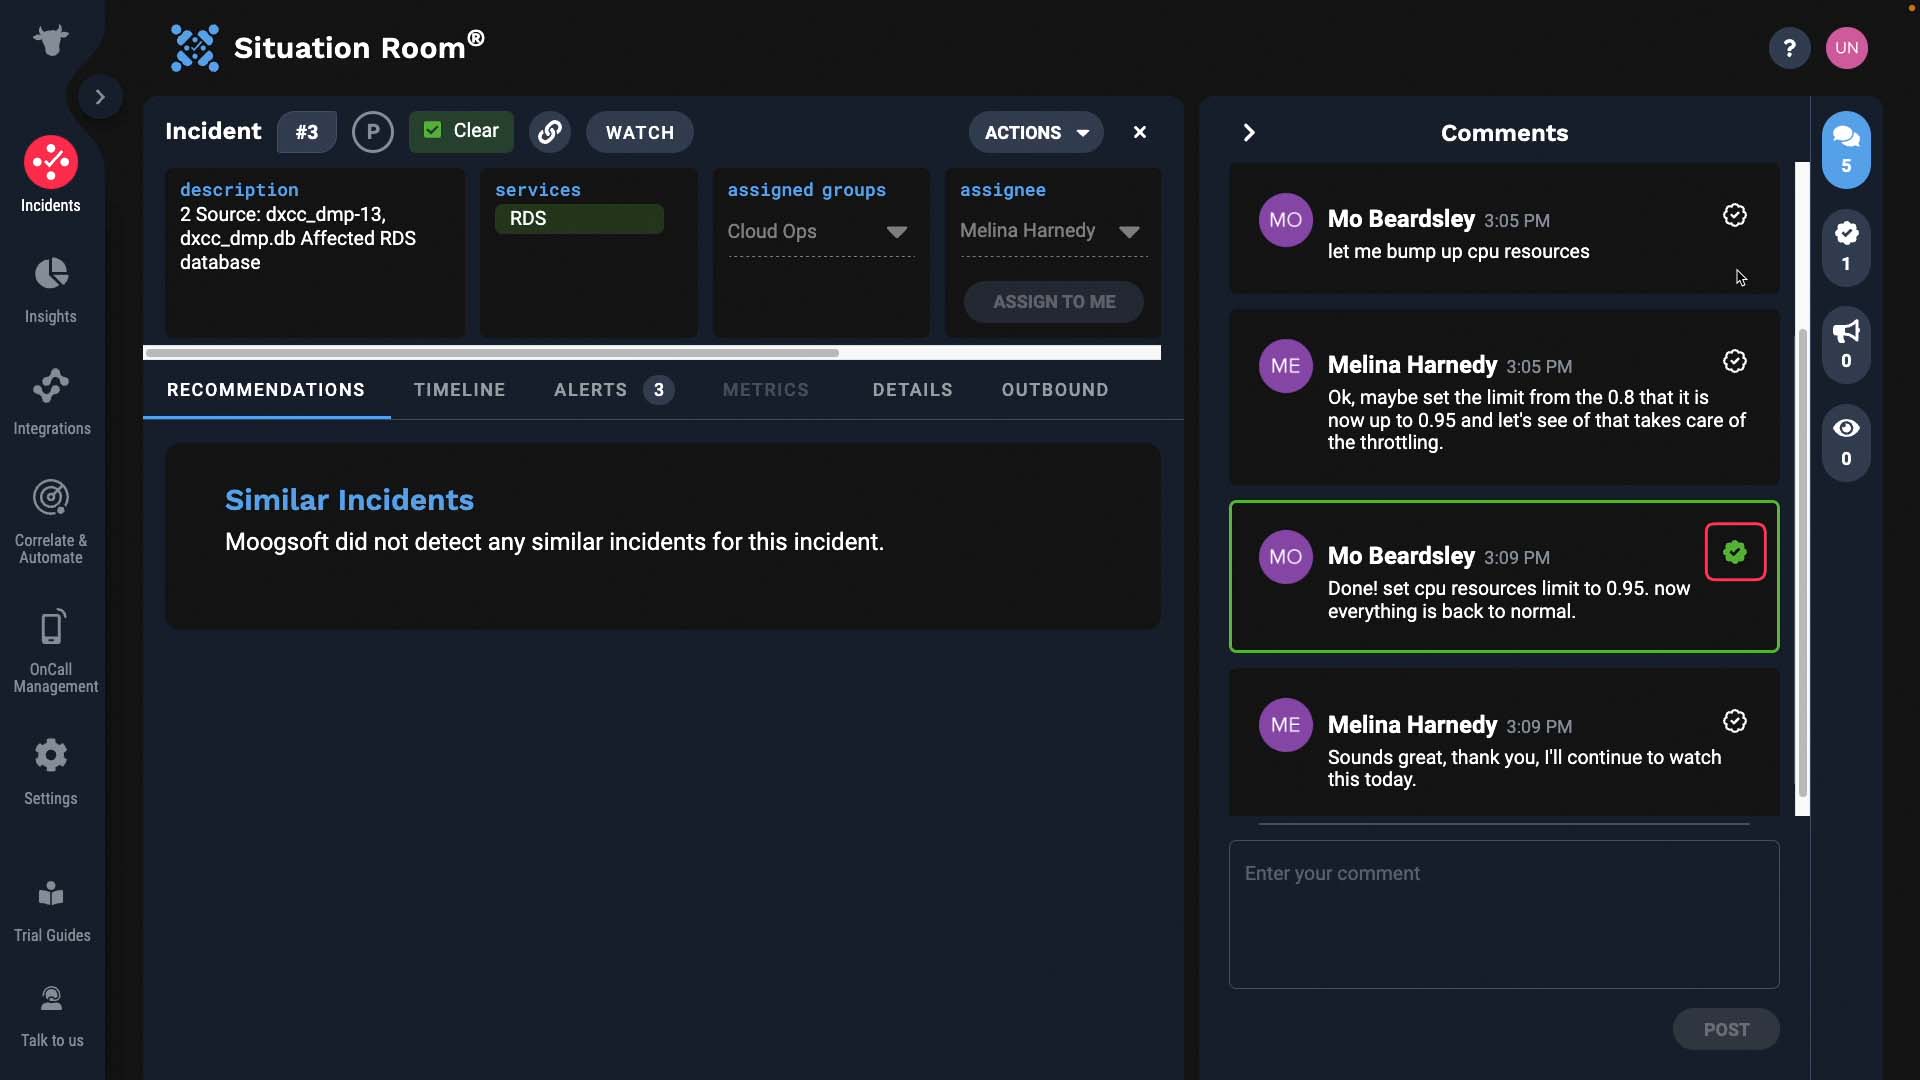
It comes from comments that are tagged as resolving steps.
So as you work on incidents, make sure to always mark the resolving steps. You will be glad you did in the future!
BASIC | 1 MIN
Learn how to watch incidents in Moogsoft Cloud.
Use case walkthrough: Incident watcher in APEX AIOps Incident Management ►
This video explains how to watch incidents in APEX AIOps Incident Management and receive email notifications whenever announcements are added.
*Please note Moogsoft is now part of Dell's IT Operations solution called APEX AIOps, and changed its name to APEX AIOps Incident Management. The UI in this video may differ slightly but the content covered is still relevant.
There may be incidents you don’t need to directly work on, but just want to monitor progress. You can watch such incidents and stay informed.
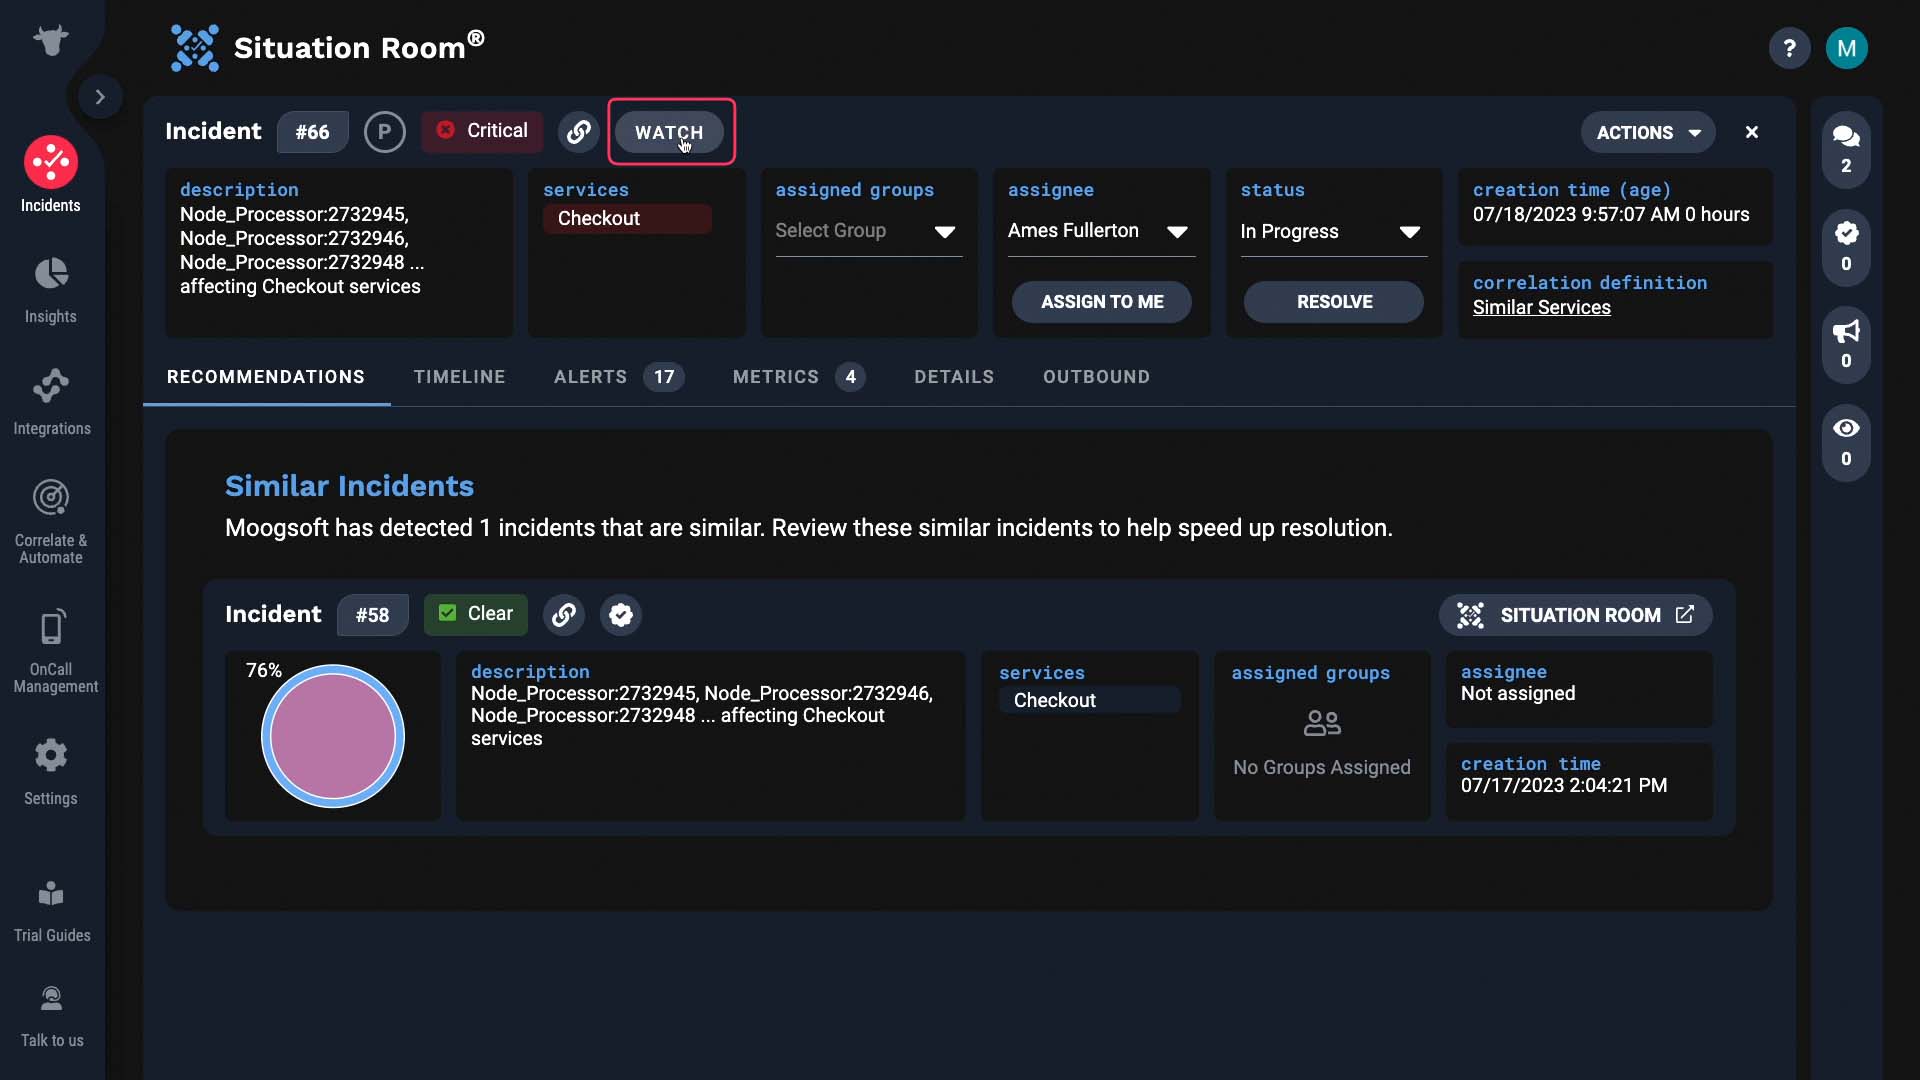
Now you are watching this incident. When anyone adds announcements, Incident Management will email you.
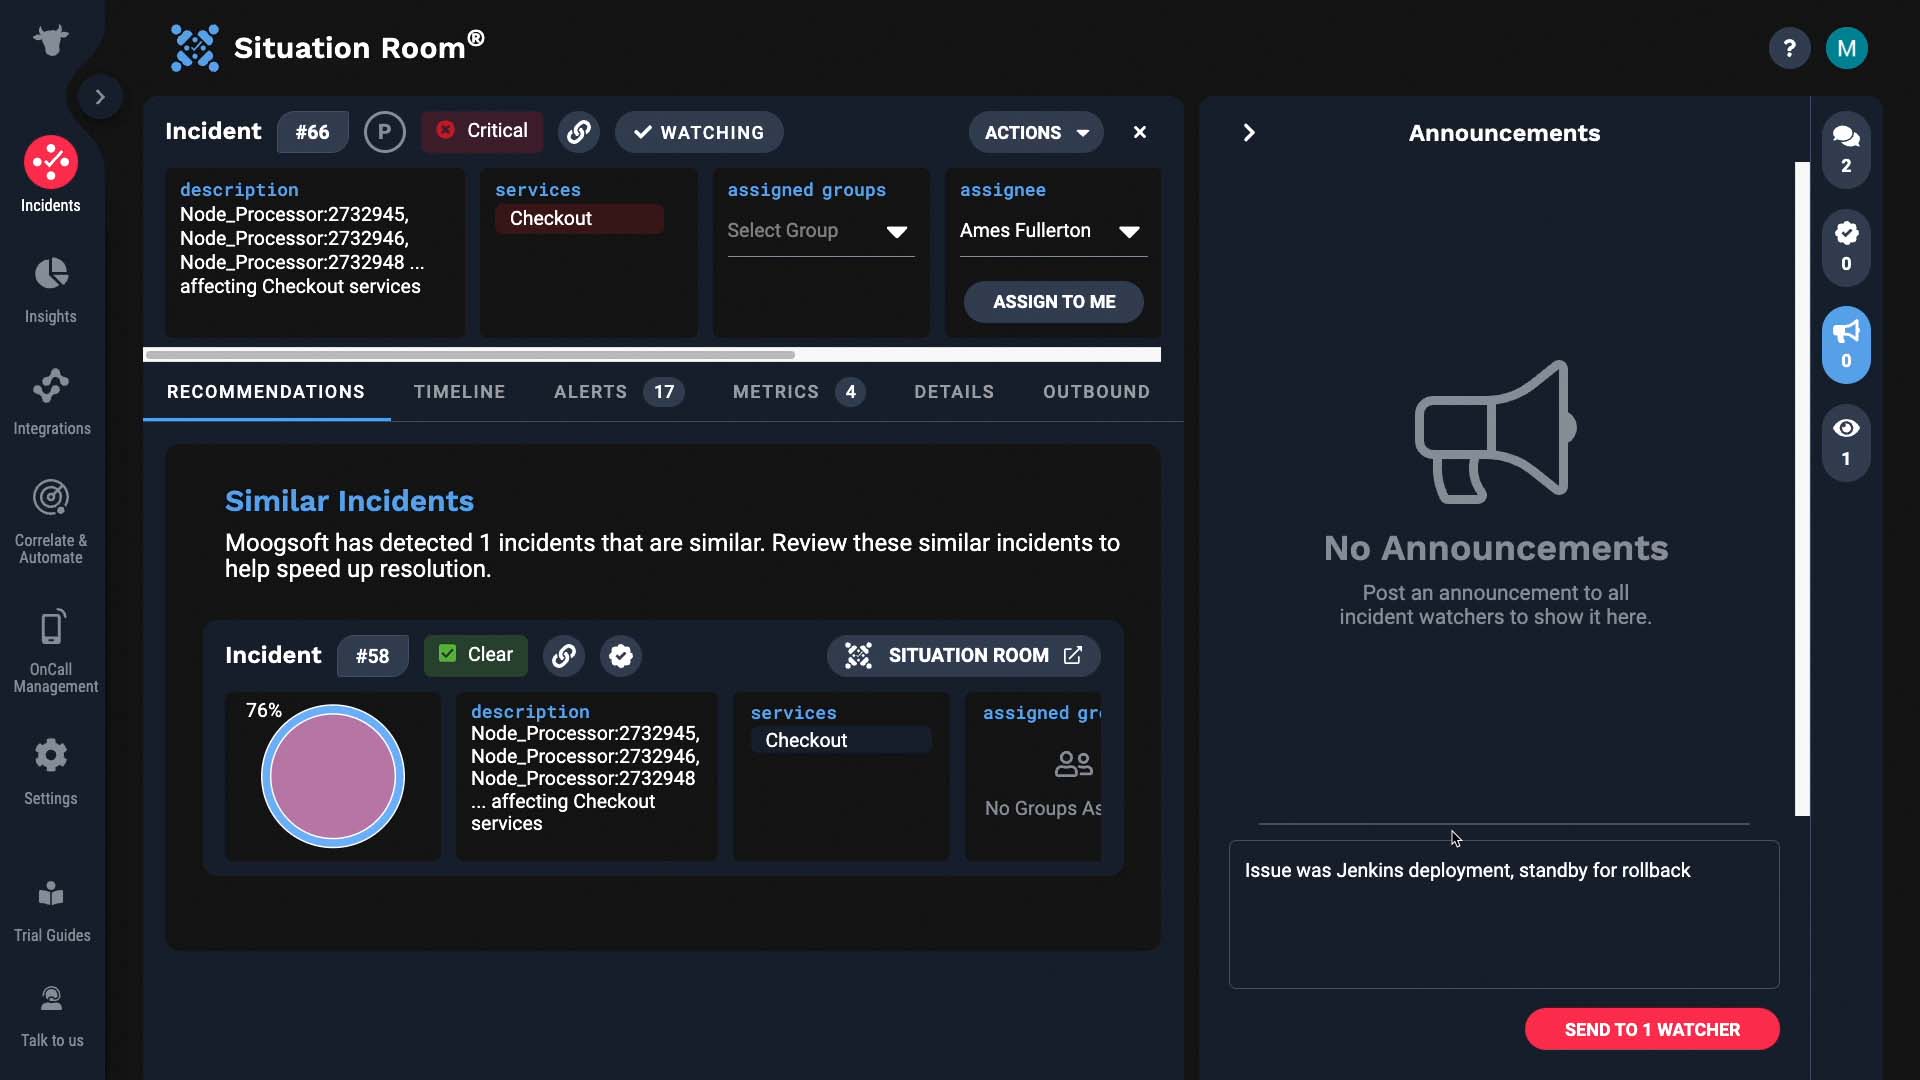
Like this.
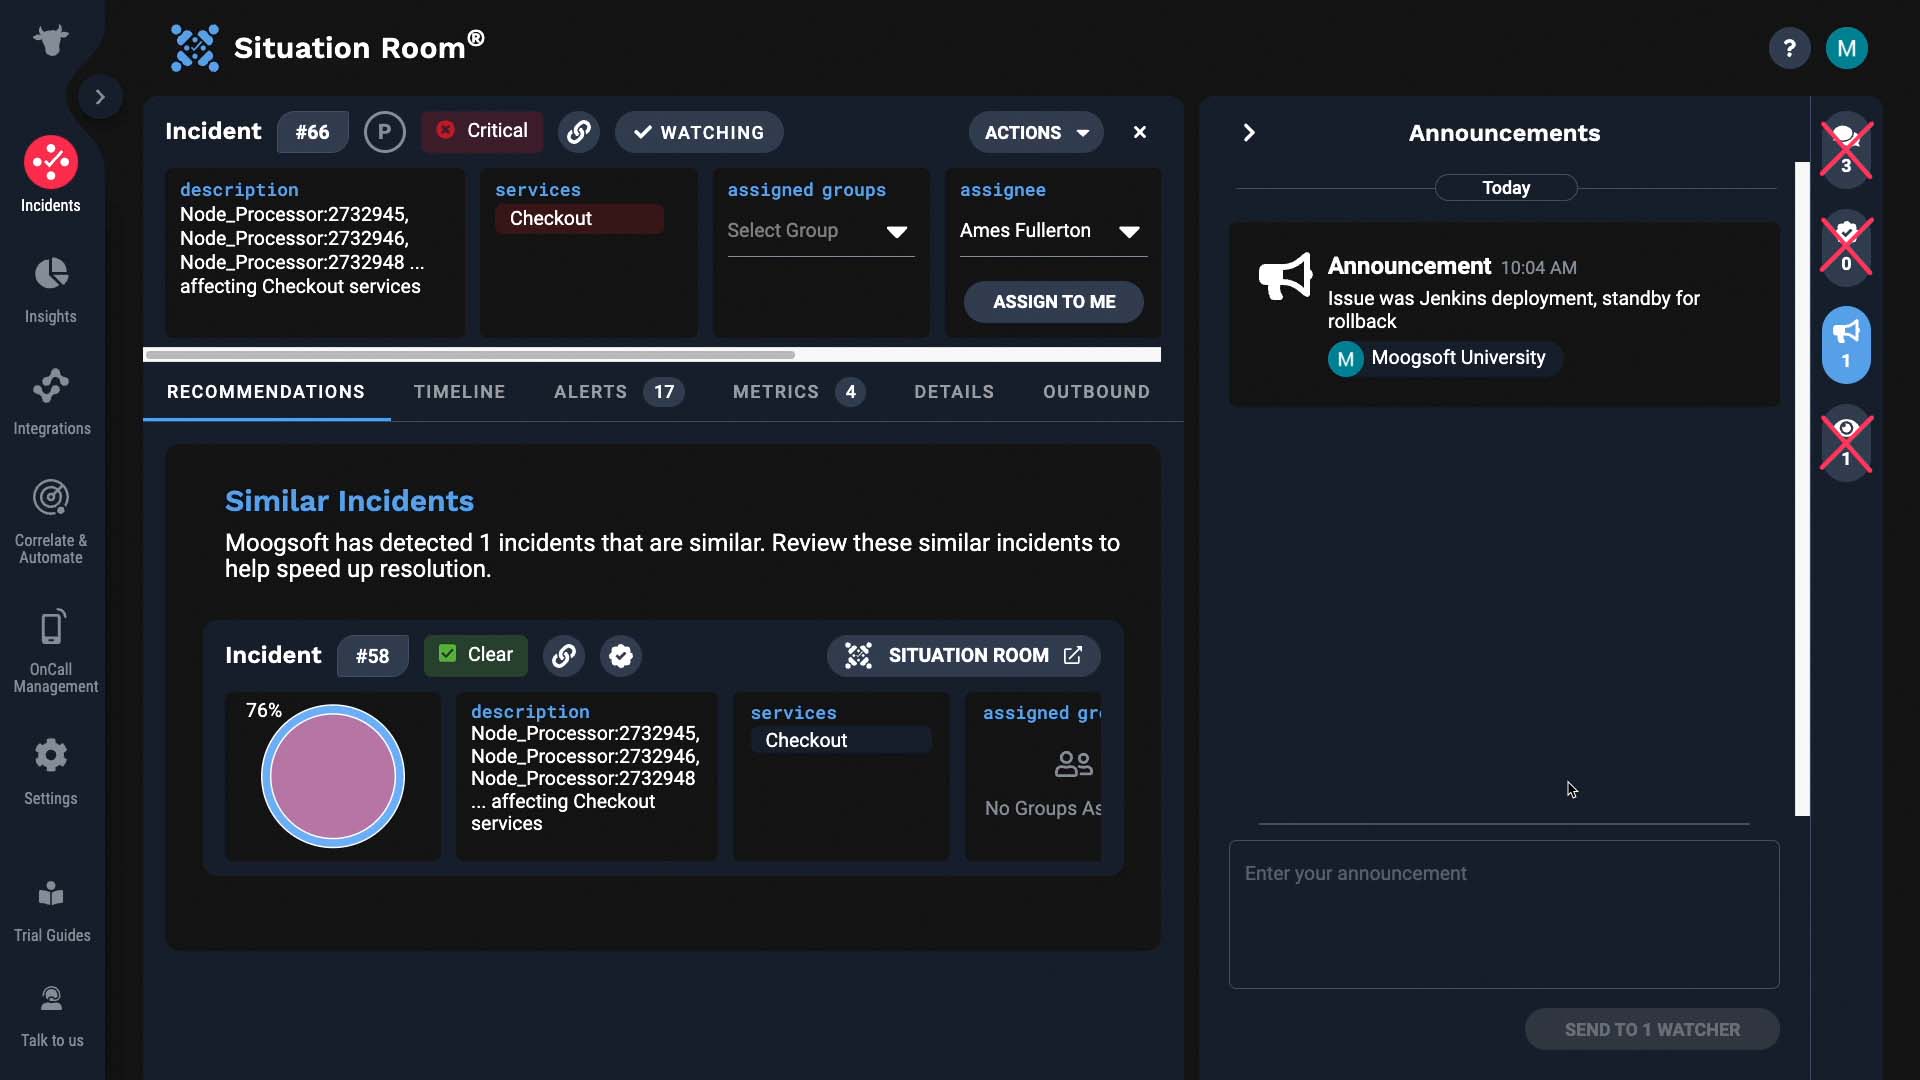
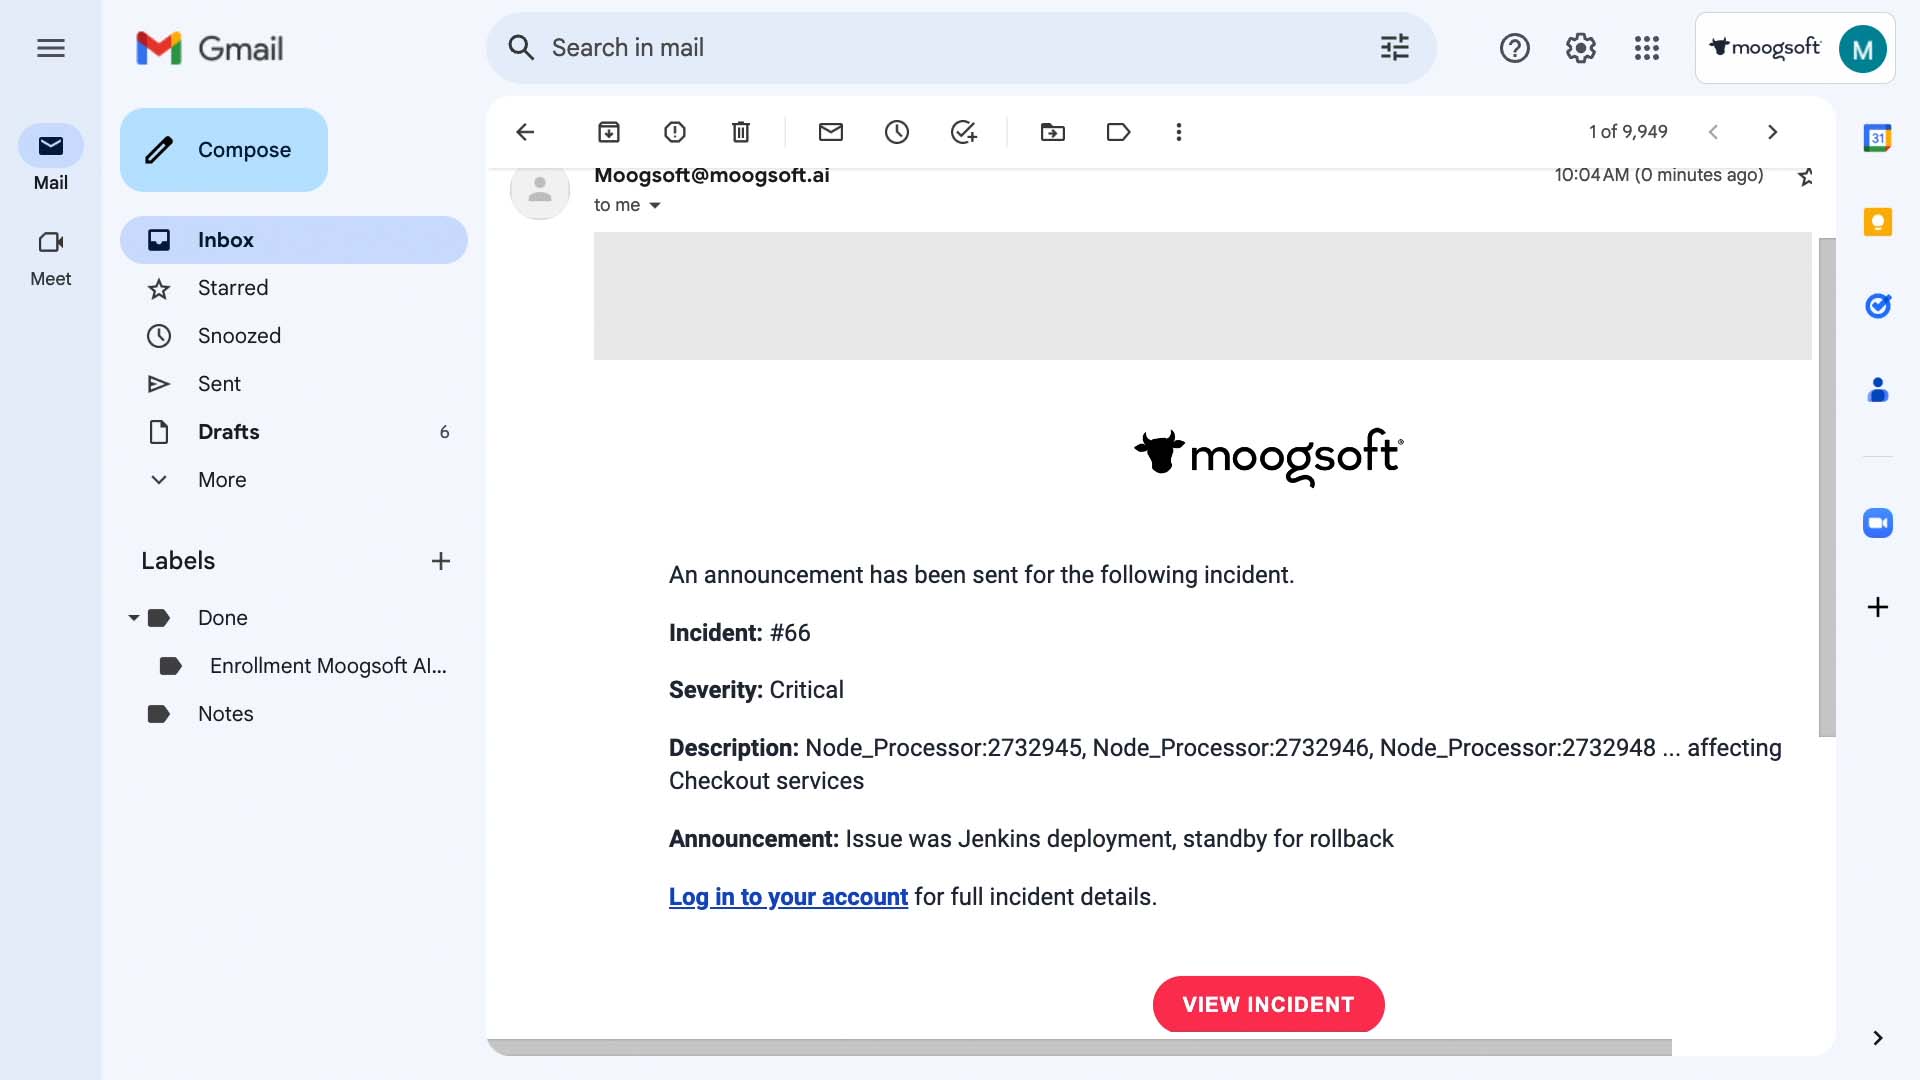
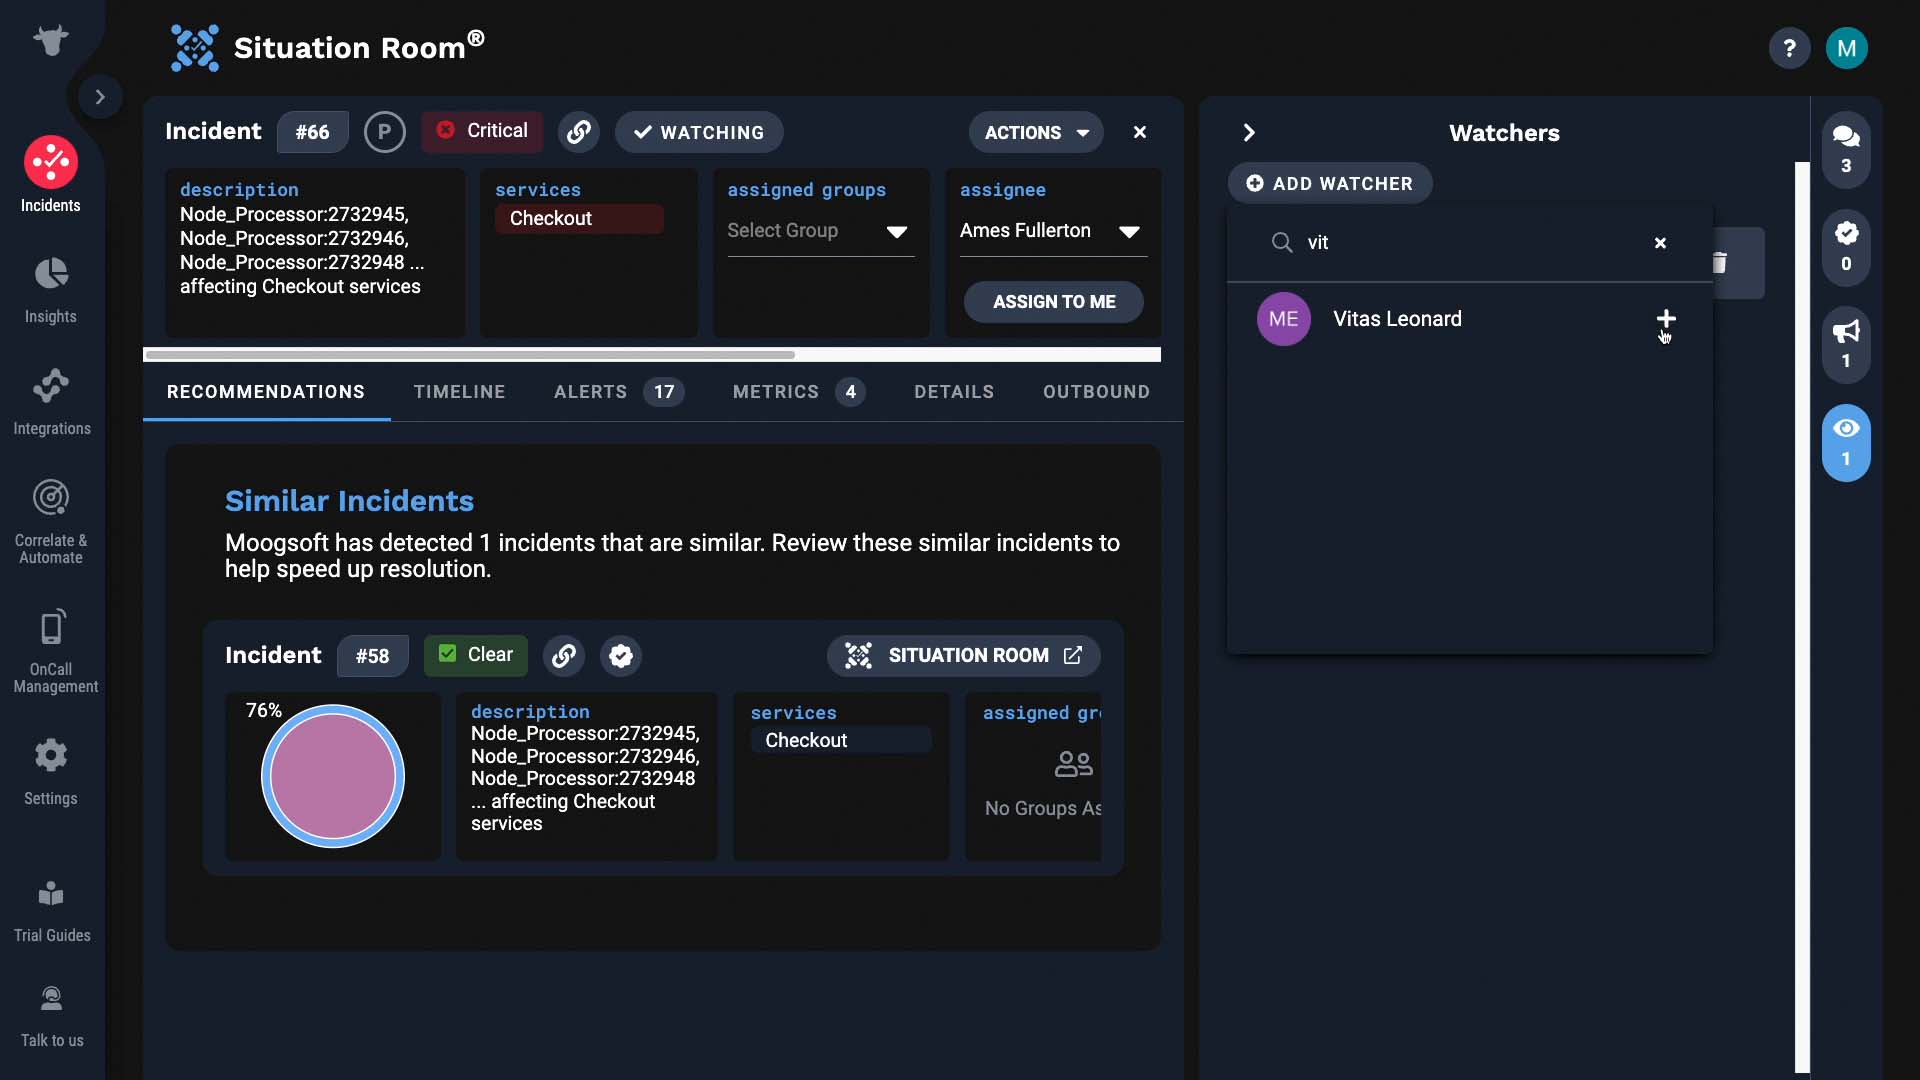
Note that only announcements trigger the notification emails. Also, you can add people other than yourself to incidents, like this:
BASIC | 2 MIN
In this video, you will learn how to create incident list views and share them with others in Moogsoft Cloud.
Use case walkthrough: Shareable views in APEX AIOps Incident Management ►
This video provides a use case walkthrough on using sharable views in APEX AIOps Incident Management to customize the way the incidents list is displayed.
*Please note Moogsoft is now part of Dell's IT Operations solution called APEX AIOps, and changed its name to APEX AIOps Incident Management. The UI in this video may differ slightly but the content covered is still relevant.
Your incident list view is customizable. You can specify which columns are displayed and in what order.
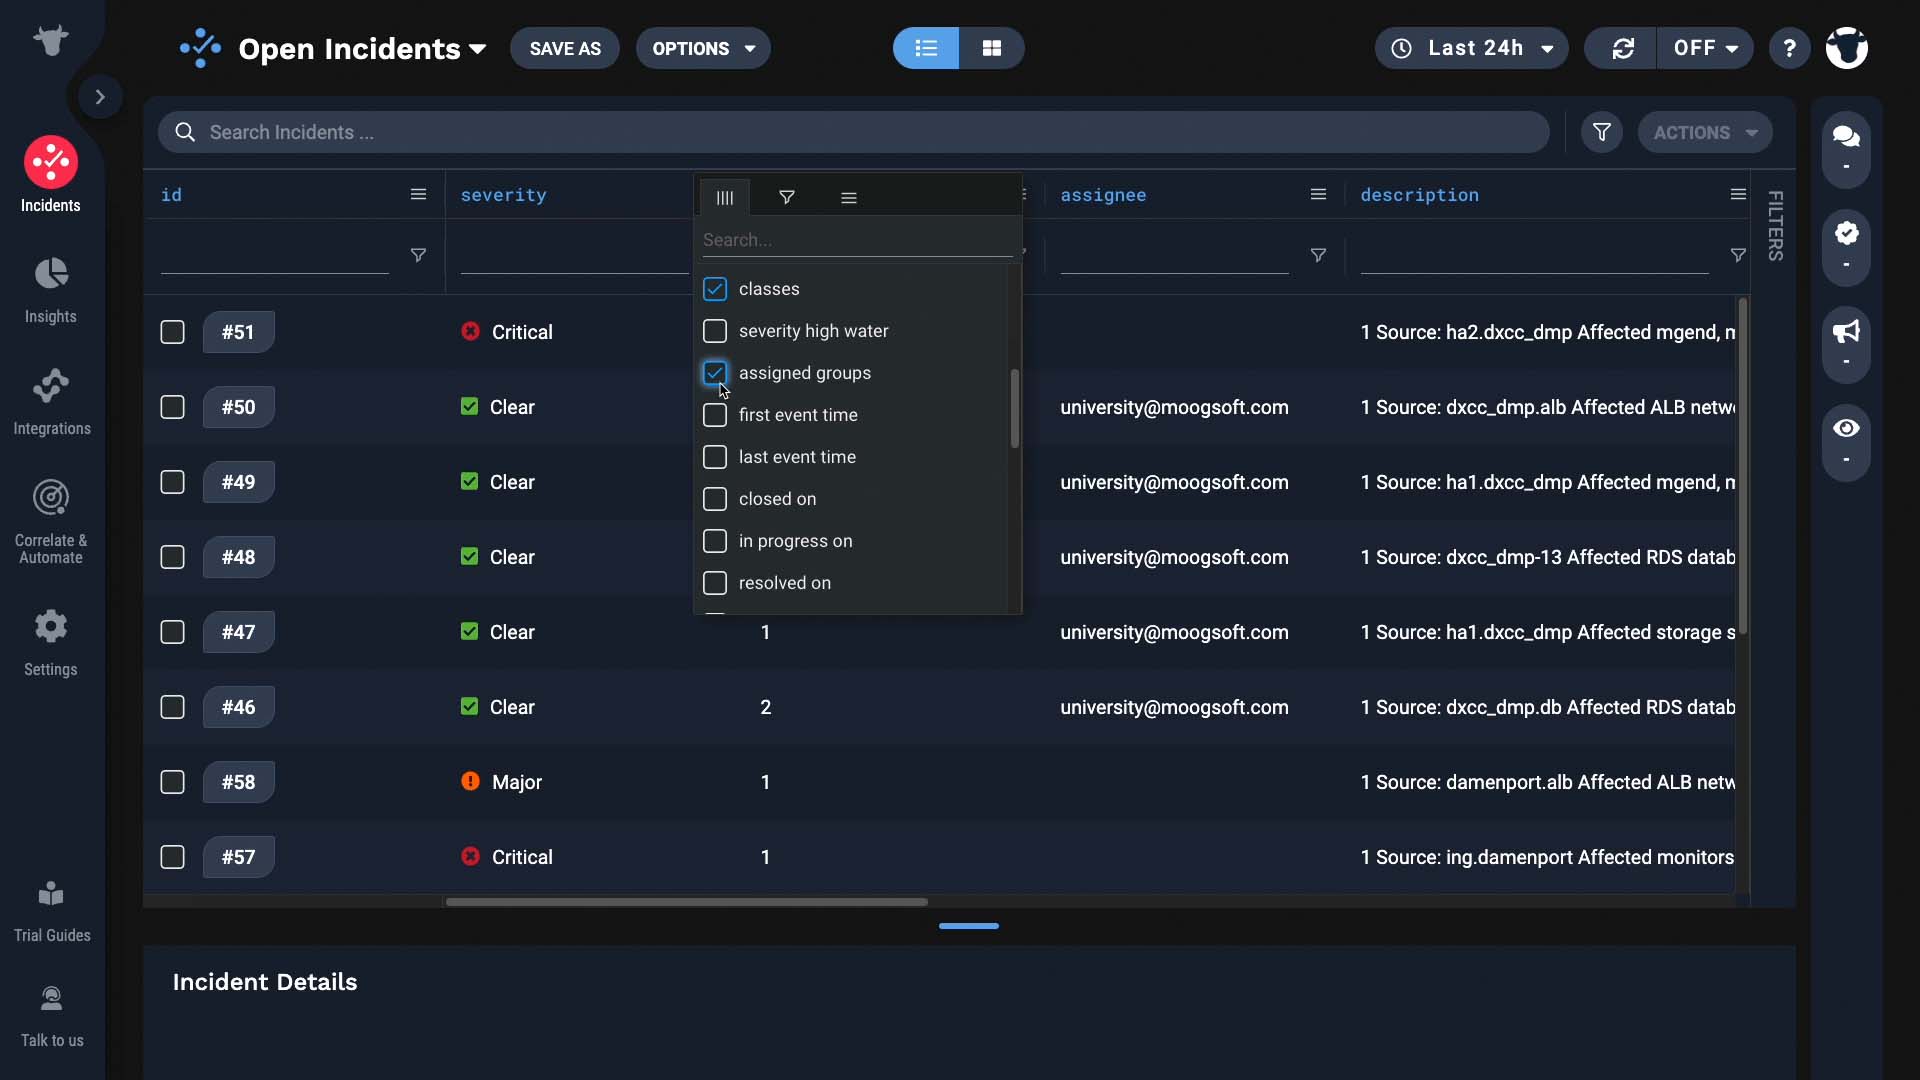
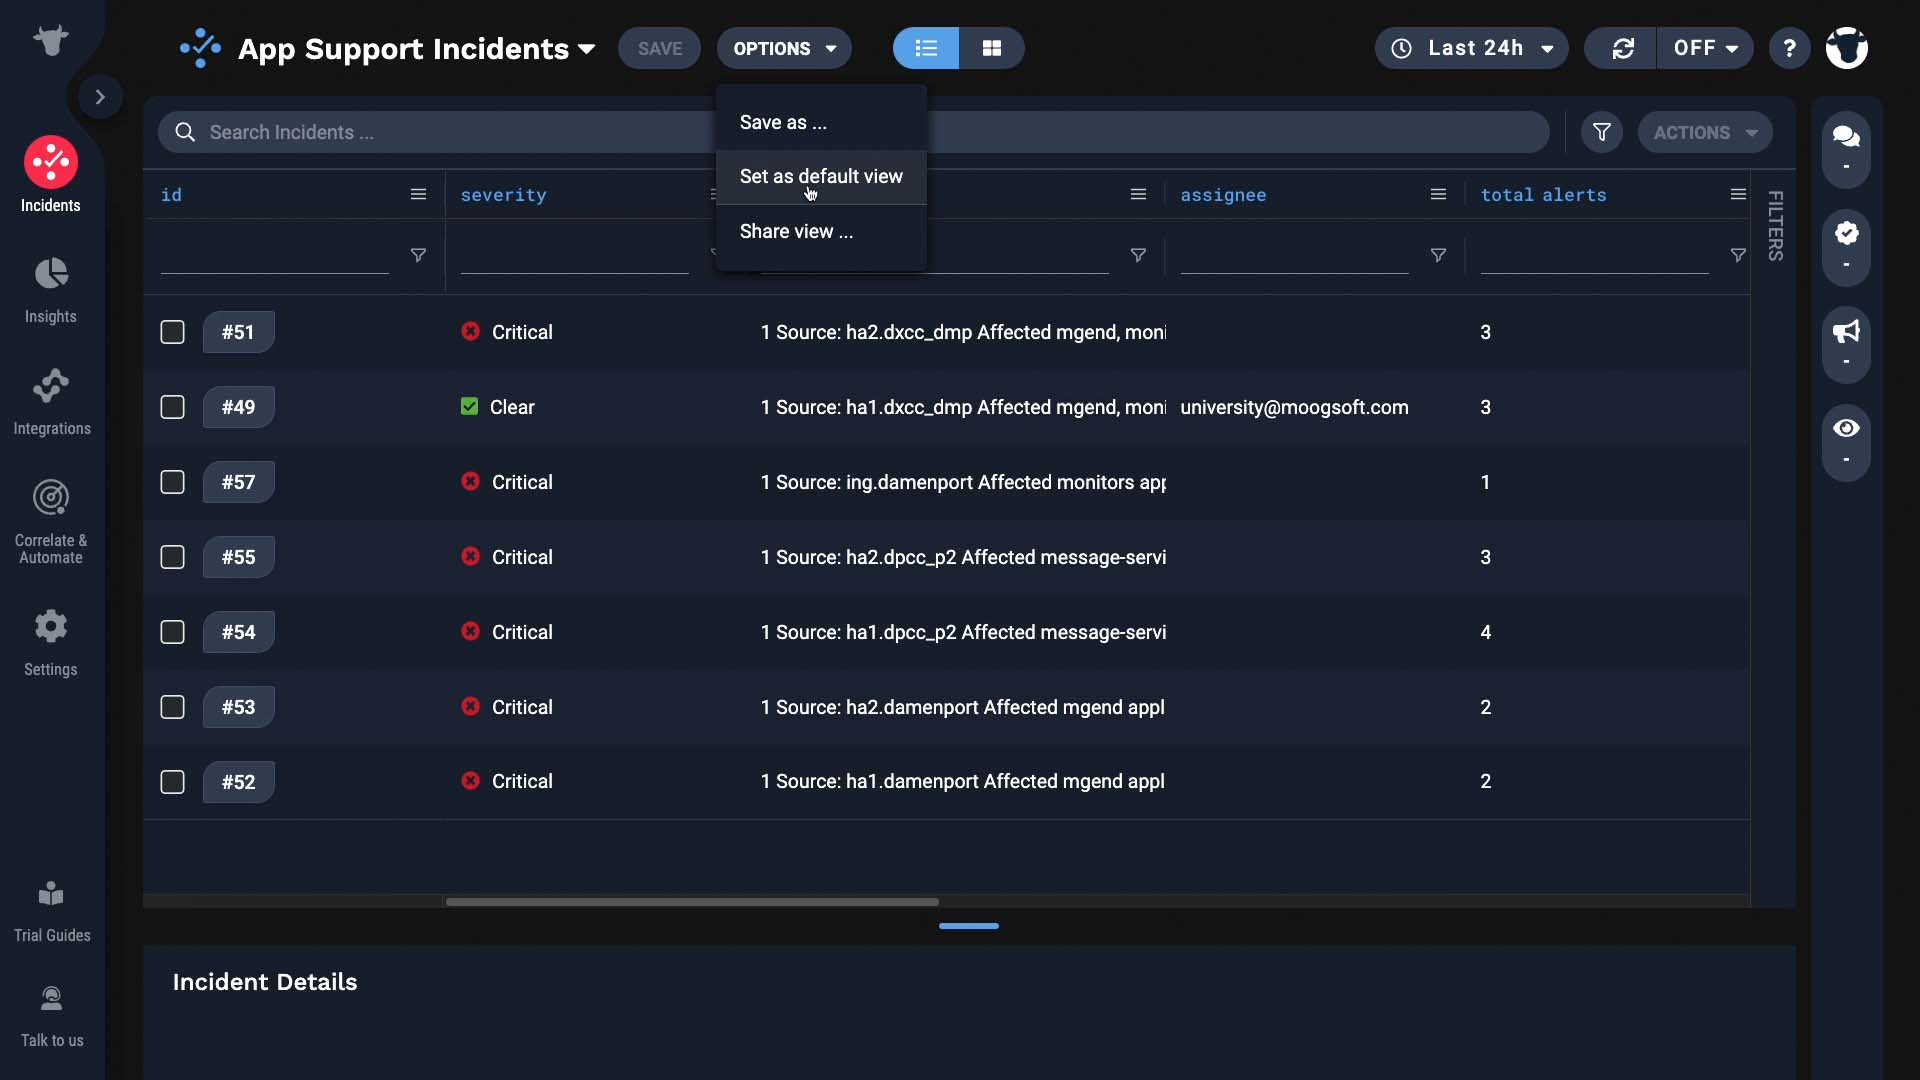
And, you can save those custom views, and share them with your team! Let’s say you are in charge of the App Support group. You can create a filtered view like this and…
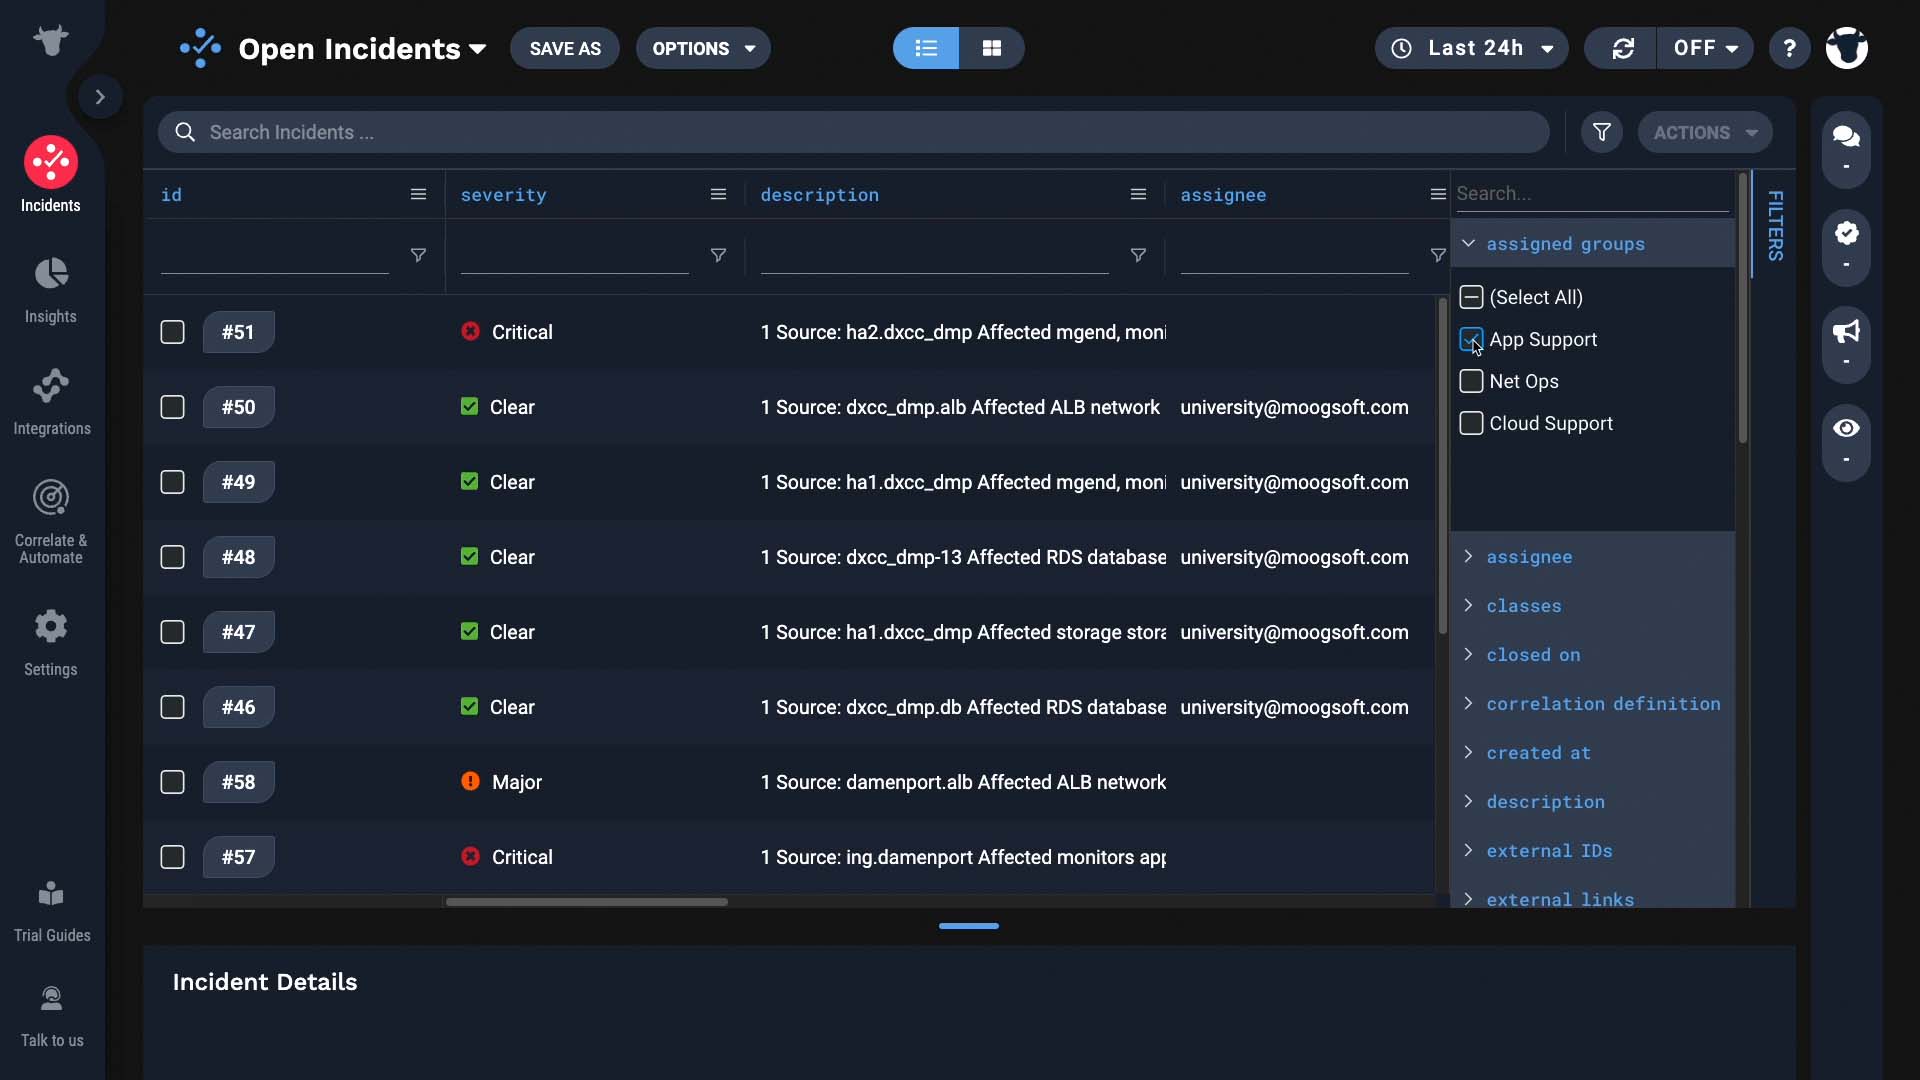
…save it.
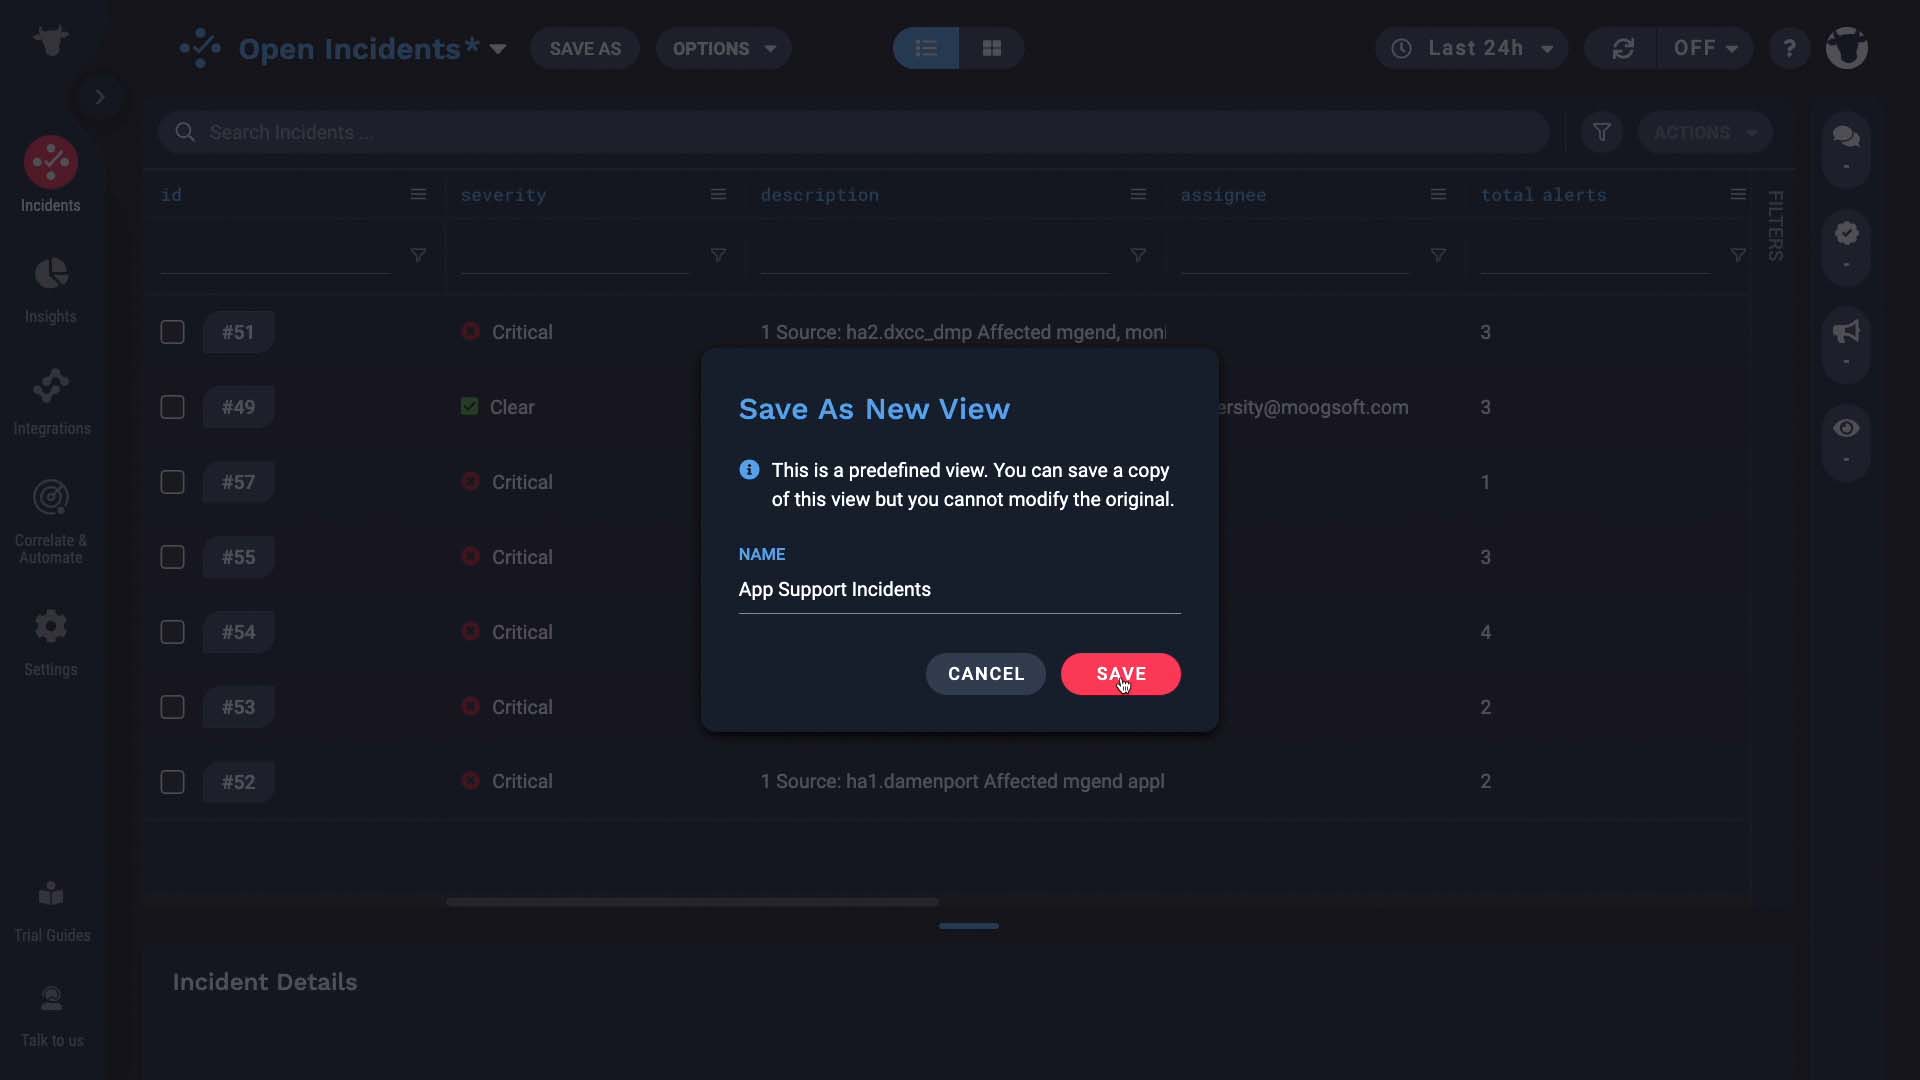
Now you don’t have to reapply filters or rearrange the columns to see the team’s queue.
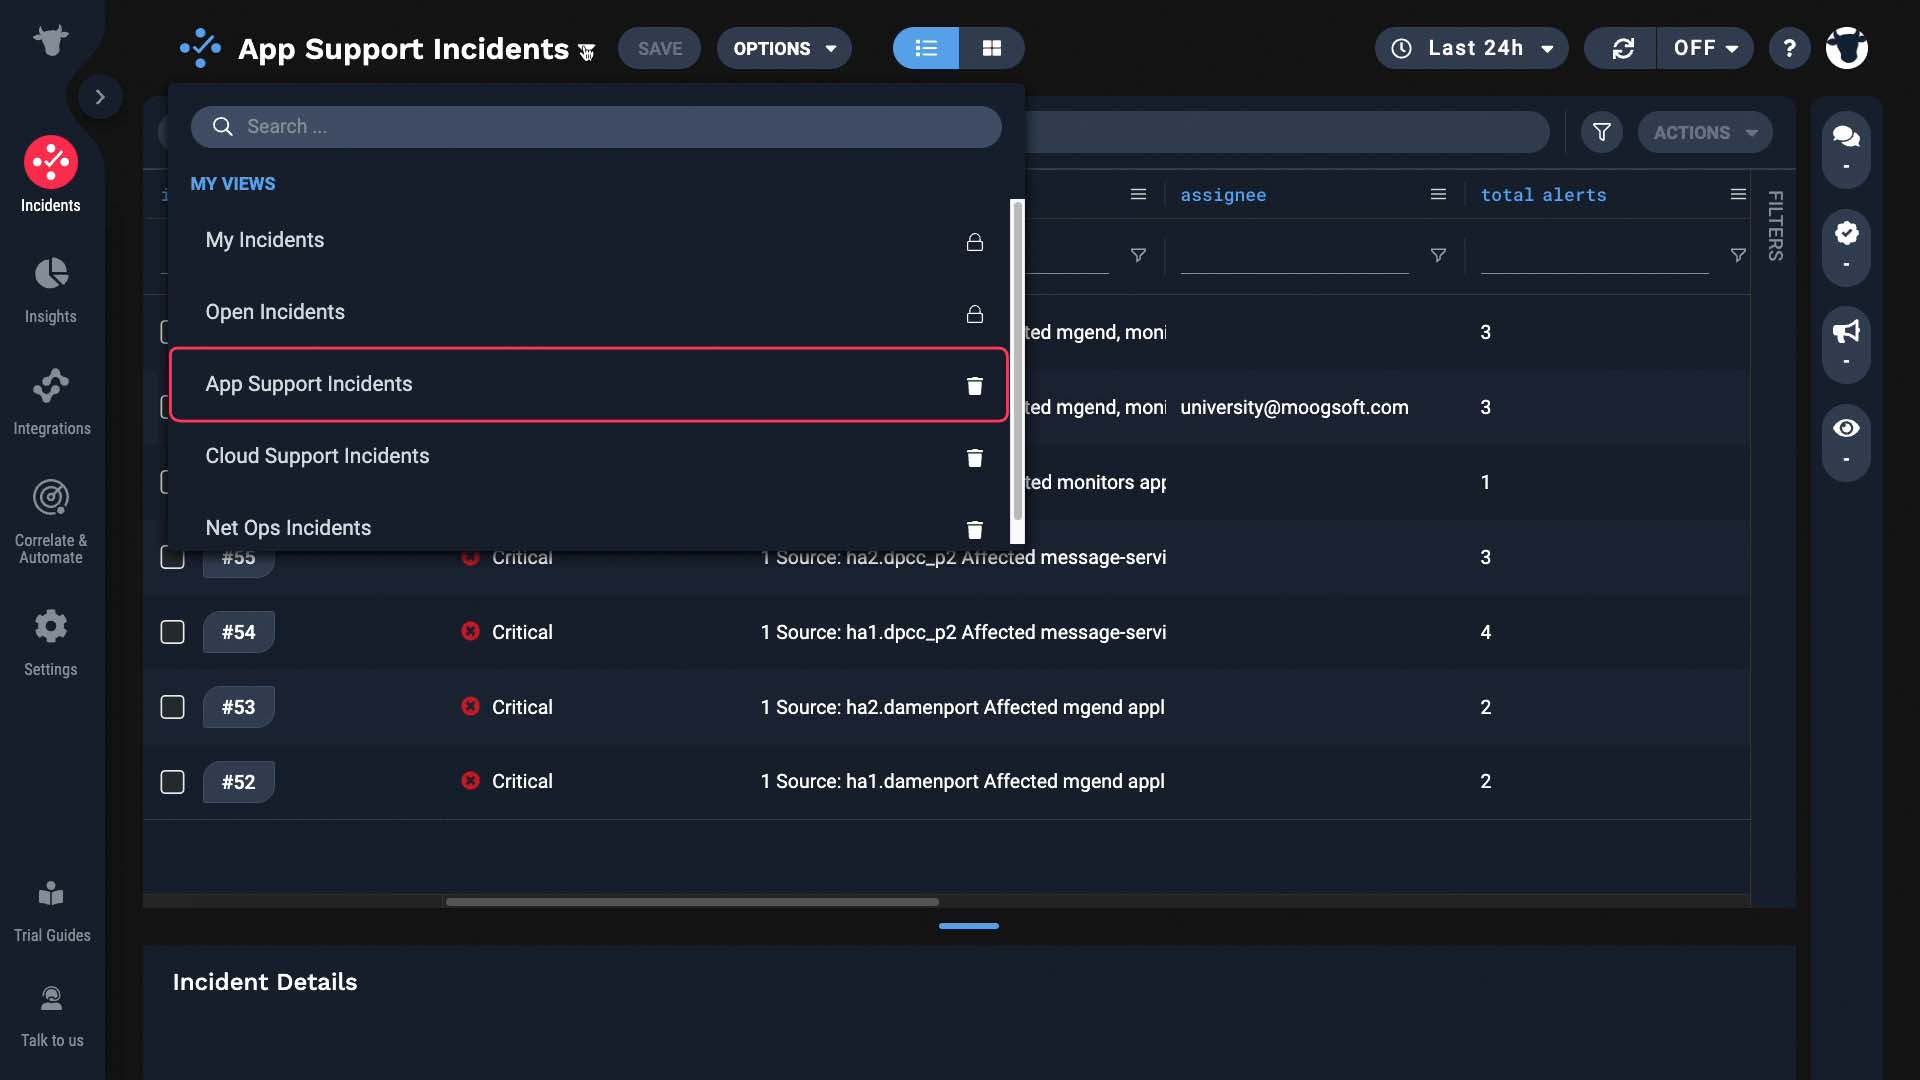
And you can share this view with your team.
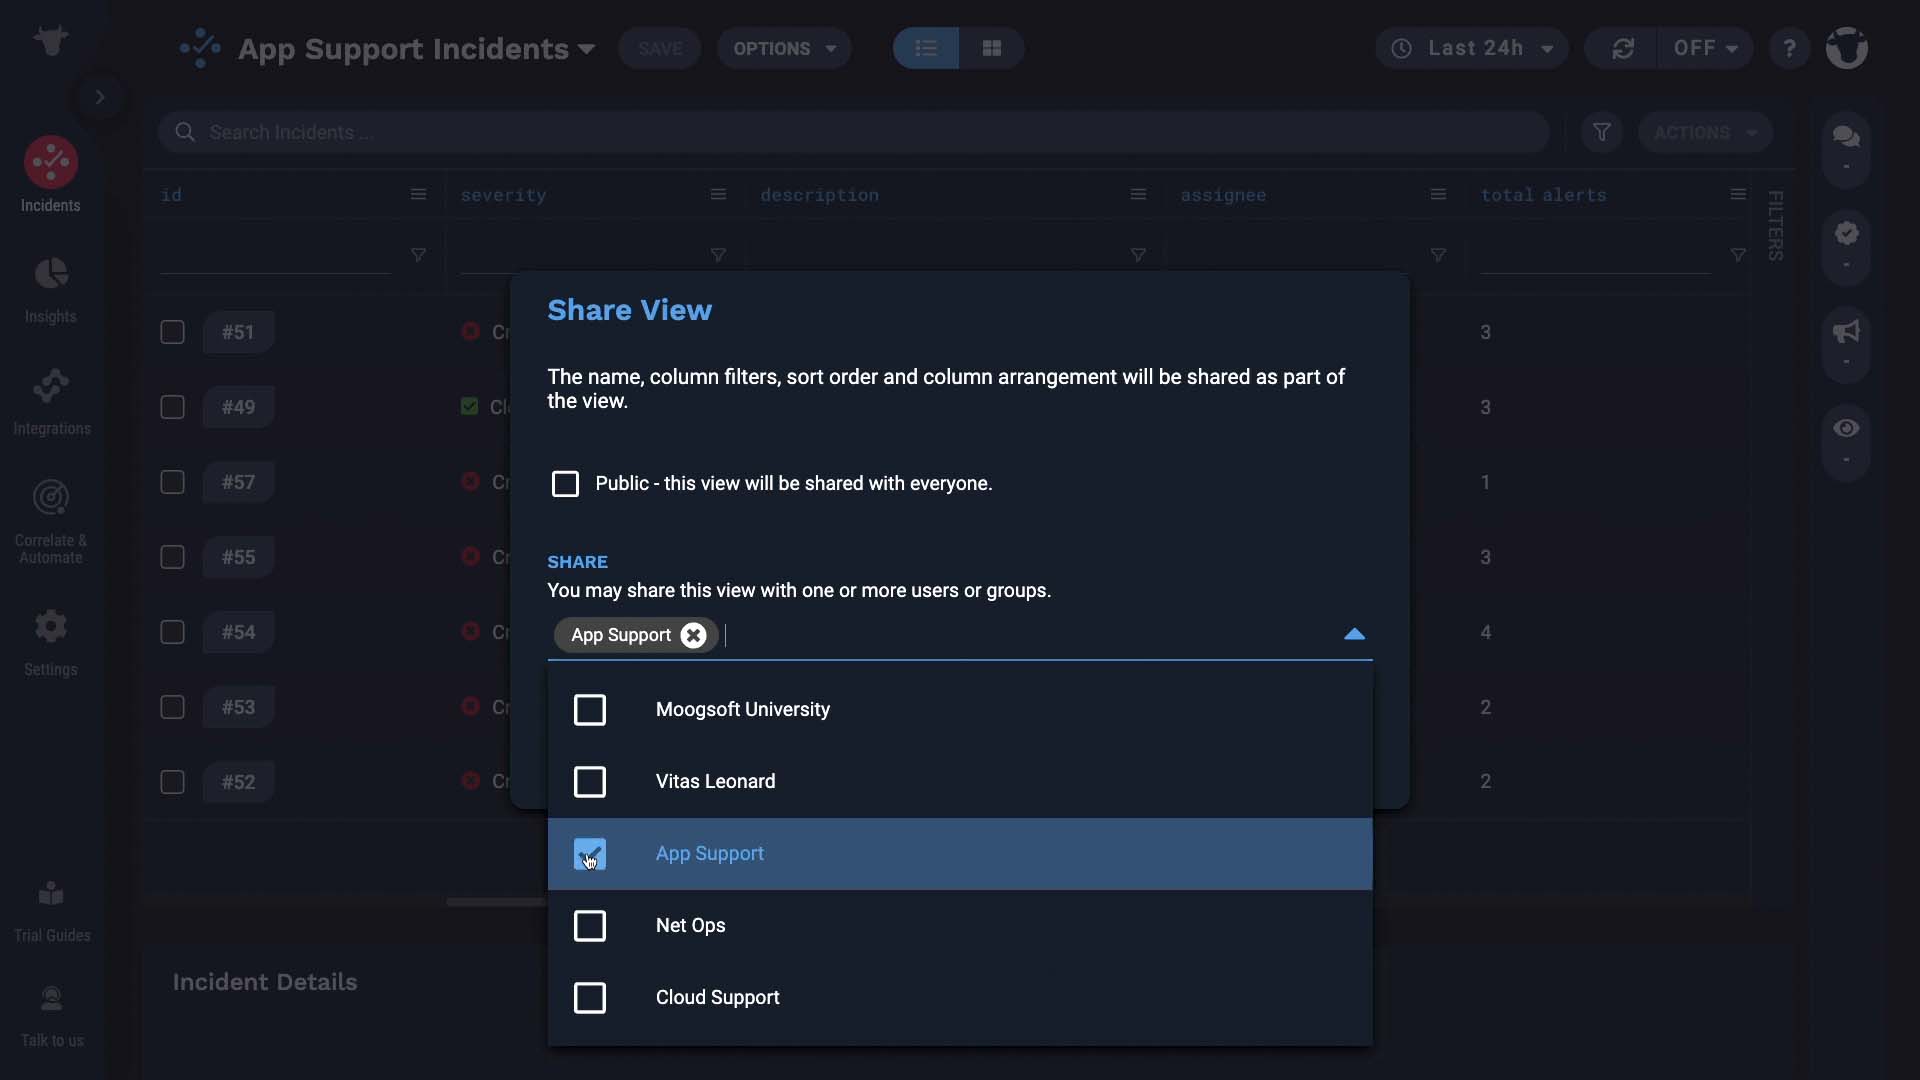
Now everyone on your team is looking at exactly the same list, rendered in the exact same way. They can even save this view as their default view.
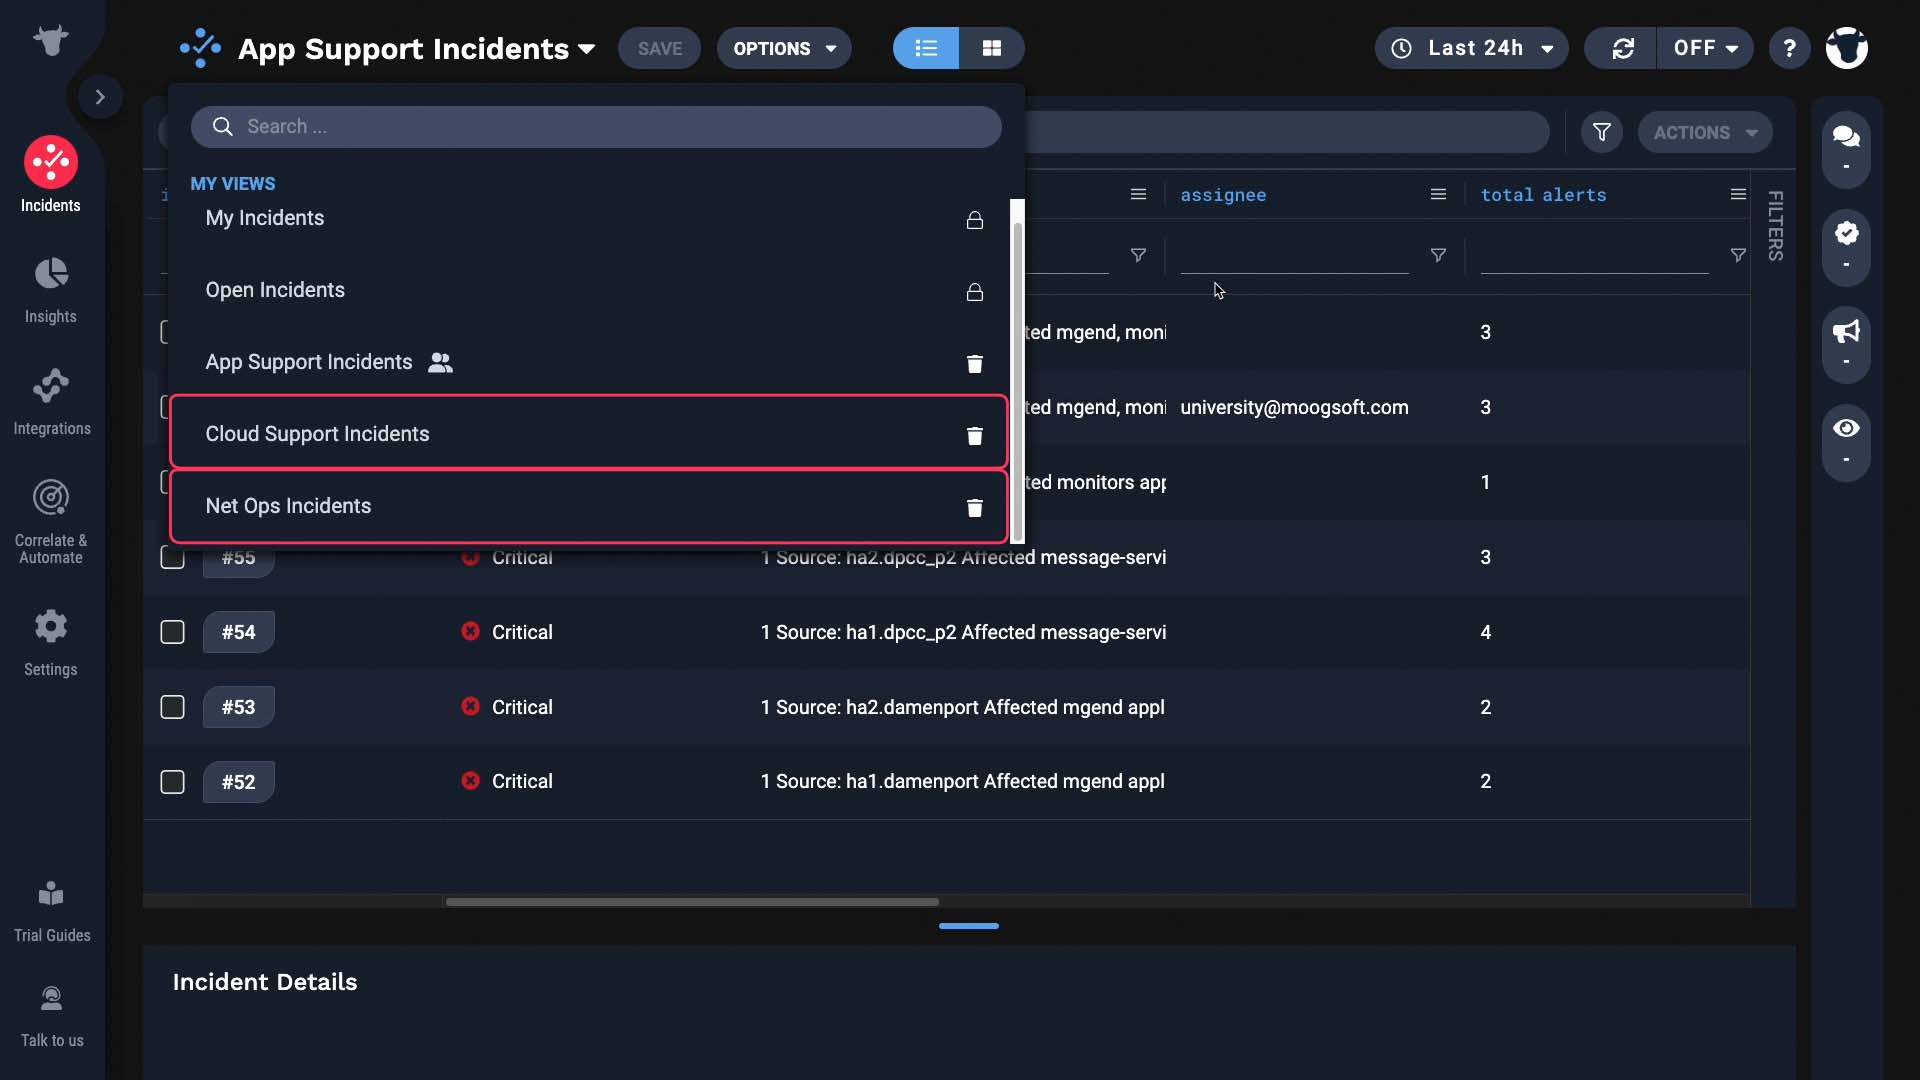
If you are managing multiple teams, you can set up a view for each team.
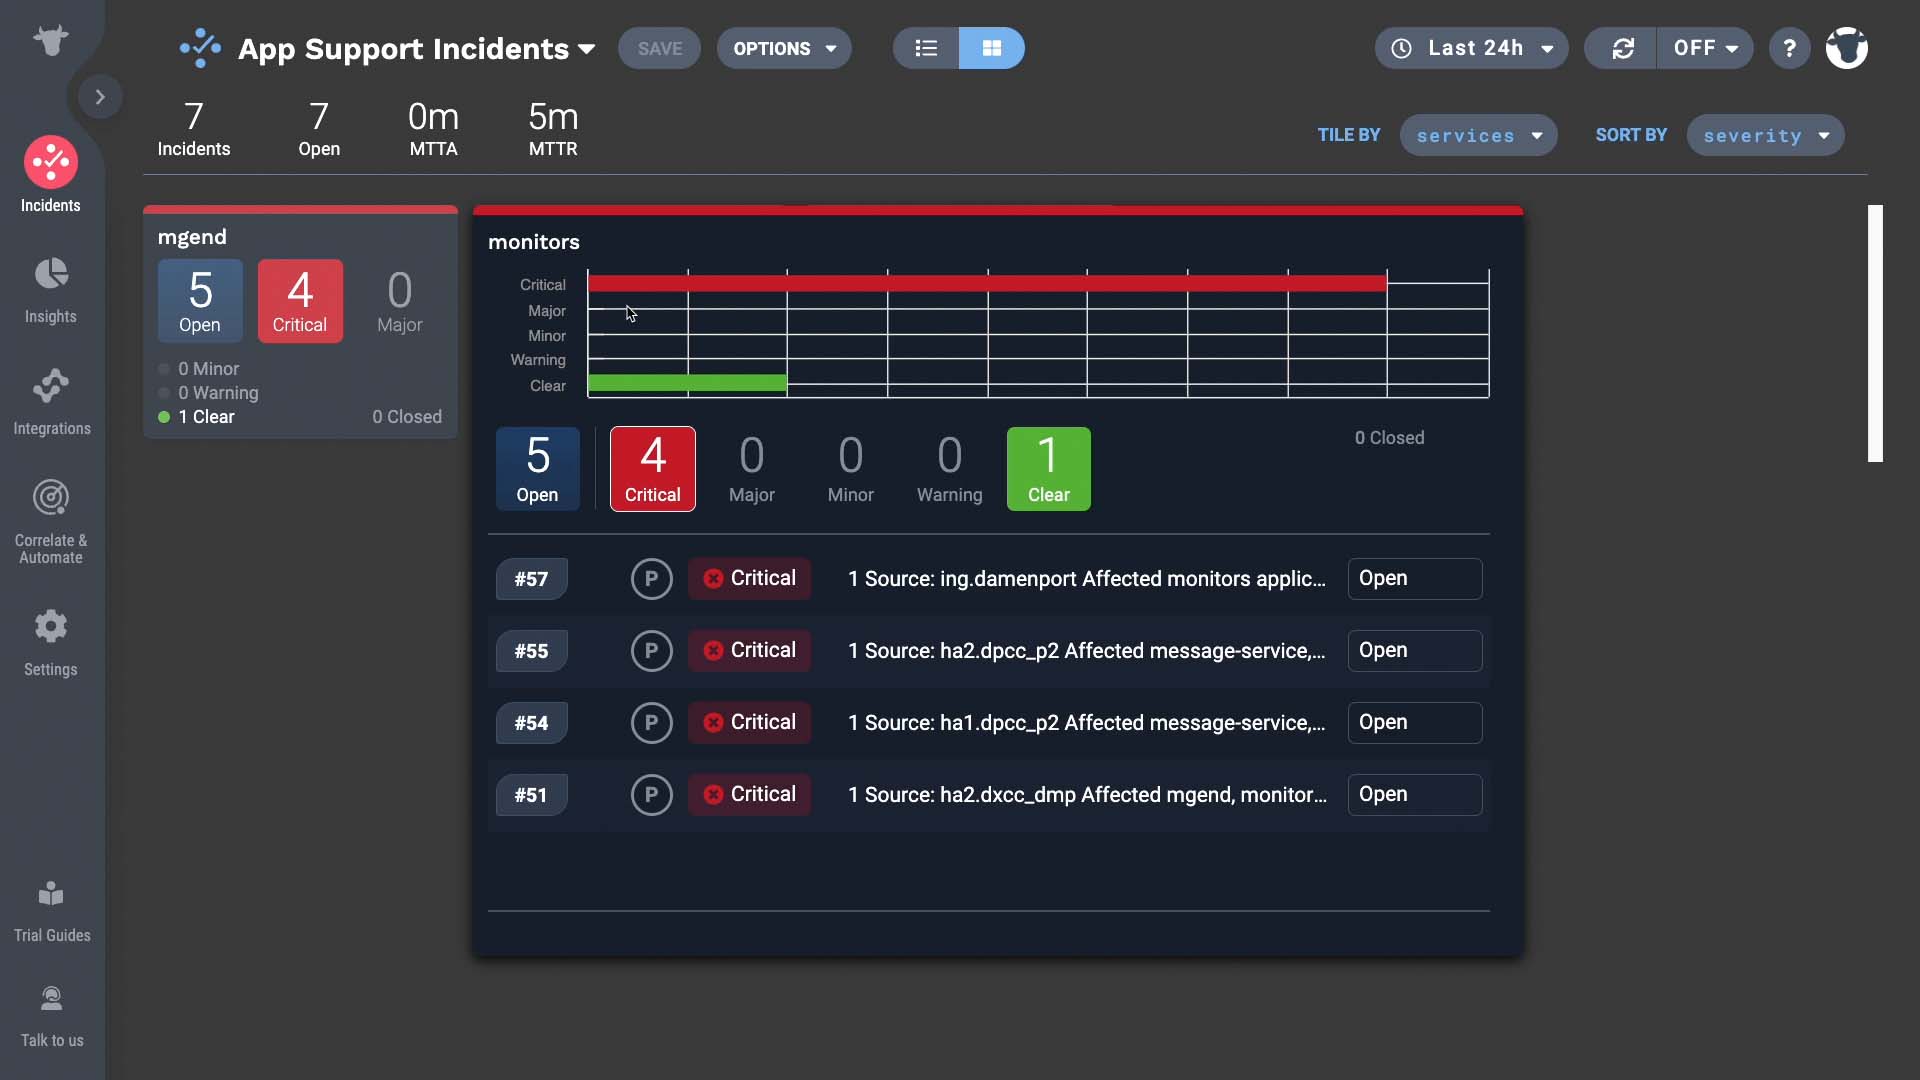
Also, you can switch to a dashboard view of the list. This is just an aggregated view of the same data. But with the dashboard view you can easily see the overall performance of the team, while still being able to drill down to a specific situation. For details about dashboards, watch this video.
Now you know how to create and share custom views with your team. Thanks for watching!
BASIC | 5 MIN
In this video, you’ll see how Moogsoft works to reduce operational noise.
Use case walkthrough: Deduplicate events to reduce noise ►
A busy service with multiple monitors can generate a flood of metrics, anomalies, and events. One issue might trigger a large number of repeat and duplicate events. APEX AIOps Incident Management analyzes every new piece of data — What is this? When did it happen? What is its severity? How often has it happened before? — and aggregates events for the same issue into alerts. Whenever it adds a new event, Incident Management updates the alert fields — event count, last event time, severity — so the alert always contains the latest information about the underlying issue. This process removes the duplicate, repeat, and obsolete noise from the data stream.
*Please note Moogsoft is now part of Dell's IT Operations solution called APEX AIOps, and changed its name to APEX AIOps Incident Management. The UI in this video may differ slightly but the content covered is still relevant.
One of the benefits of implementing Incident Management is that you can reduce noise, and focus on what matters. In this video, we’ll take a look at the noise reduction mechanism, using sample data from the real world.
We’ve extracted this sample data from an actual monitoring environment. The data is anonymized, but the events are real.
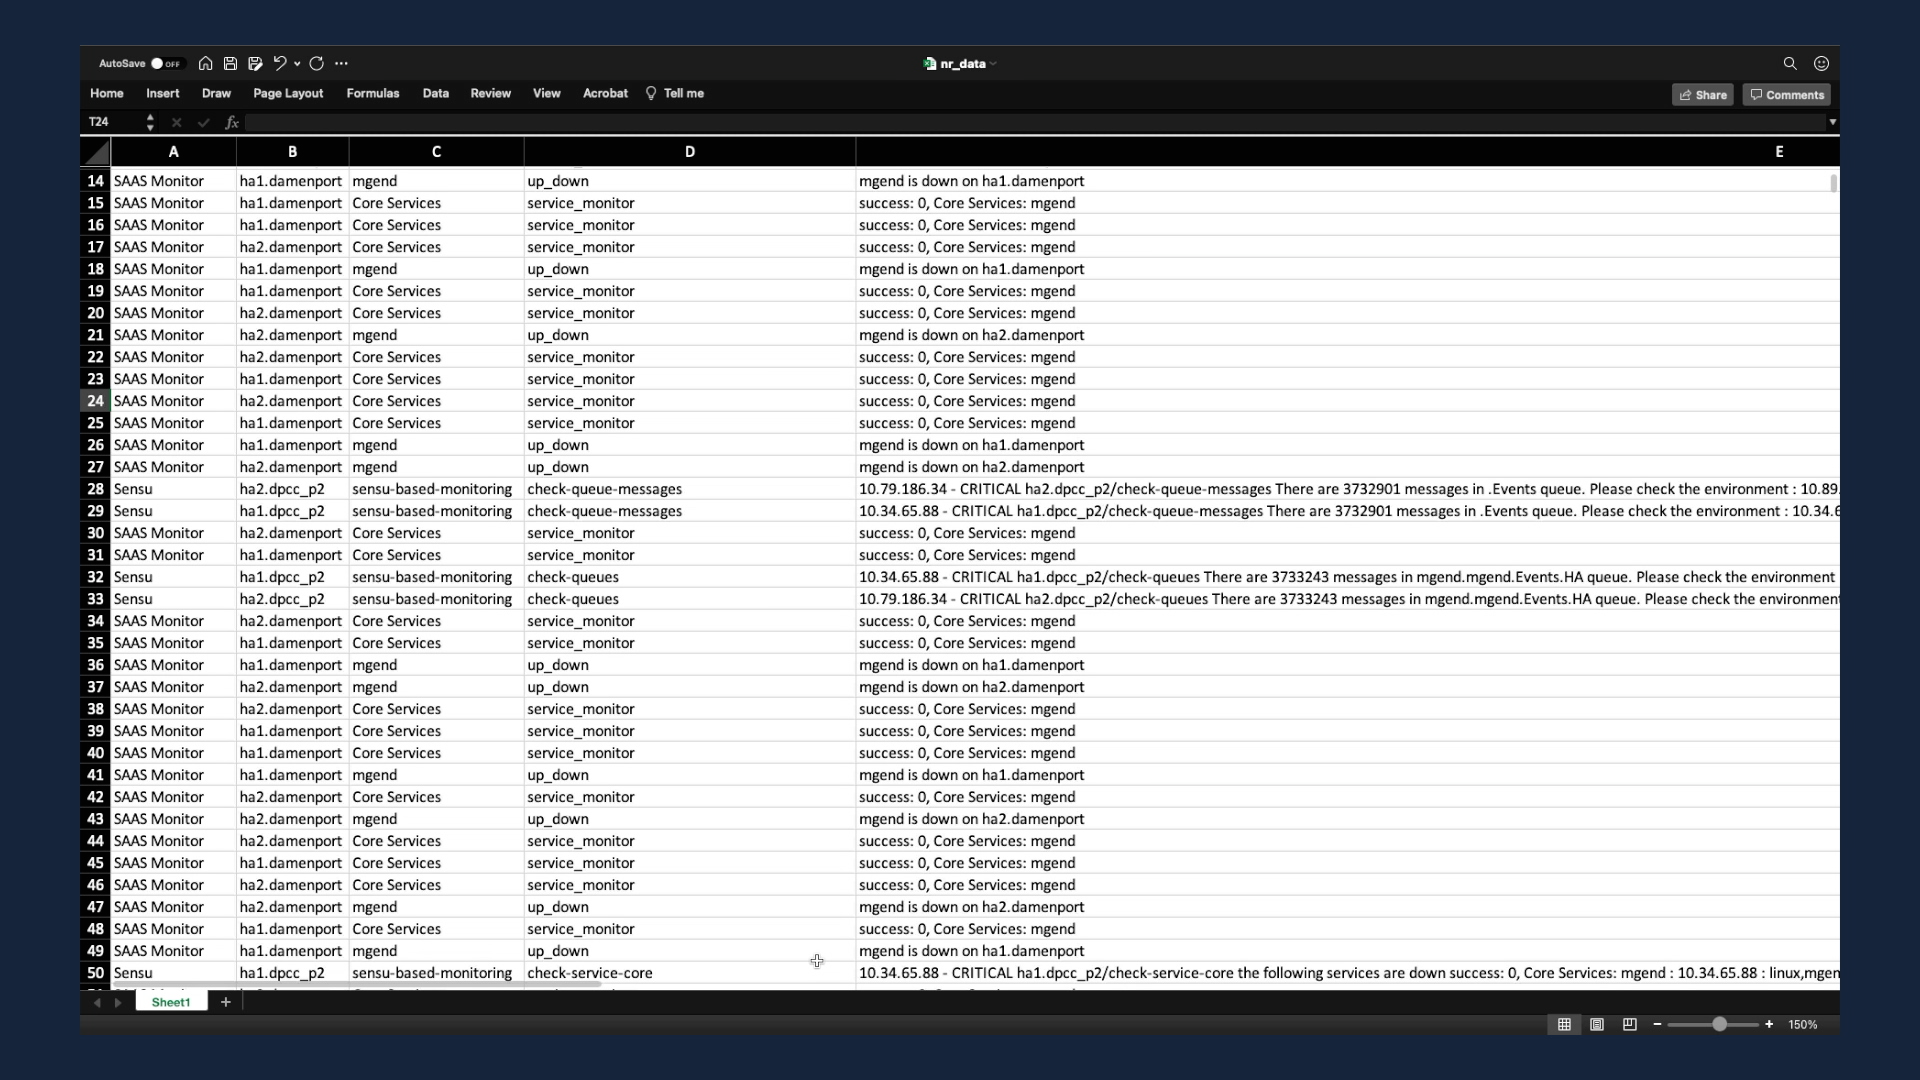
The event data is coming from three different sources: Cloudwatch, a home grown monitoring tool, and Sensu. These three tools have been monitoring a SaaS applications environment.
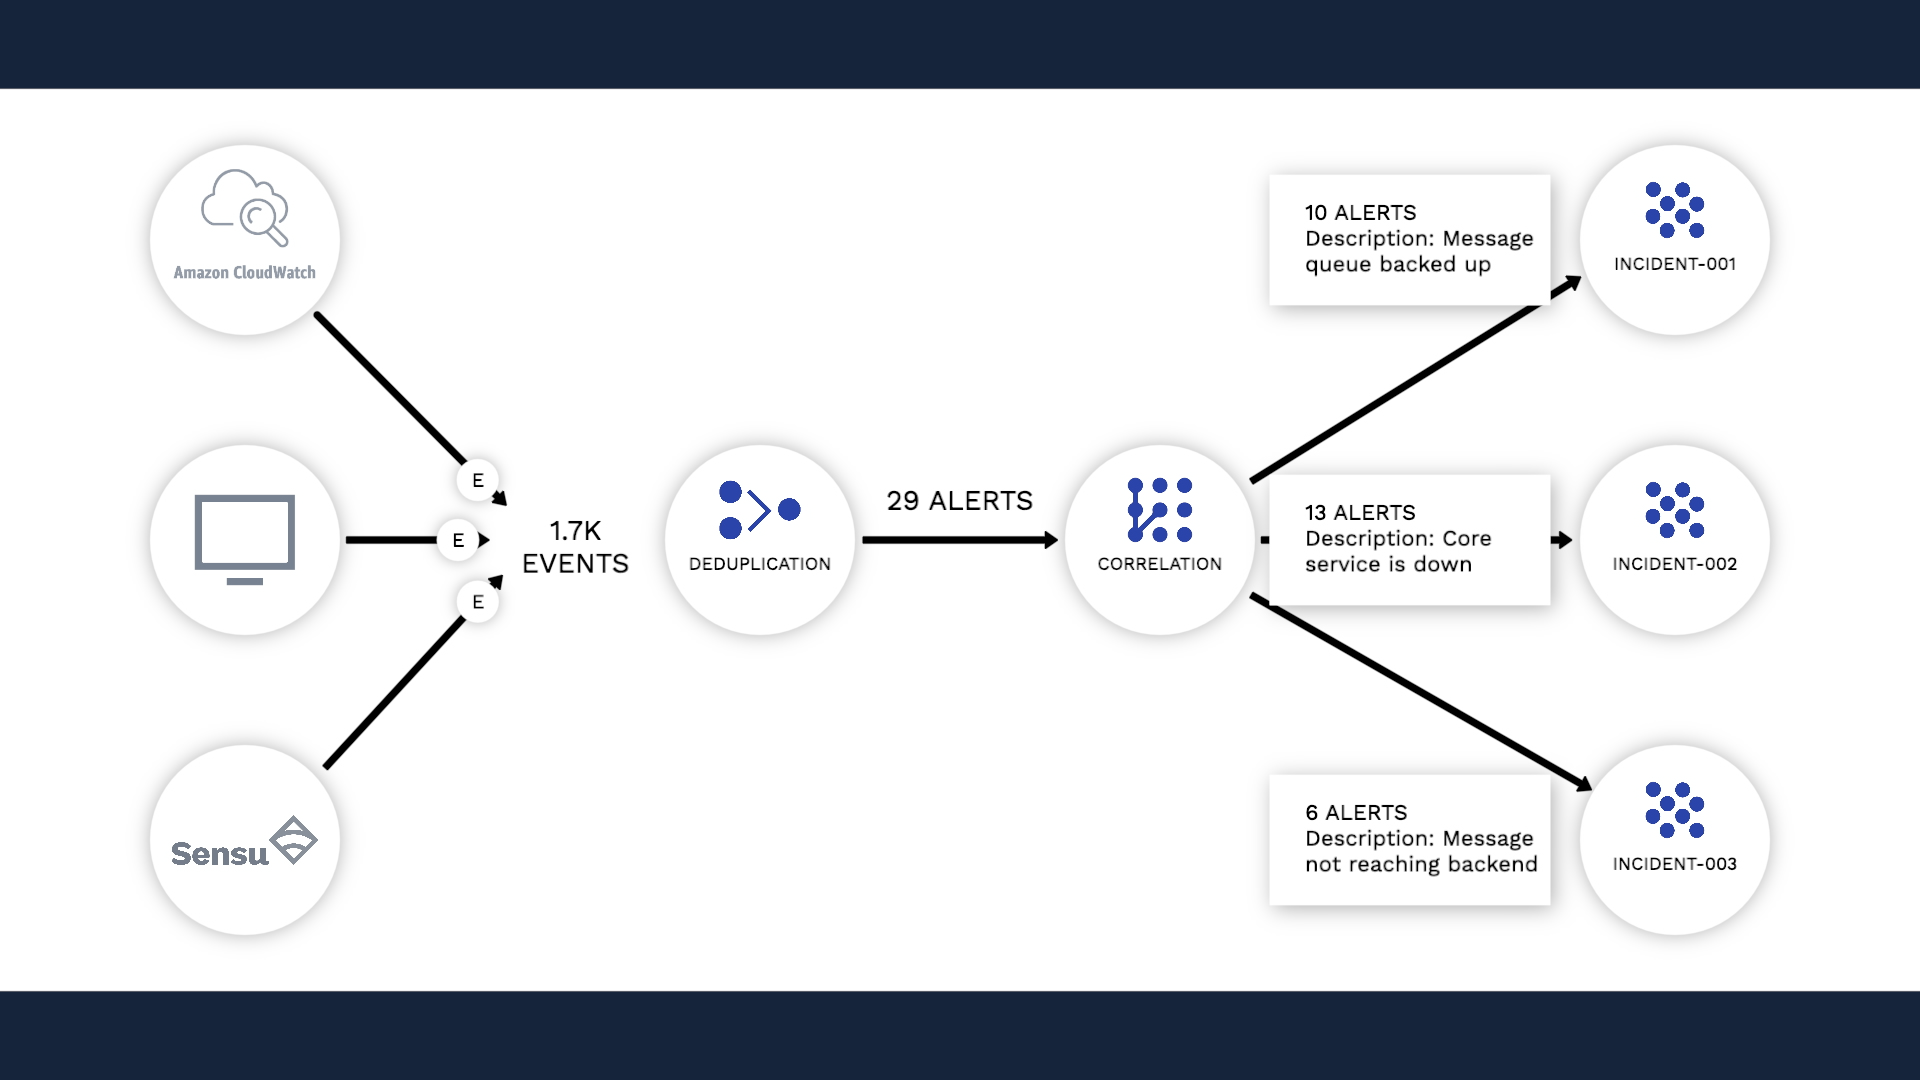
Here we’ve got about 1700 events. Let’s feed this to Incident Management and see what happens.
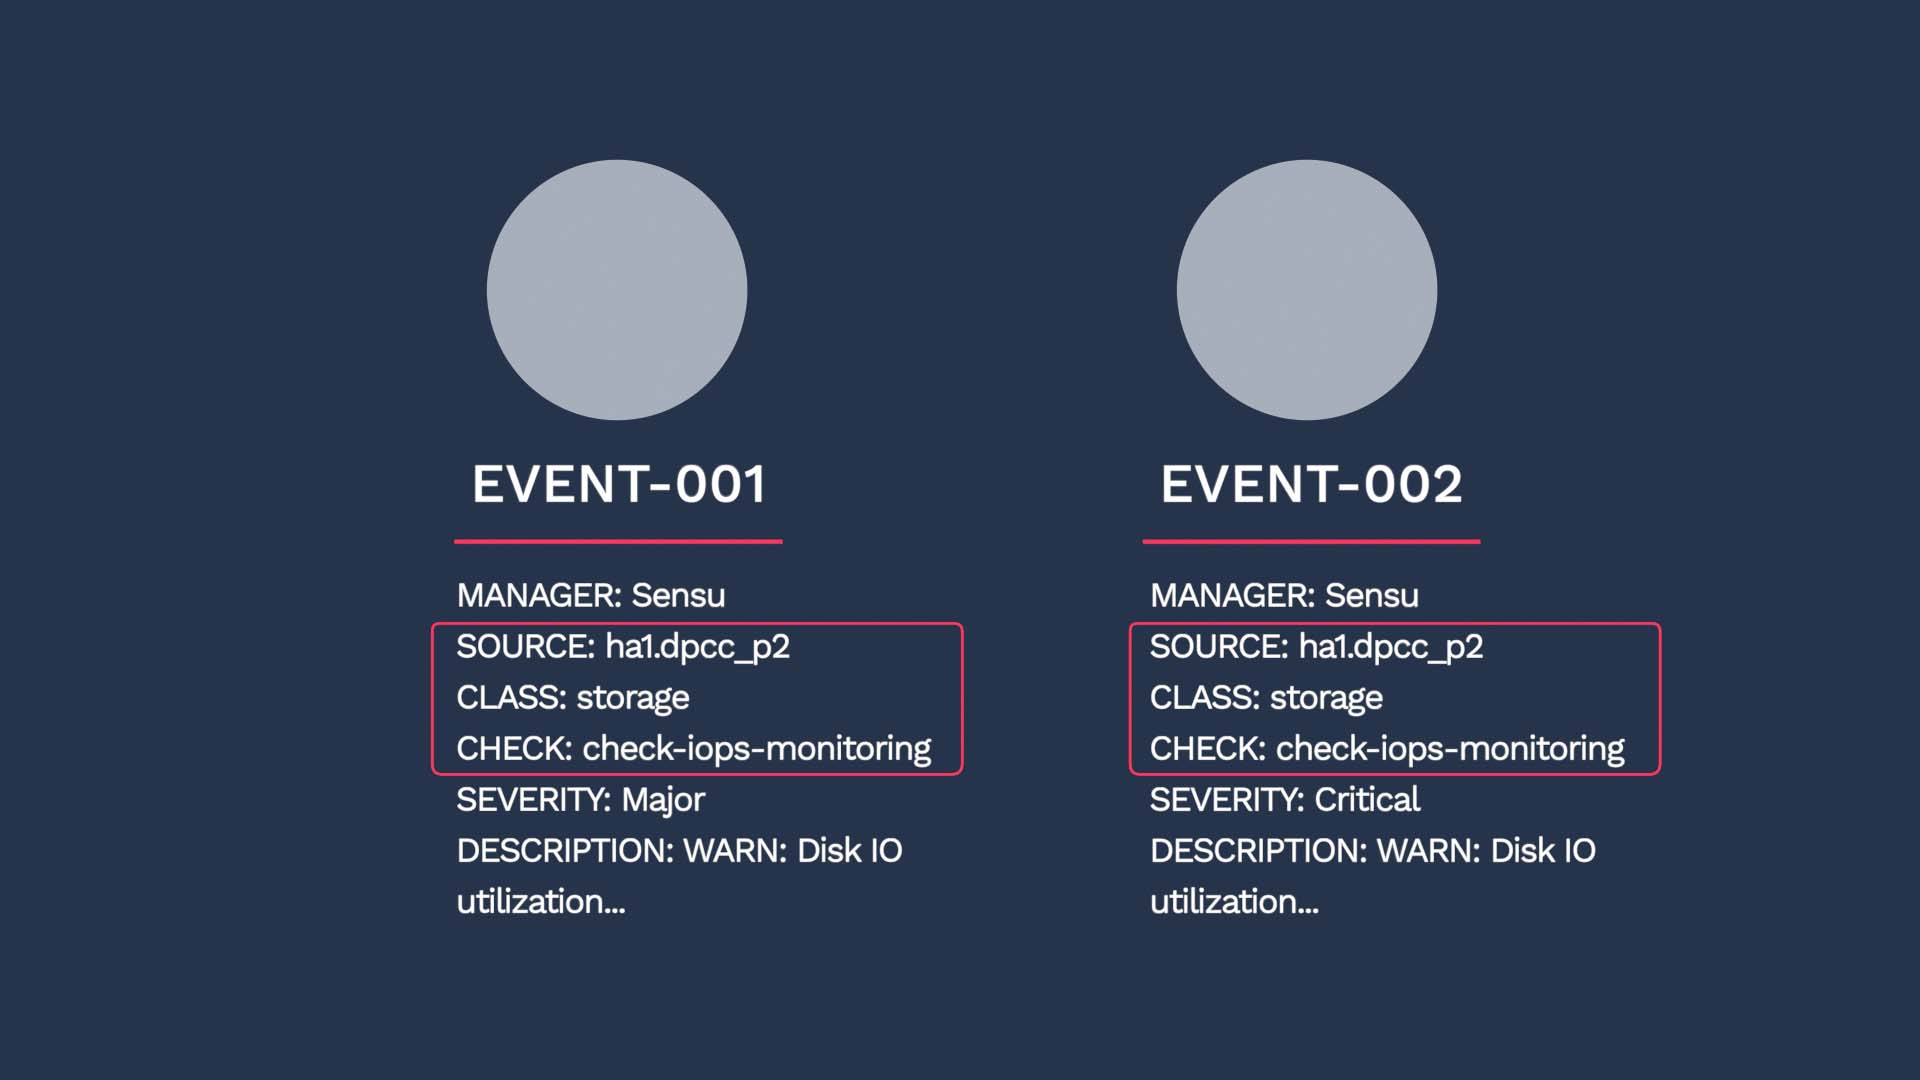
Incident Management deduplicates events and forms alerts. For example, this event indicates disk i/o is very high for this.dpcc_p2 server. Then, here comes another event to tell you the condition has worsened.
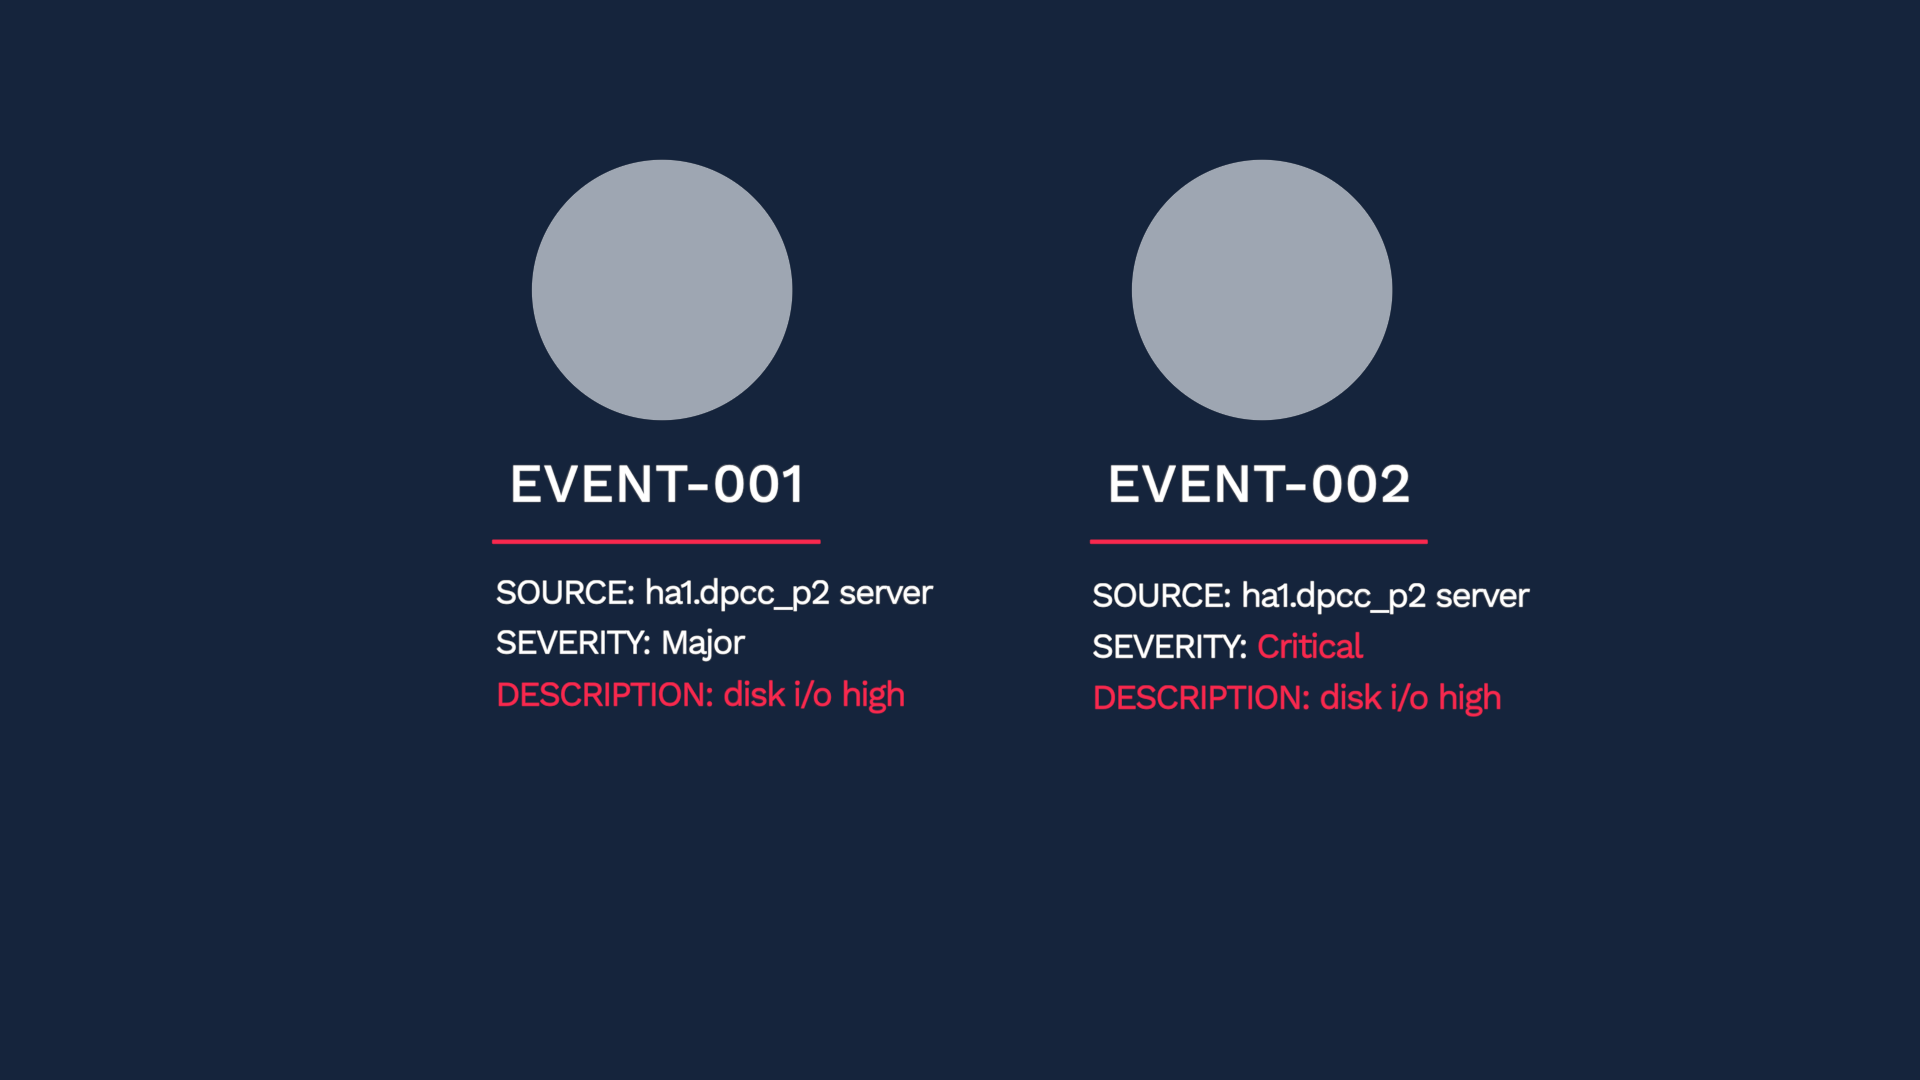
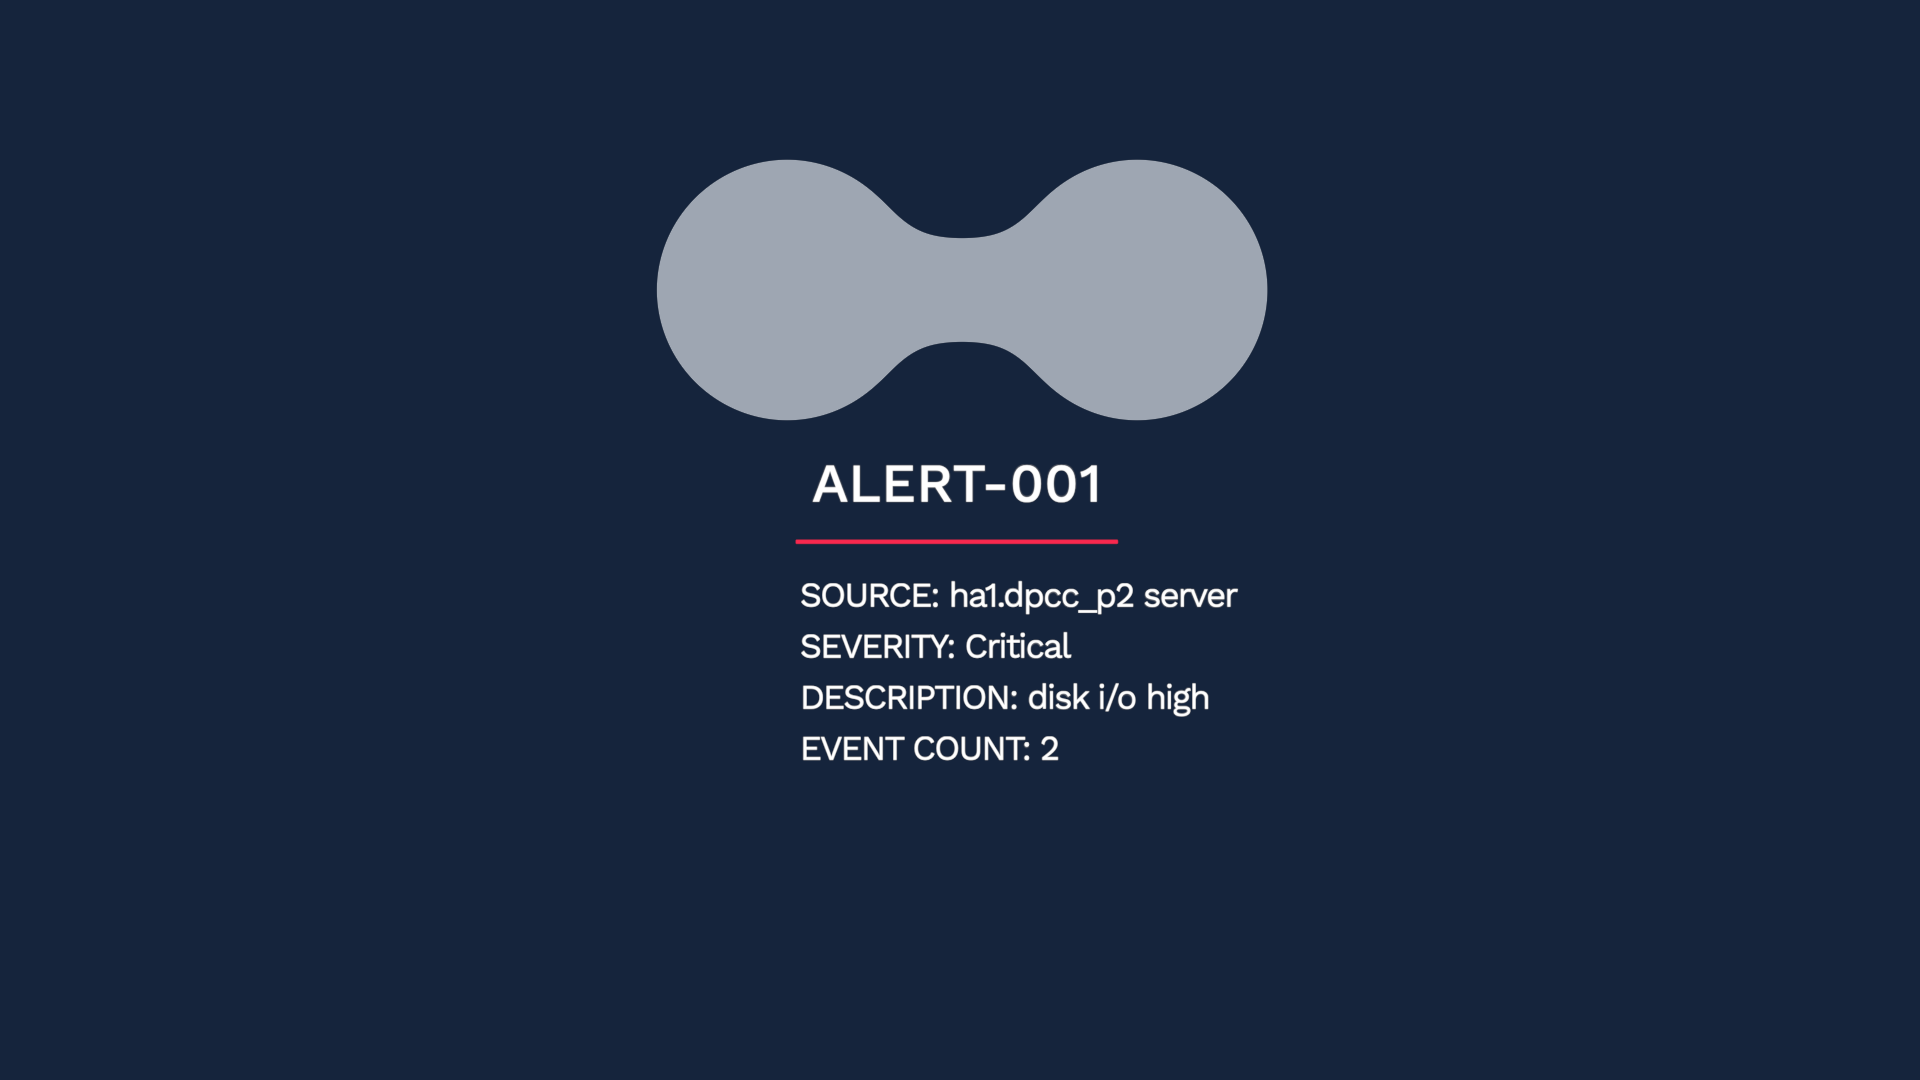
These should not be considered separate problems, so Incident Management de-duplicates them into one alert.
Let’s take a closer look. How exactly do we determine an event to be a duplicate?
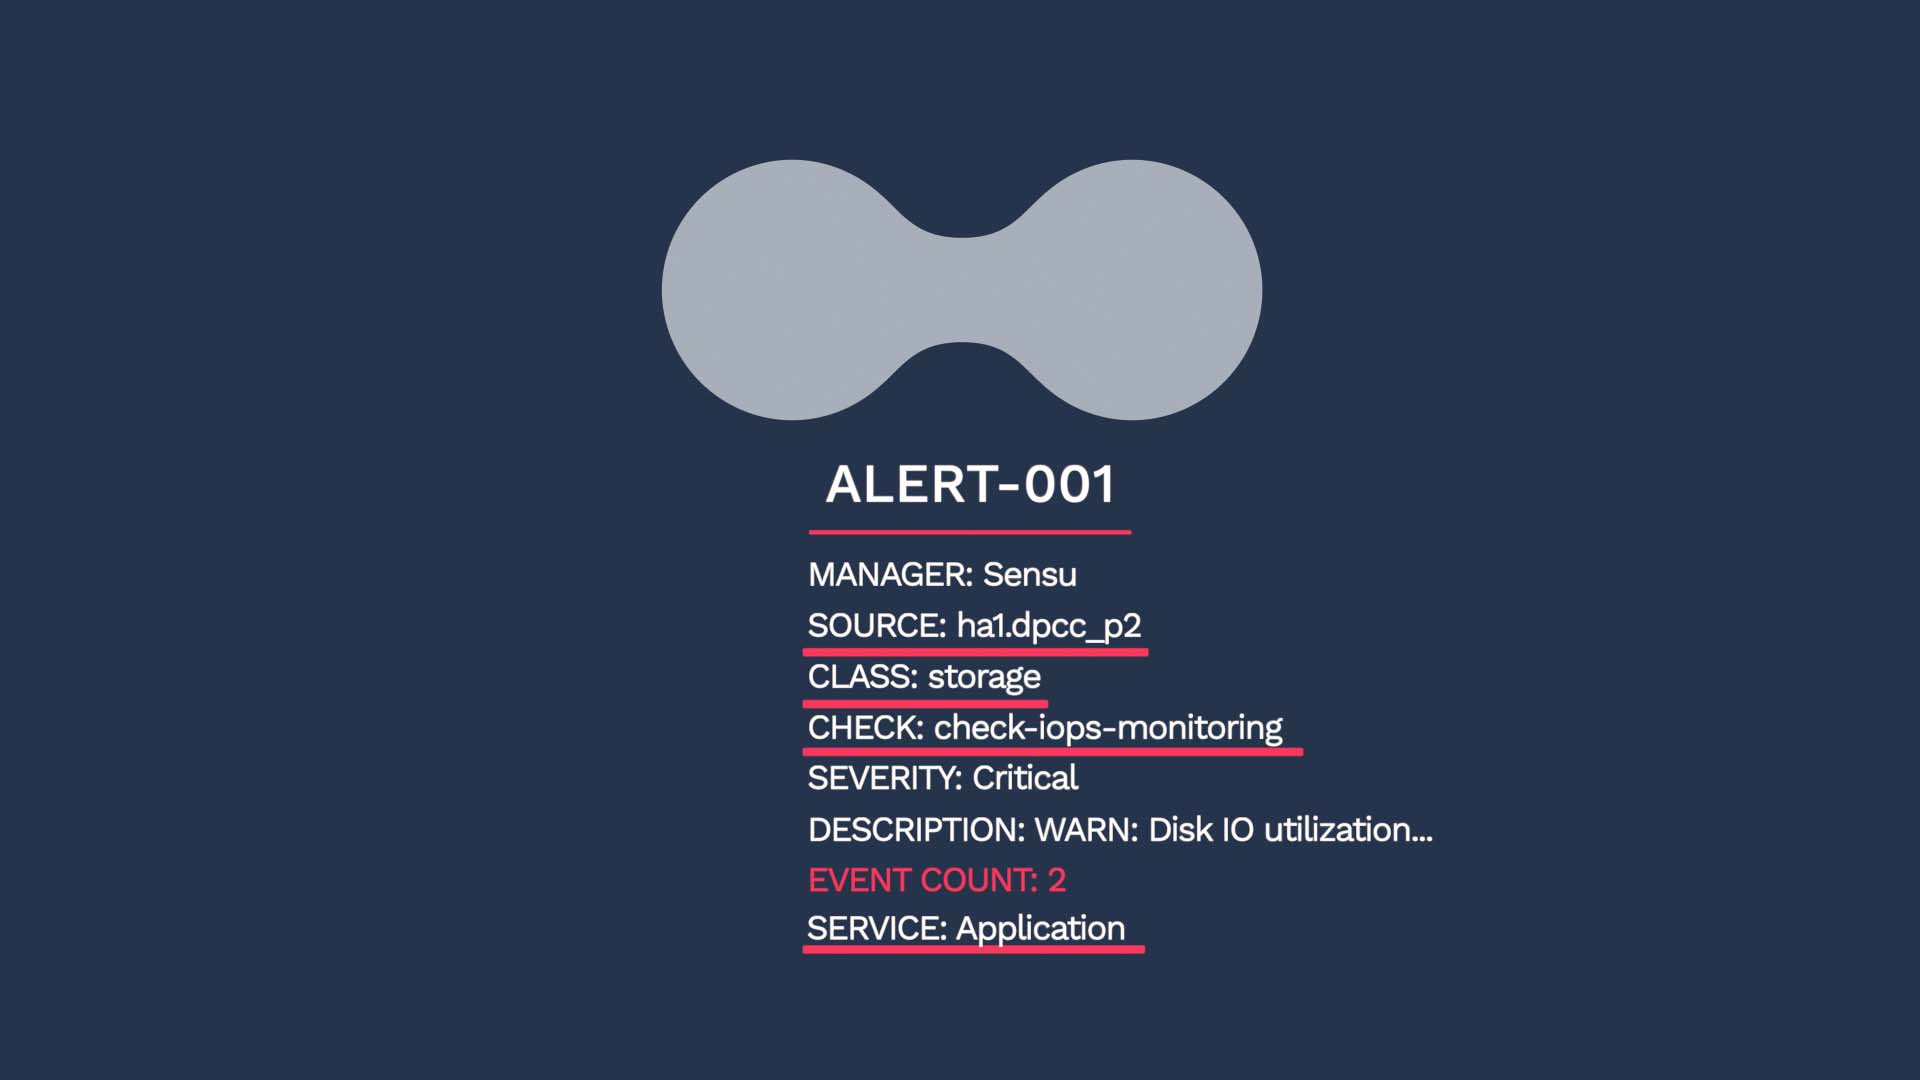
In short, Incident Management compares the dedupe_key values of the two events, and if they are a 100% match, the two events are deduplicated into one alert. The dedupe_key value is a combination of the Source, Class, and Check fields in an event. If the incoming event is using the service field, that value is used also.
In this example, instead of two events, you now have one alert in the critical state. Because of the deduplication, you will not be allocating separate resources to each event, and you will have more context for troubleshooting.
Now consider this case: After the critical event, another event arrives with the same dedupe key value. But this time, the severity value of the event is Clear. Maybe an automated runbook kicked in and addressed the issue.
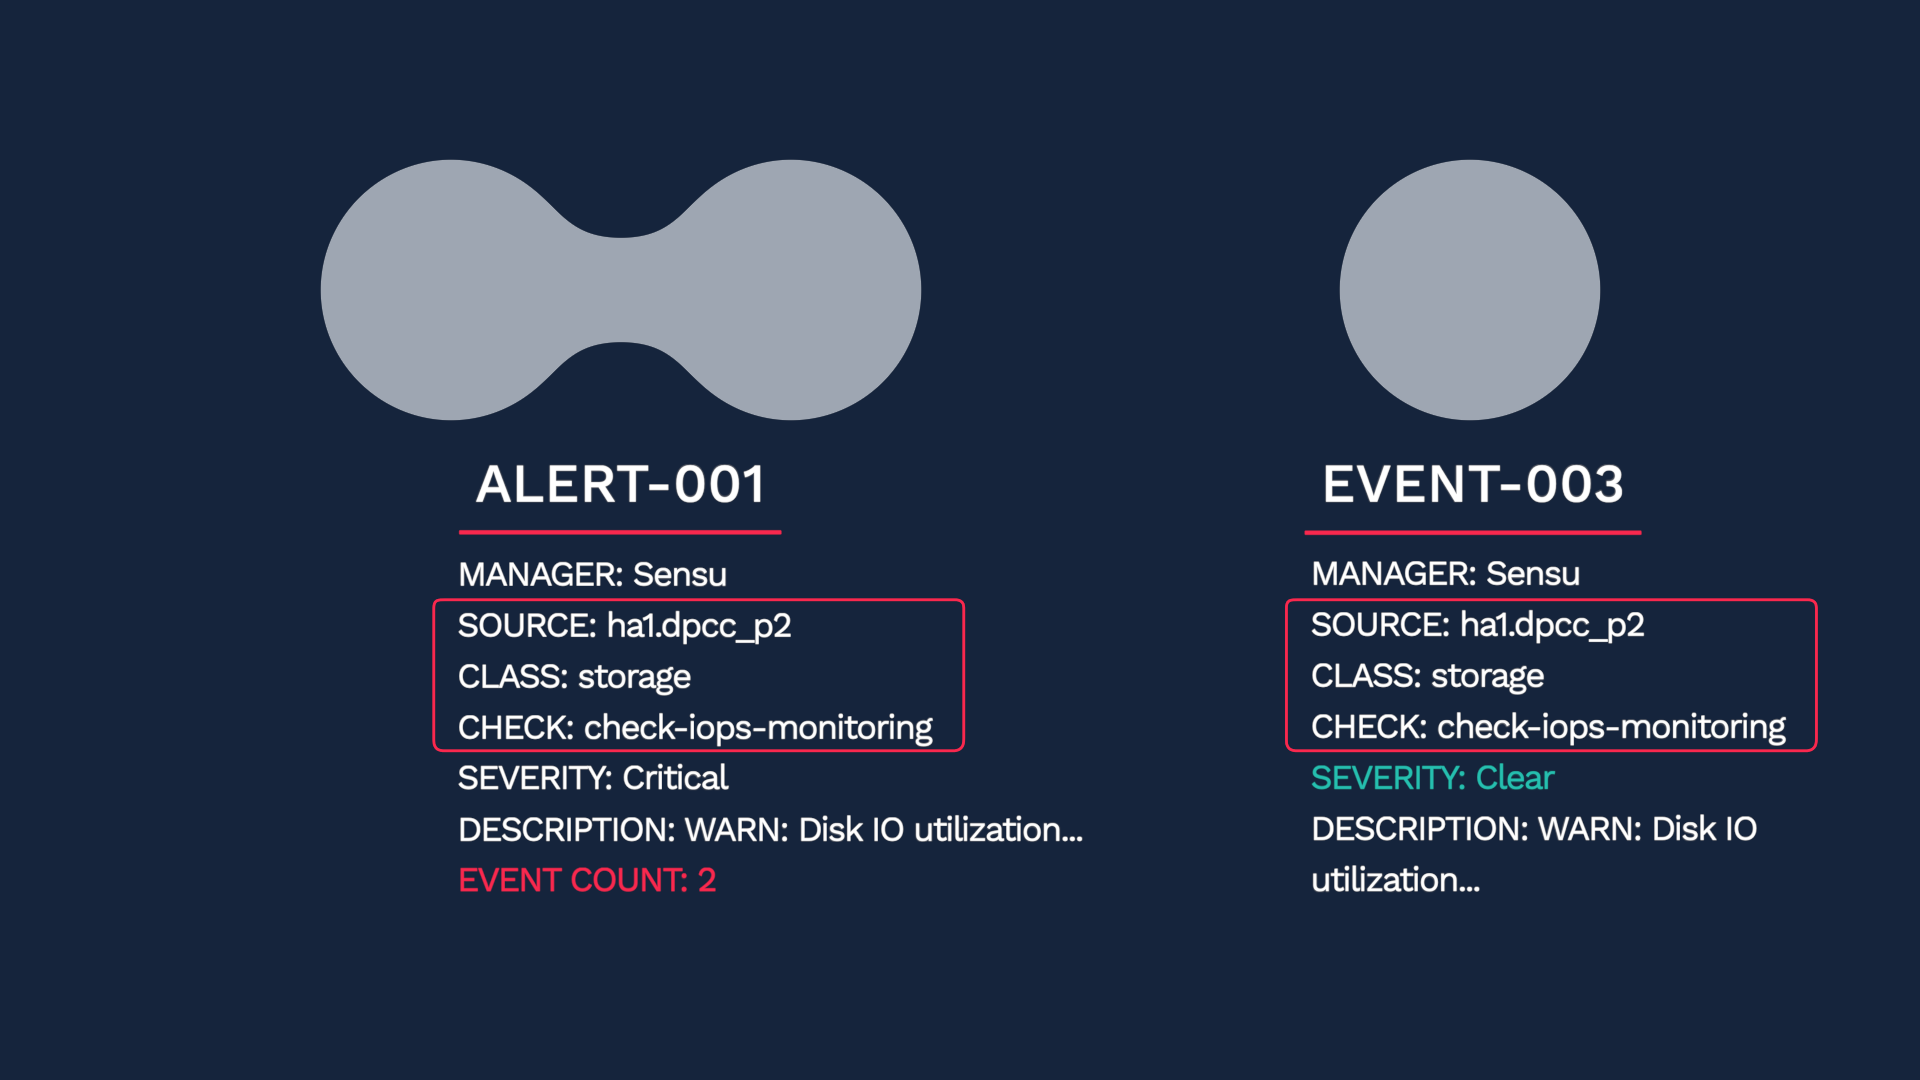
Incident Management dedupes this event into an existing alert. The status of the alert updates to Clear.
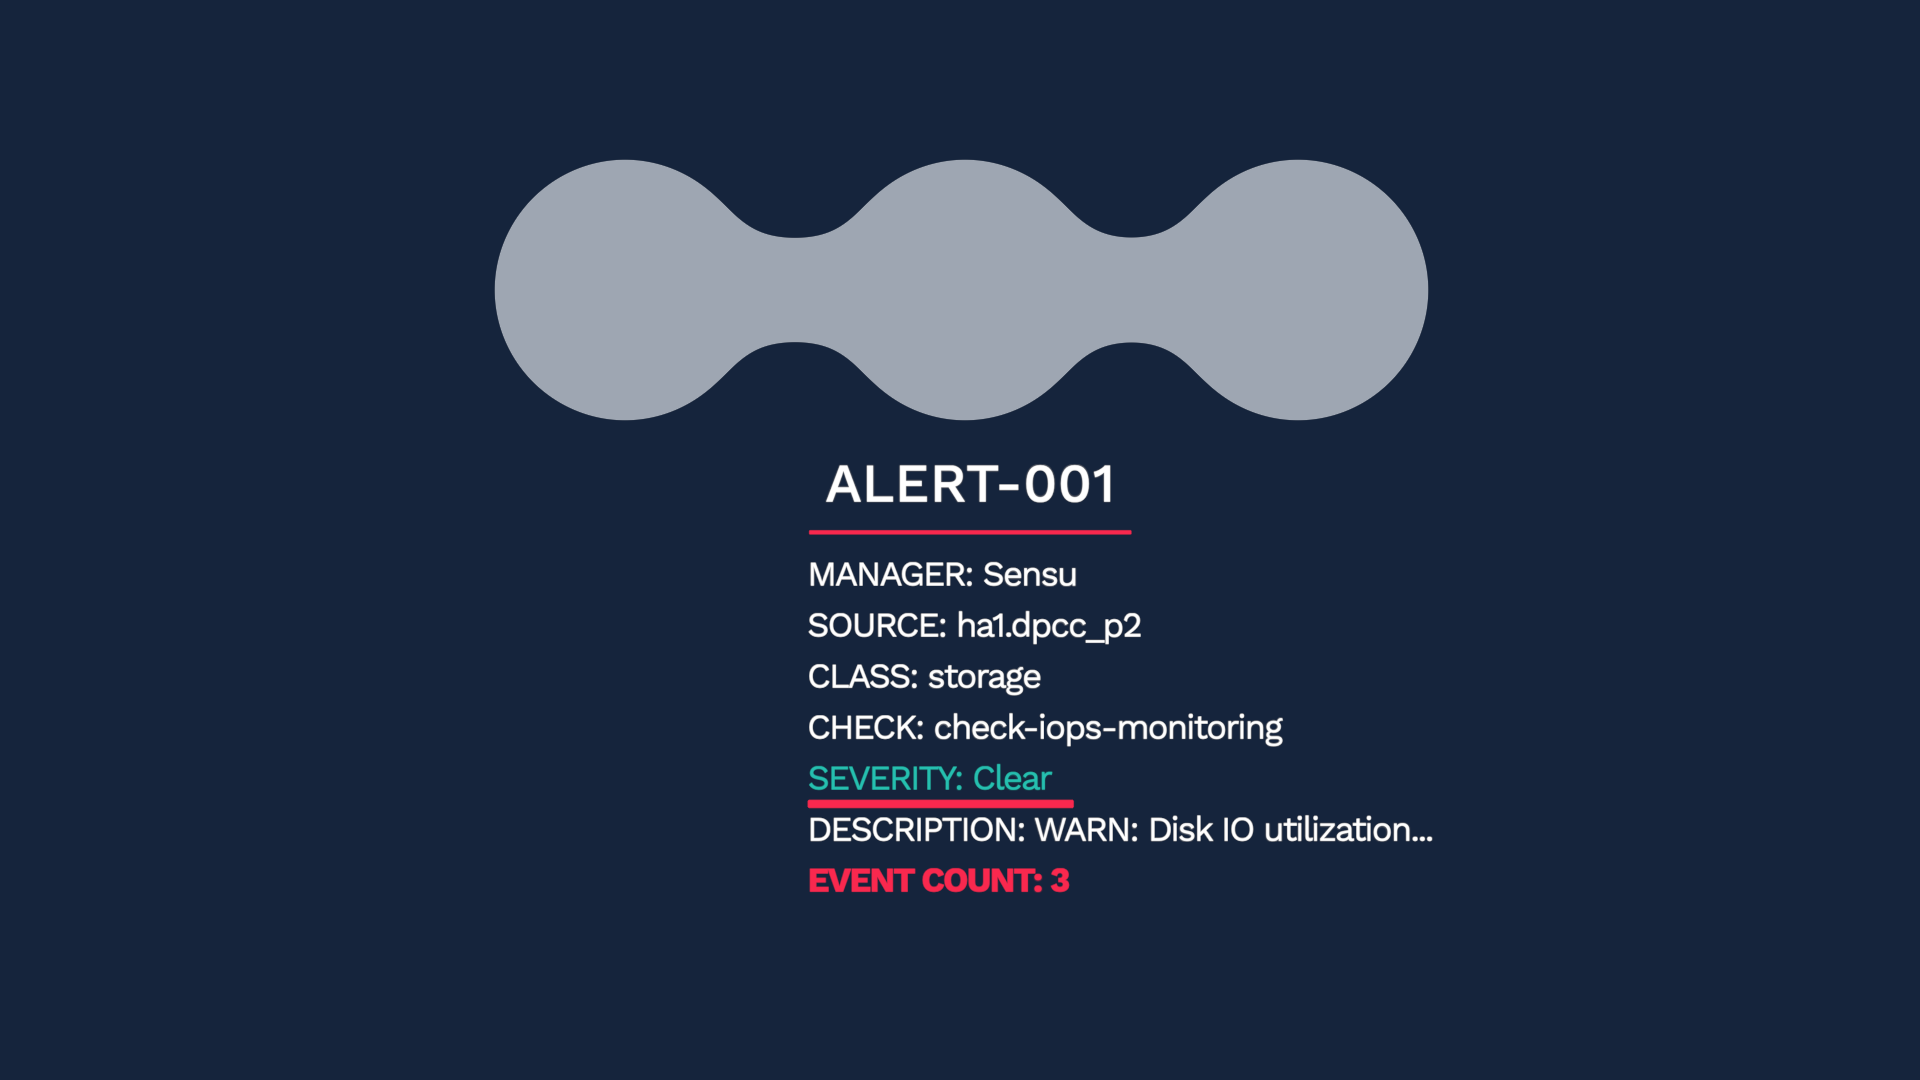
Without deduplication, it would take a manual correlation to figure out the issue has resolved itself. Have you had a series of link flapping events? All those up and down events would be consolidated into one alert with Incident Management.
So, after the 1700 events have been processed, here’s what we got. They are deduplicated into 29 alerts.
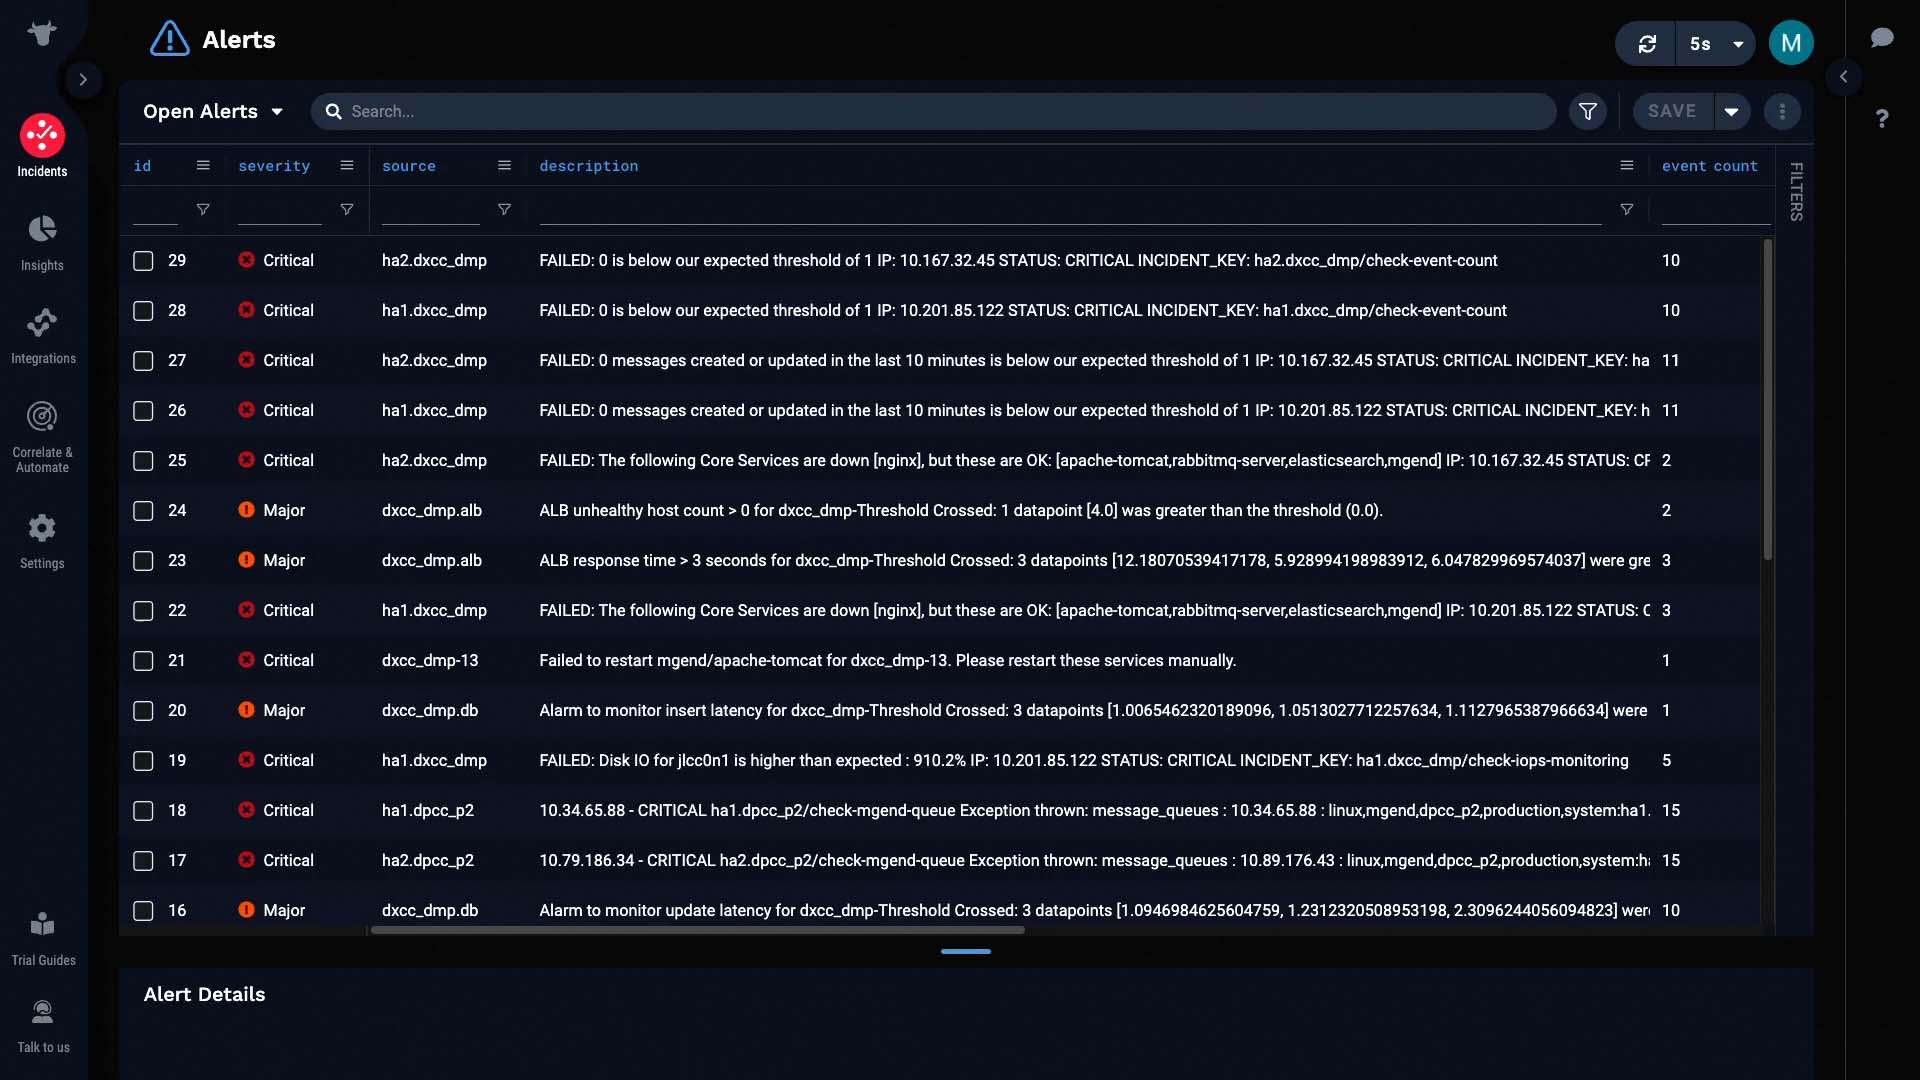
This is the power of noise reduction. It helps you direct your focus on what actually matters.
But we don’t stop here. These 29 alerts are processed further before you come in. They are now correlated based on their relatedness.
Here, the 29 alerts are now clustered into 3 incidents.
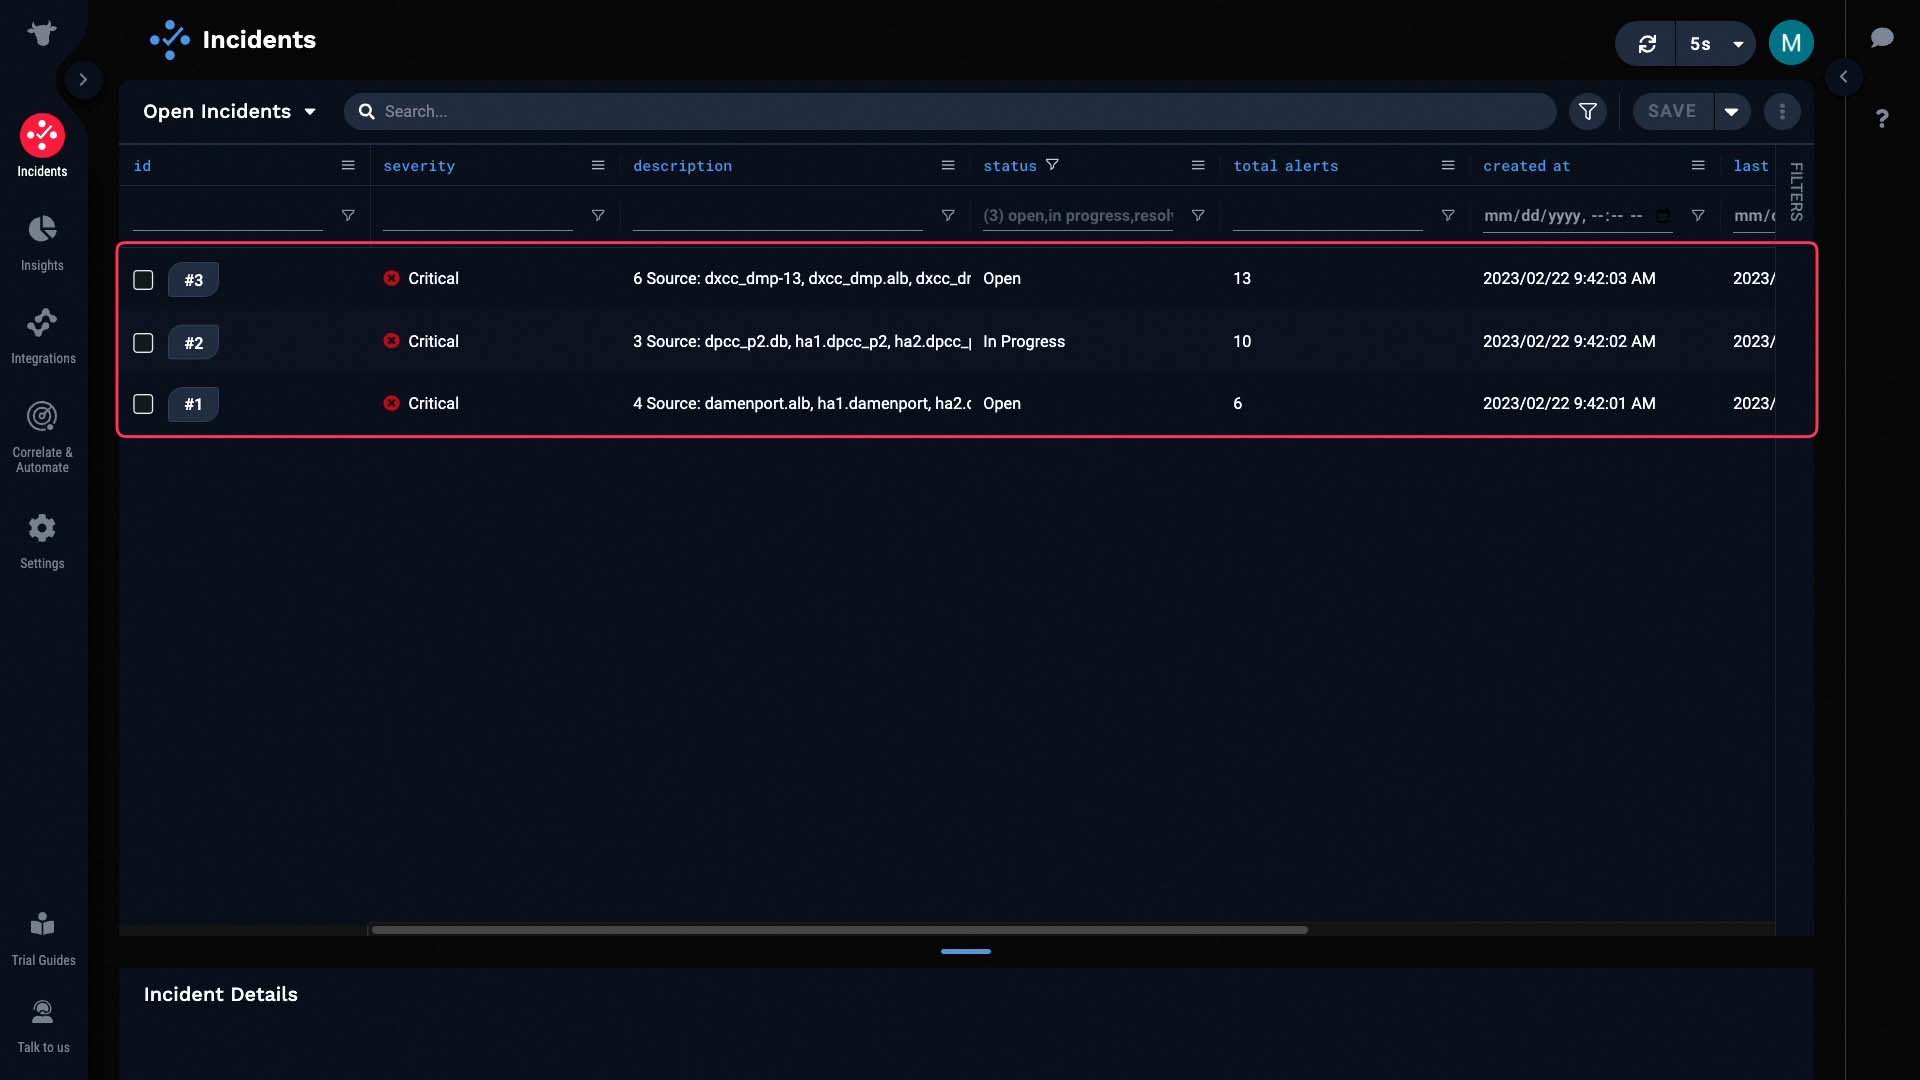
Incident Management evaluates alerts for their relatedness, and clusters the related alerts into one incident.To learn more about the correlation mechanism, watch the “Correlation Engine in APEX AIOps Incident Management” video.
Imagine instead of getting paged 29 times for each of the alerts, now you get 3. No more pager fatigue for your team!
Let’s examine one of the incidents and verify Incident Management has made a meaningful correlation. Let’s see if we can figure out what’s going on with this incident. Let’s go into the Situation Room. The Situation Room is where you can collaborate with your team on an incident.
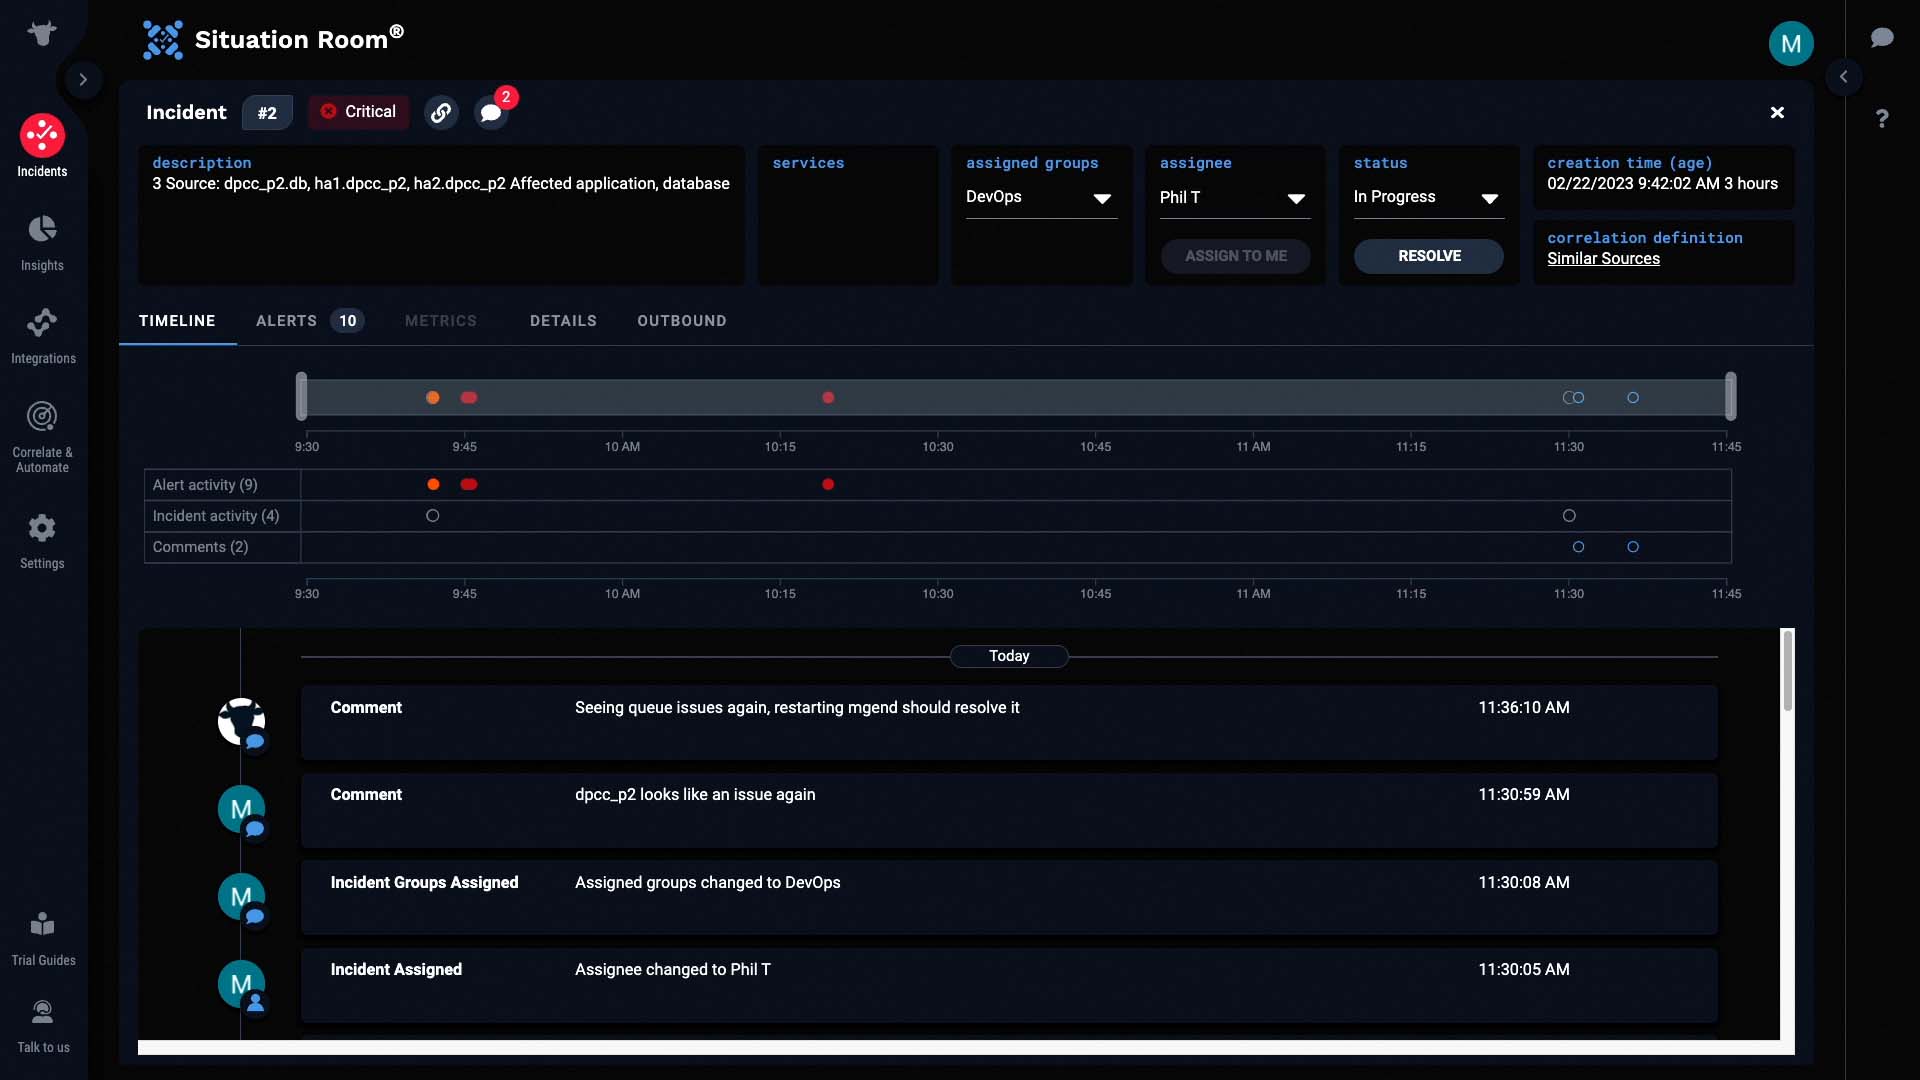
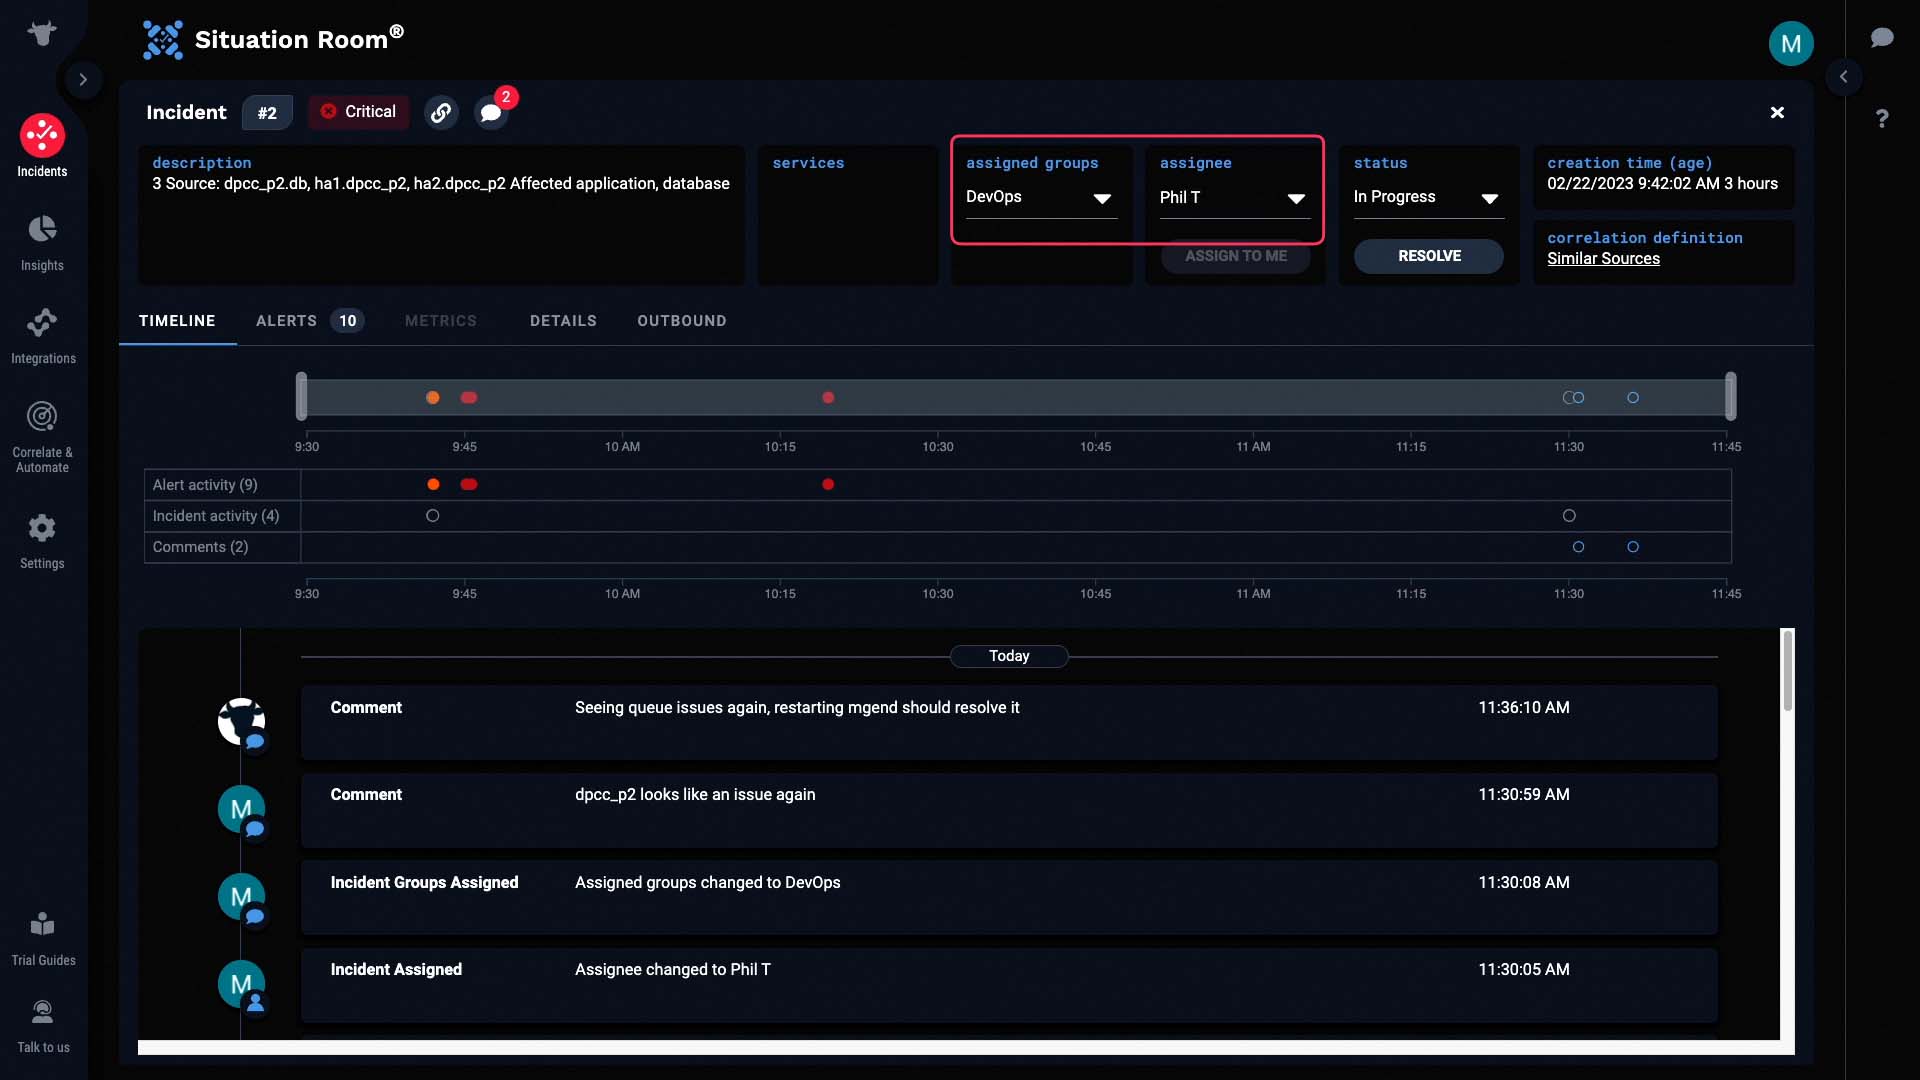
Looks like a team is already assigned to this one.
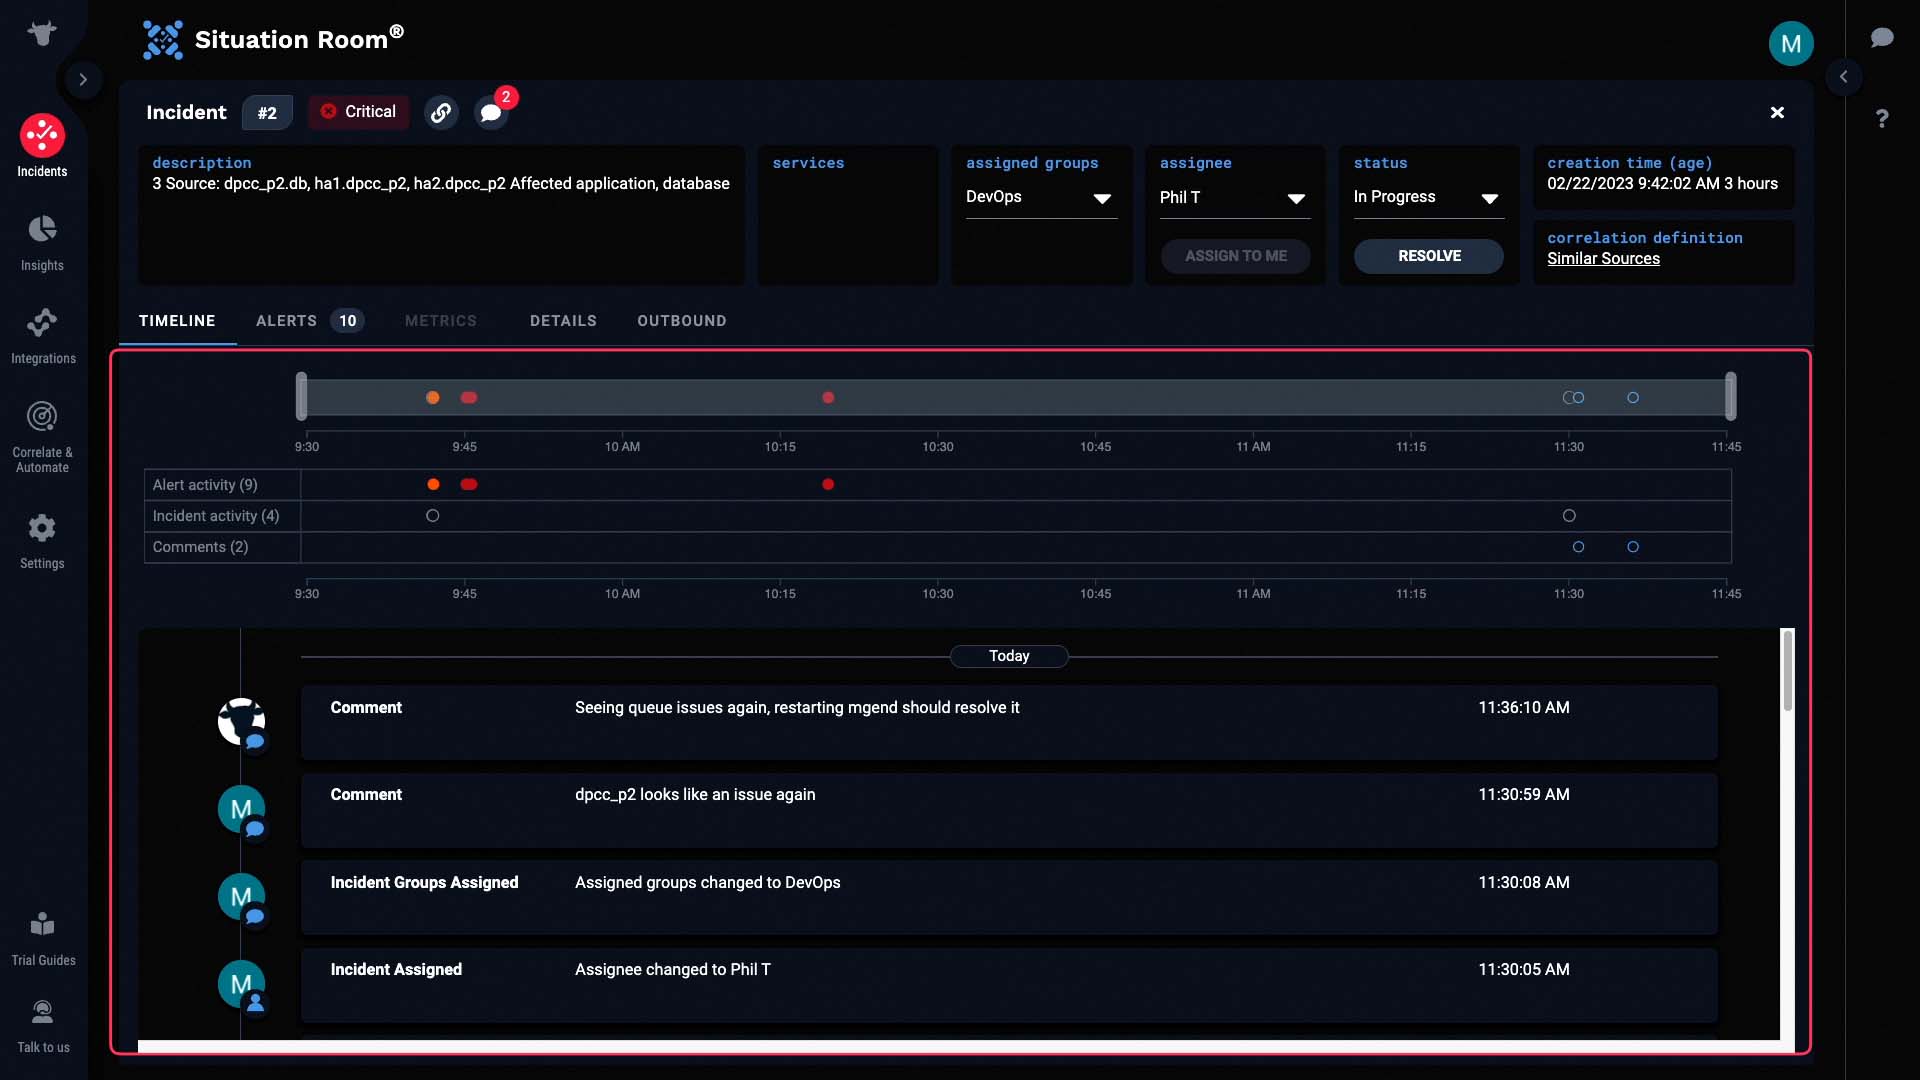
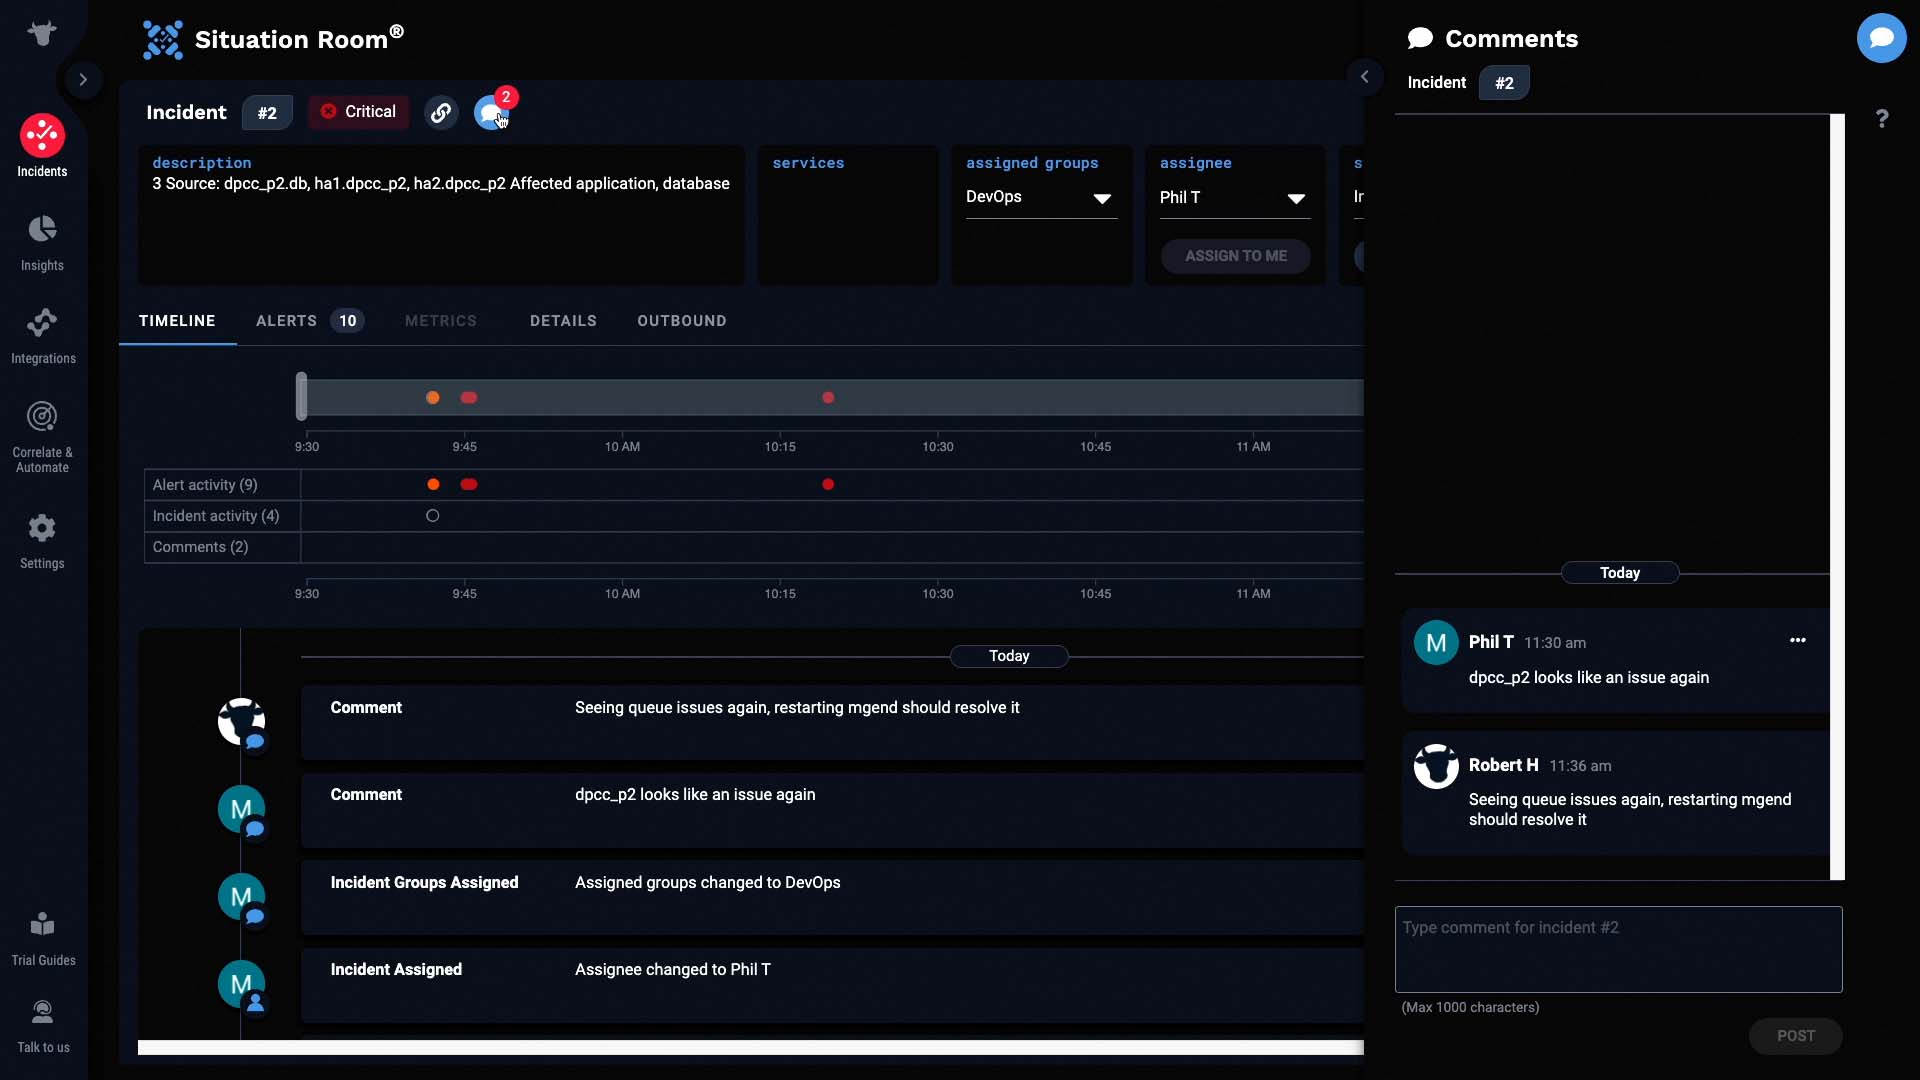
Here, we can see the timeline of activities pertaining to this incident.
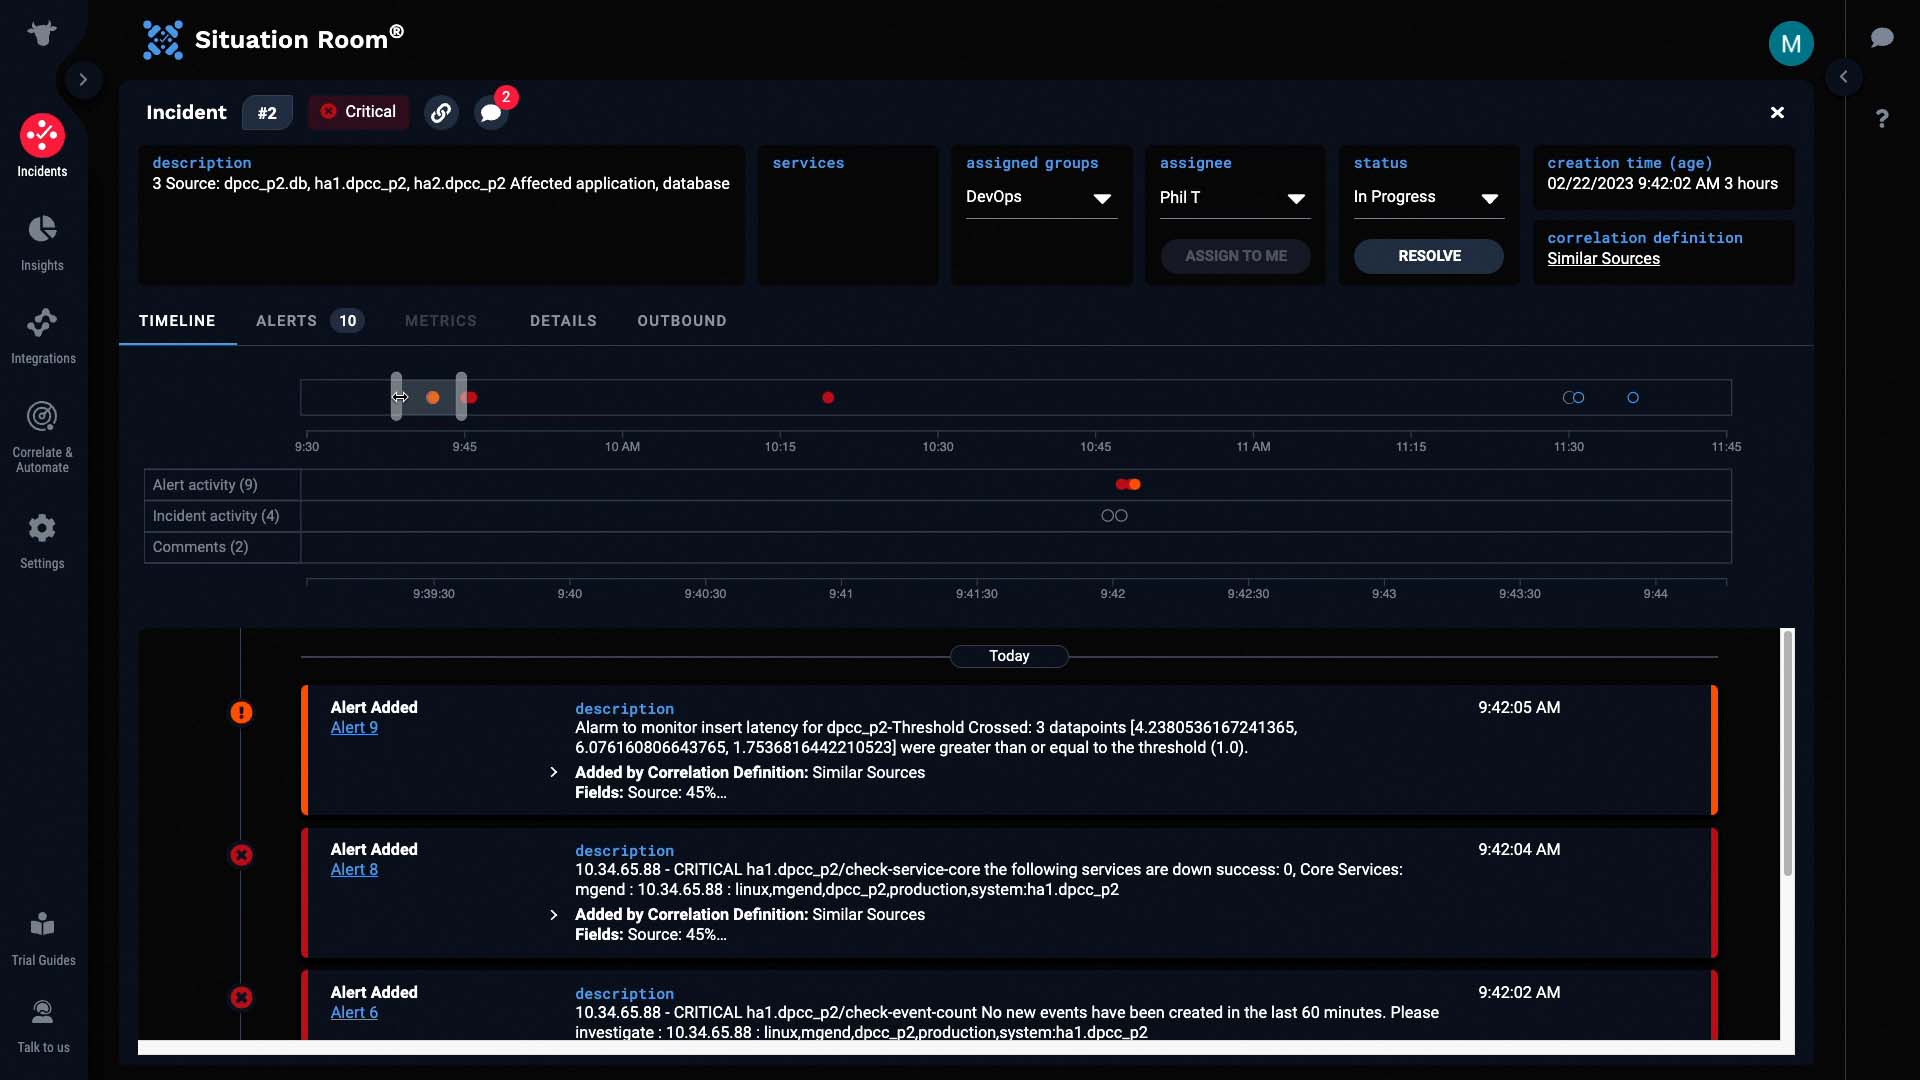
We can zoom in to any particular area of interest to filter the activities.
Looks like the group assigned is already reviewing this incident. Let’s do the same!
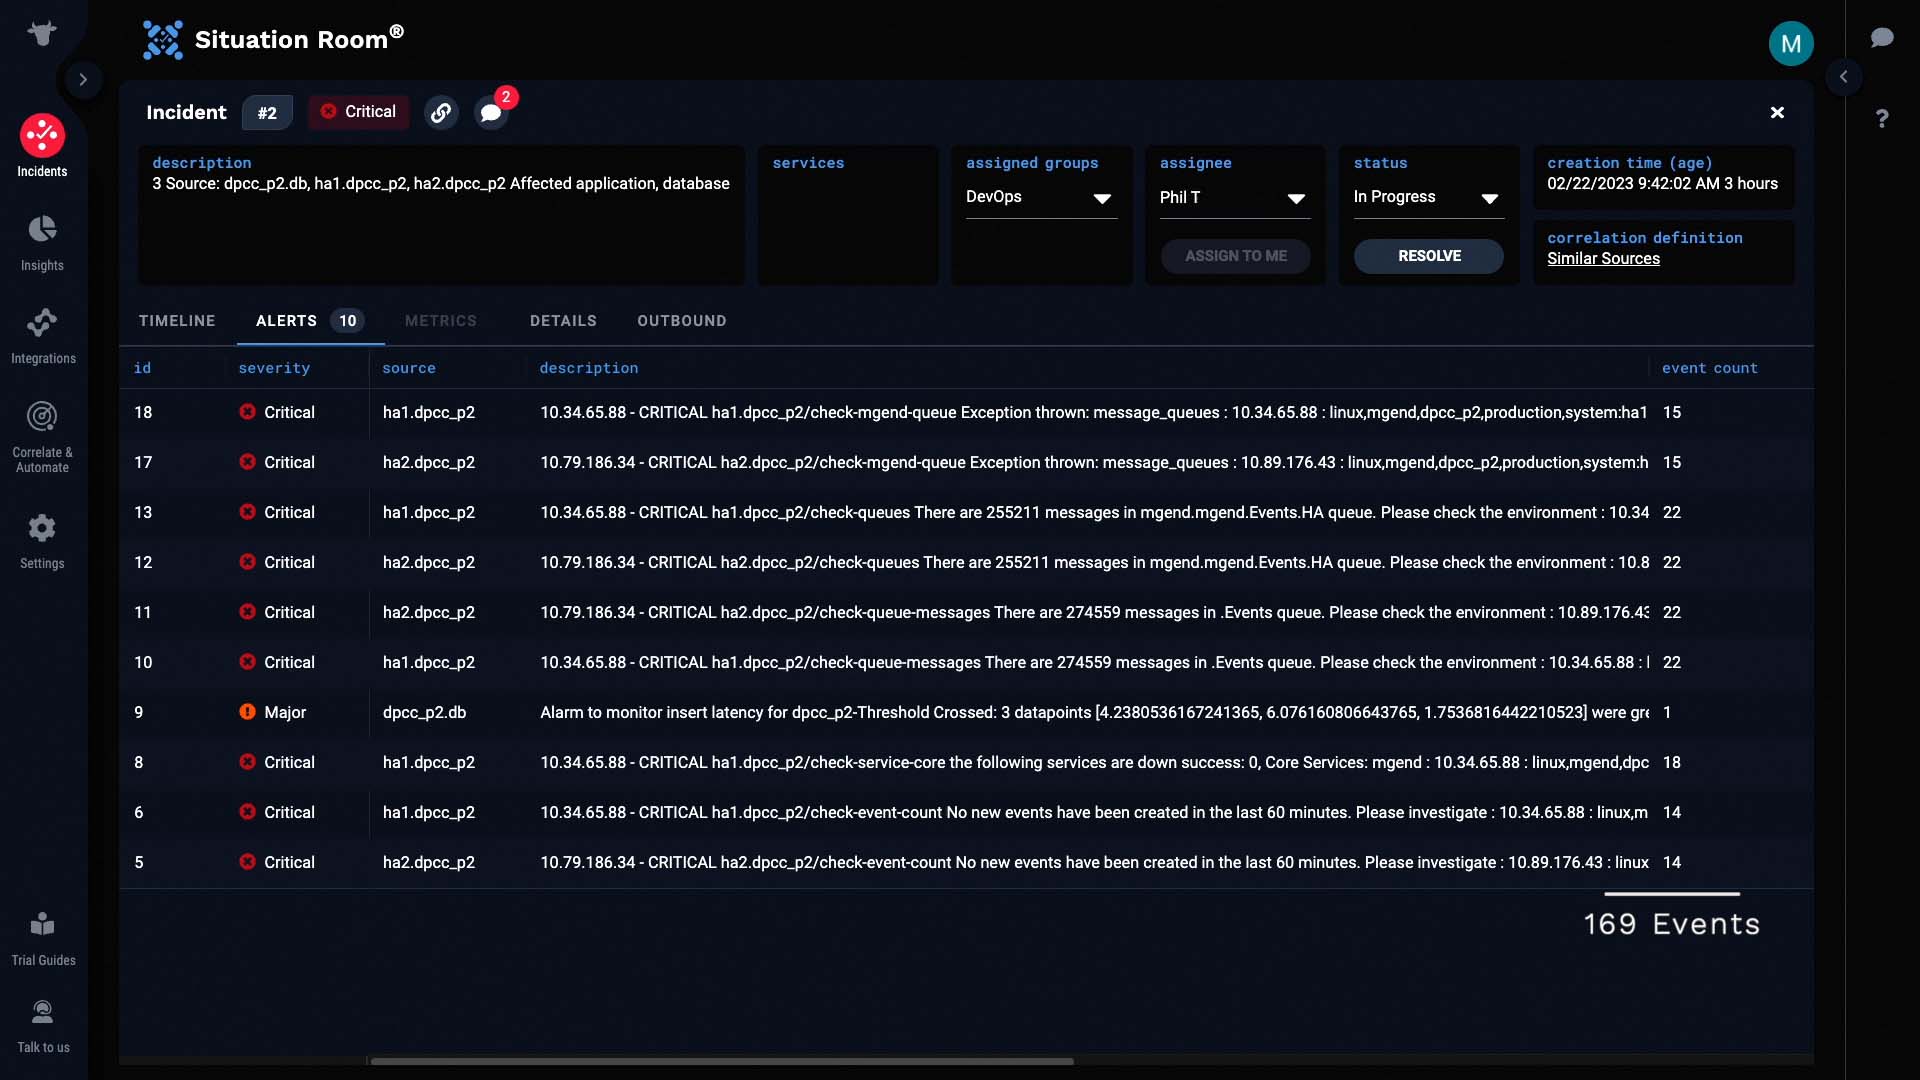
We’ll look at the alerts in the incident. The incident has 10 alerts, which consist of 169 events.
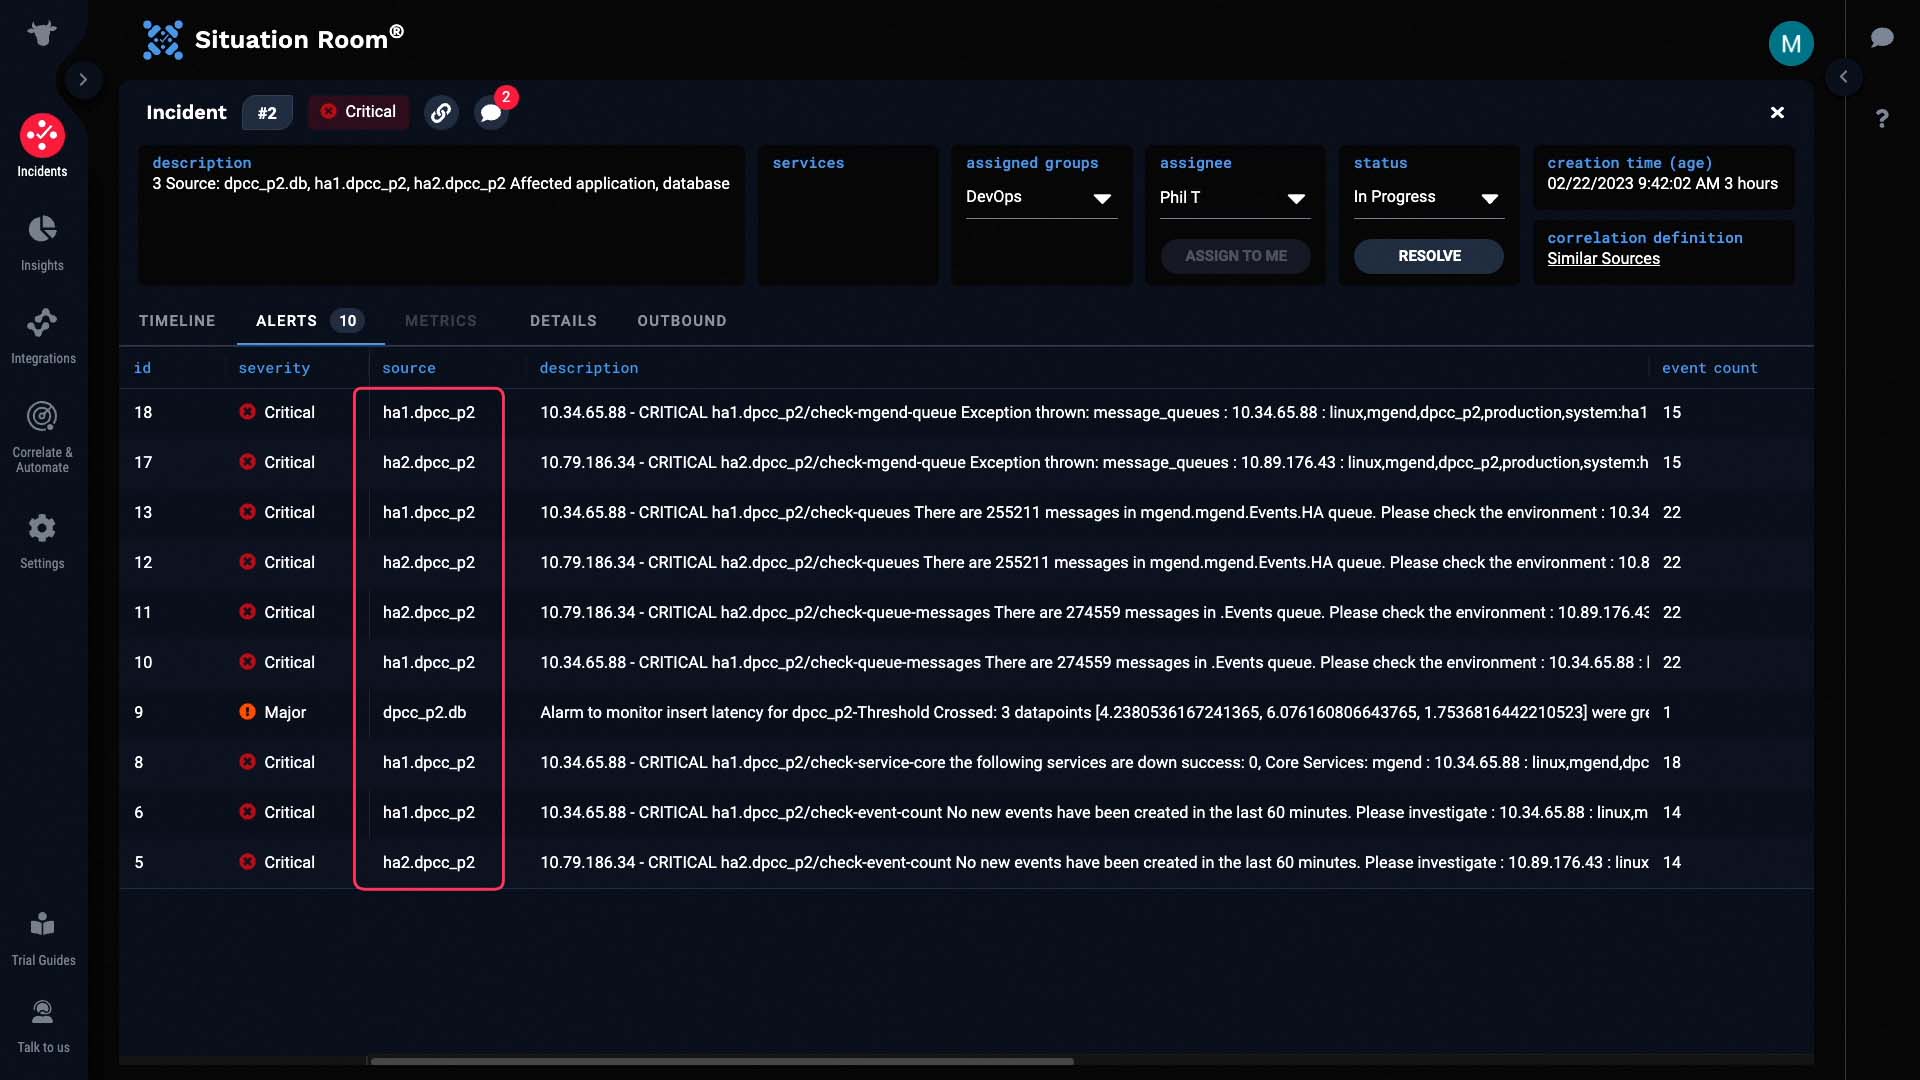
Lets see what else we can learn from the alert details. We can see that the dpcc system is the one involved.
We have a monitoring setting to generate events when there is no activity for a prolonged amount of time. The hosts in this HA pair are not generating data...
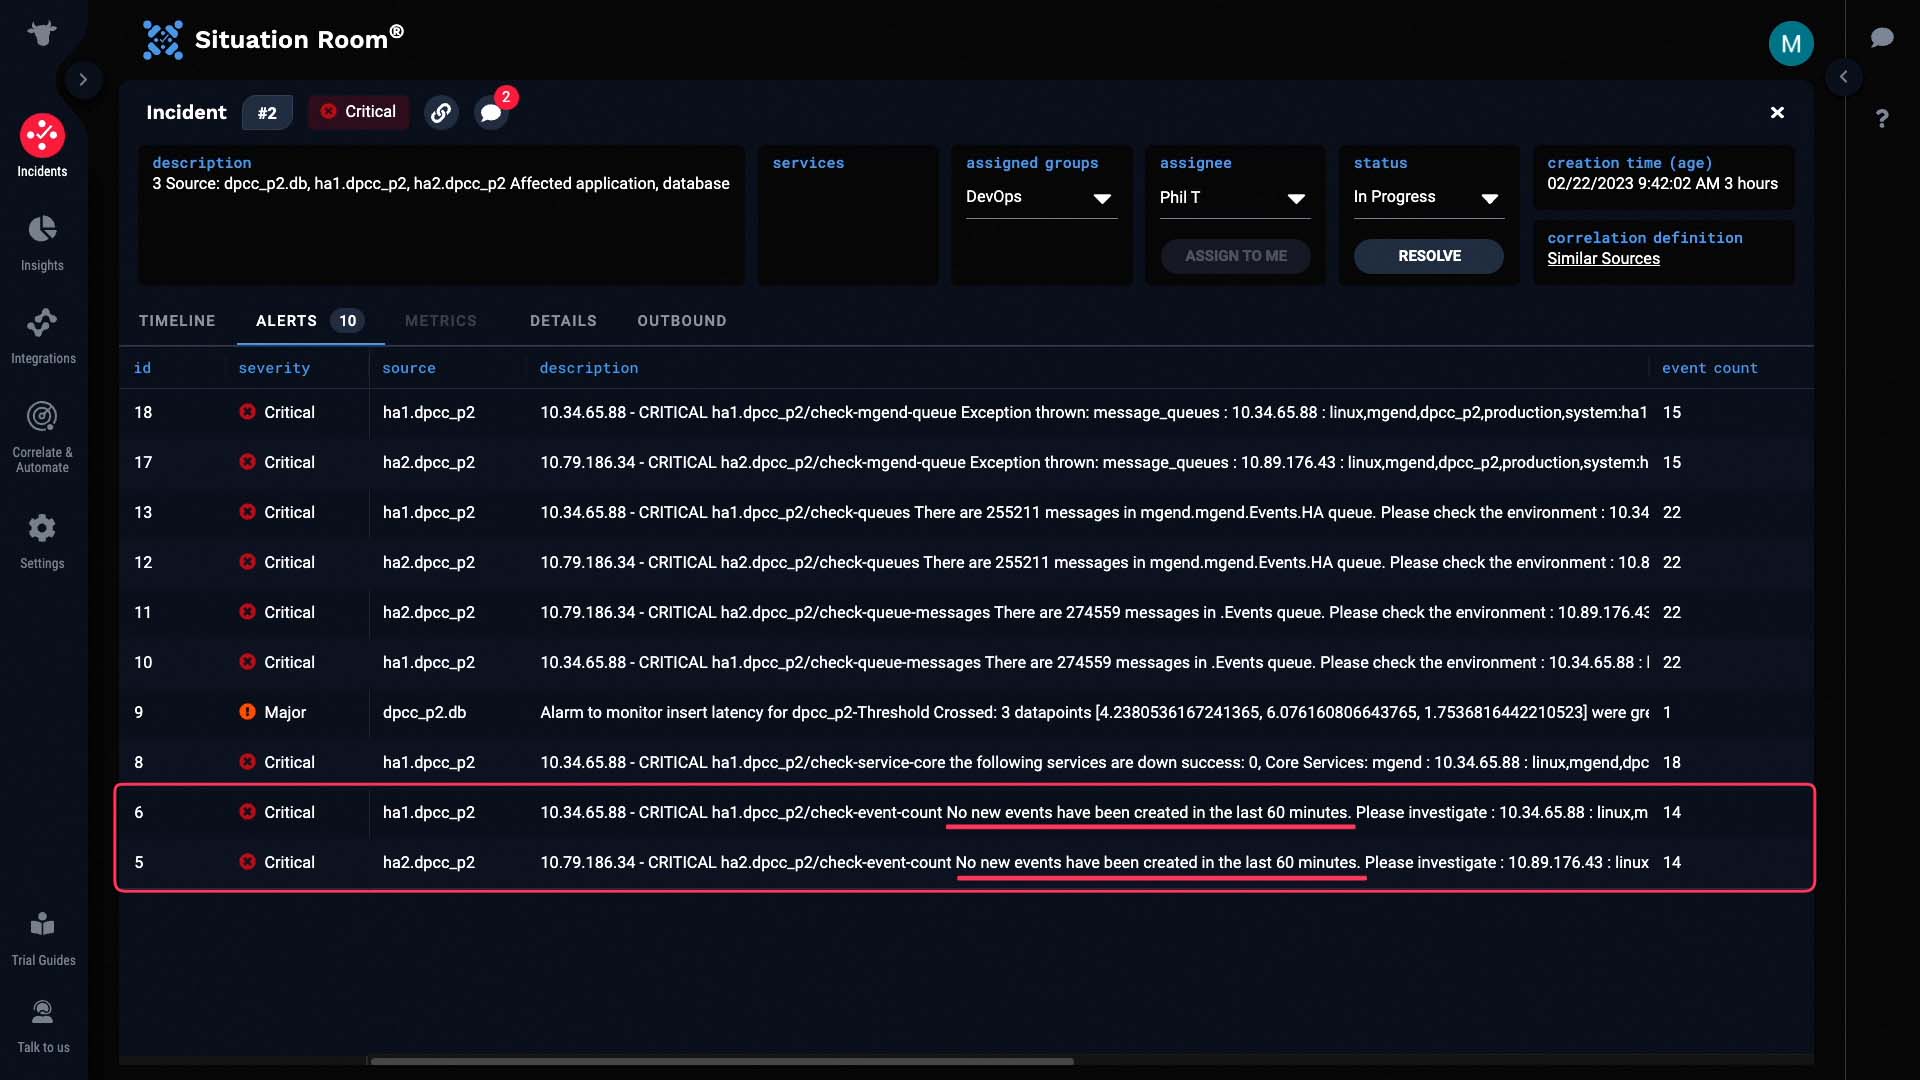
...and it looks like a core service is down.
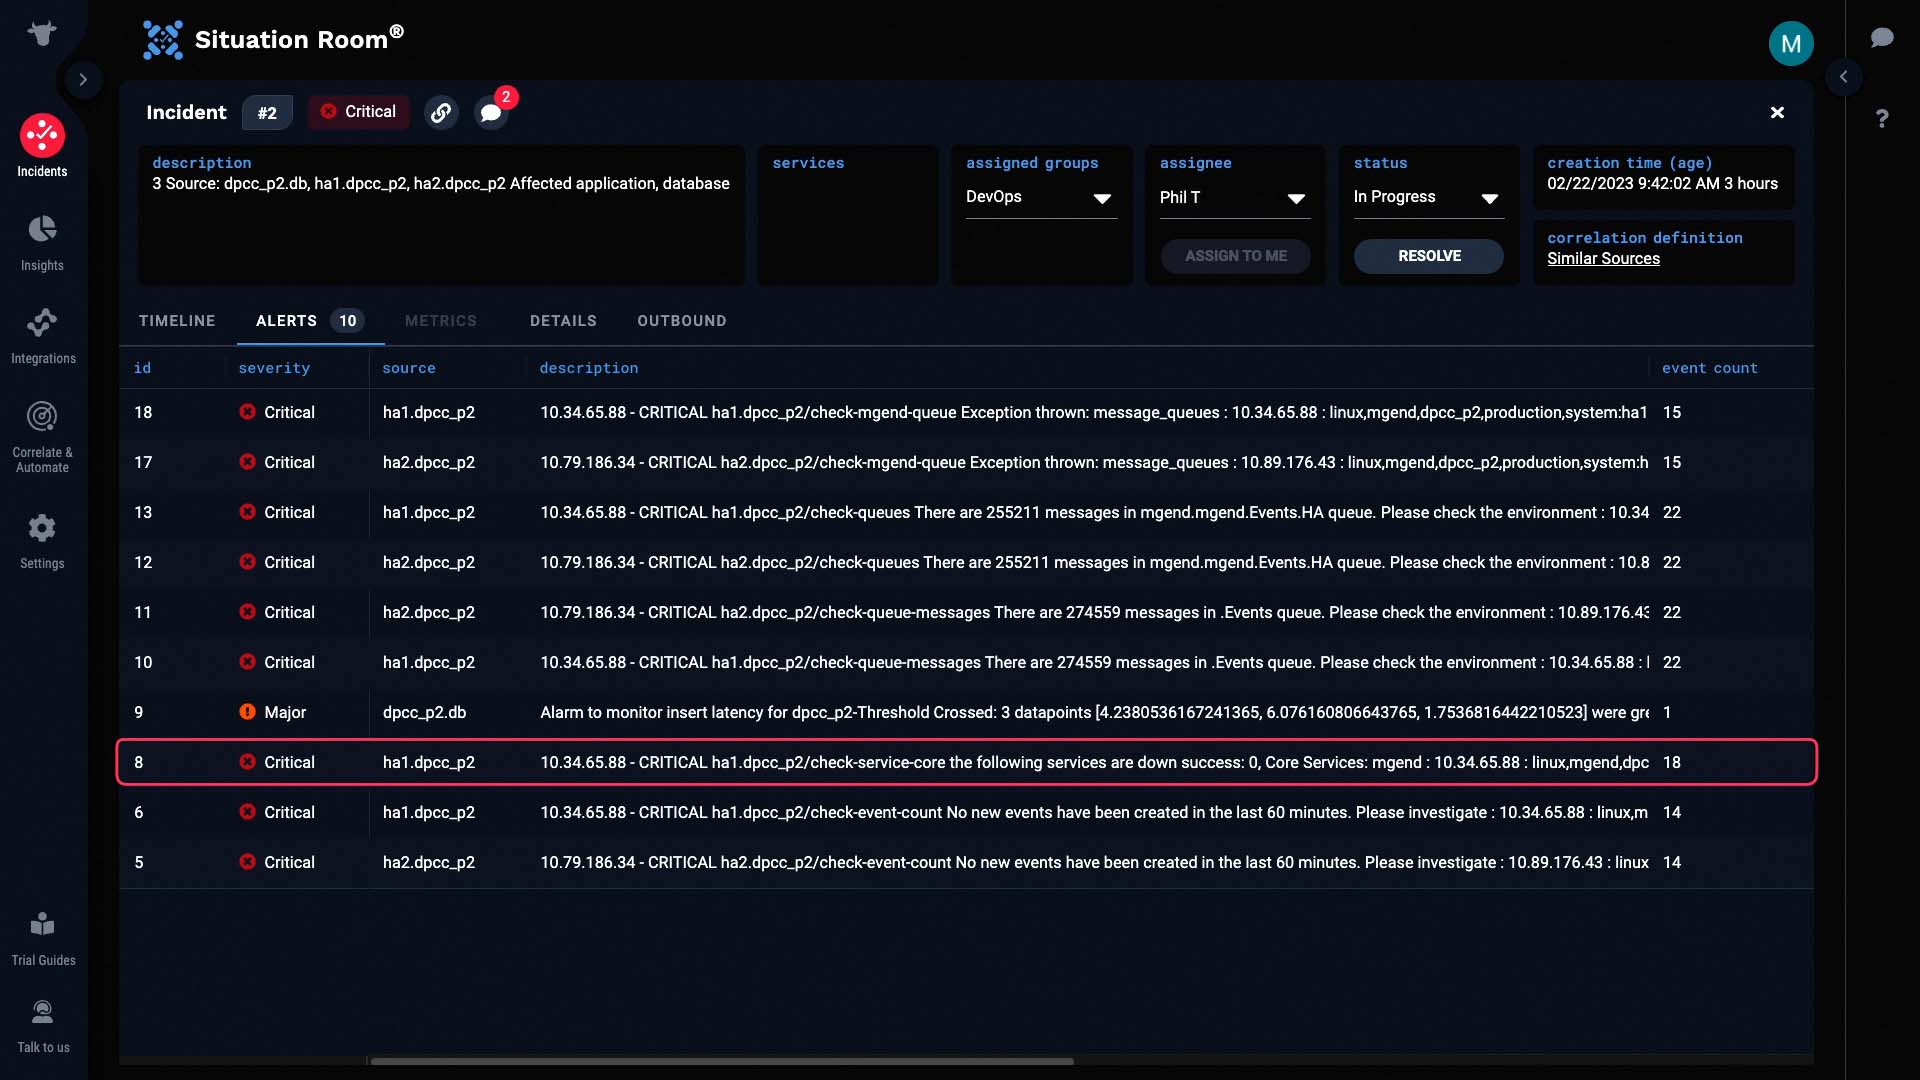
The internal message queues are backed up.
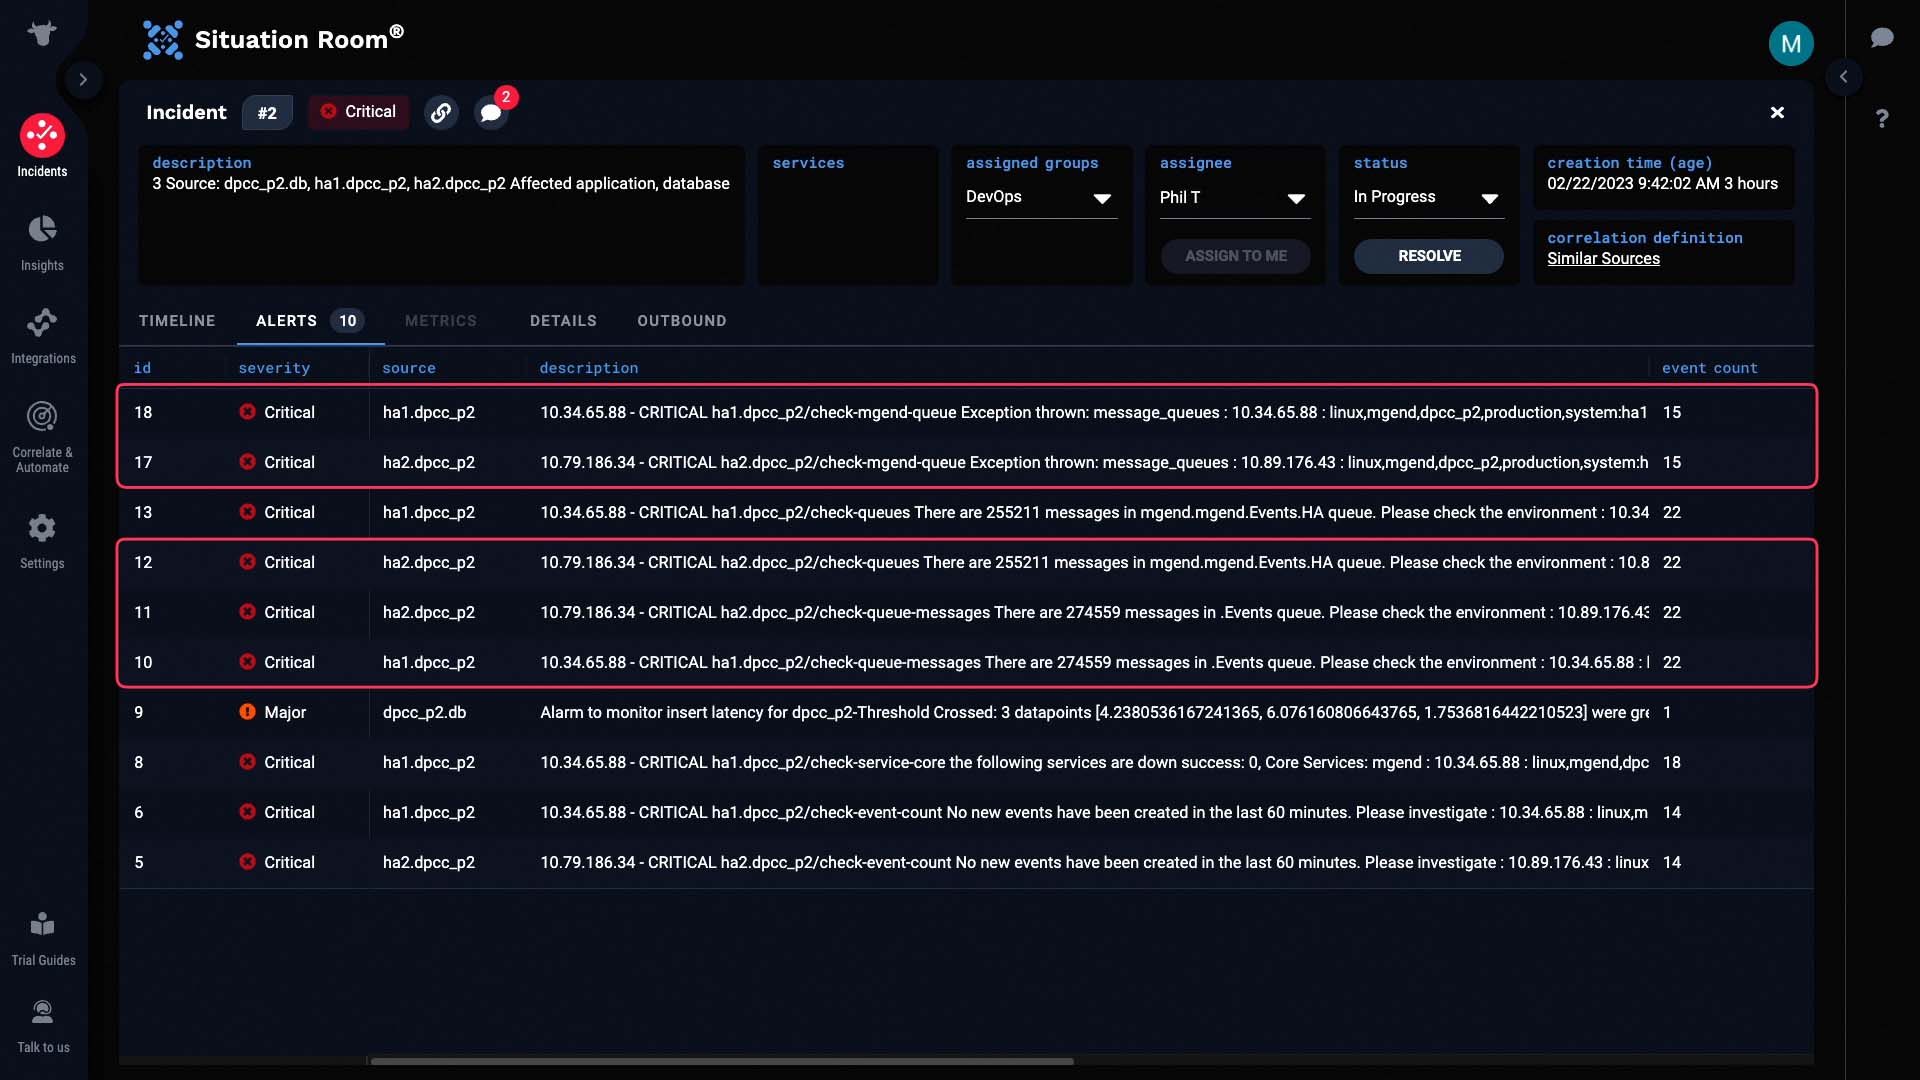
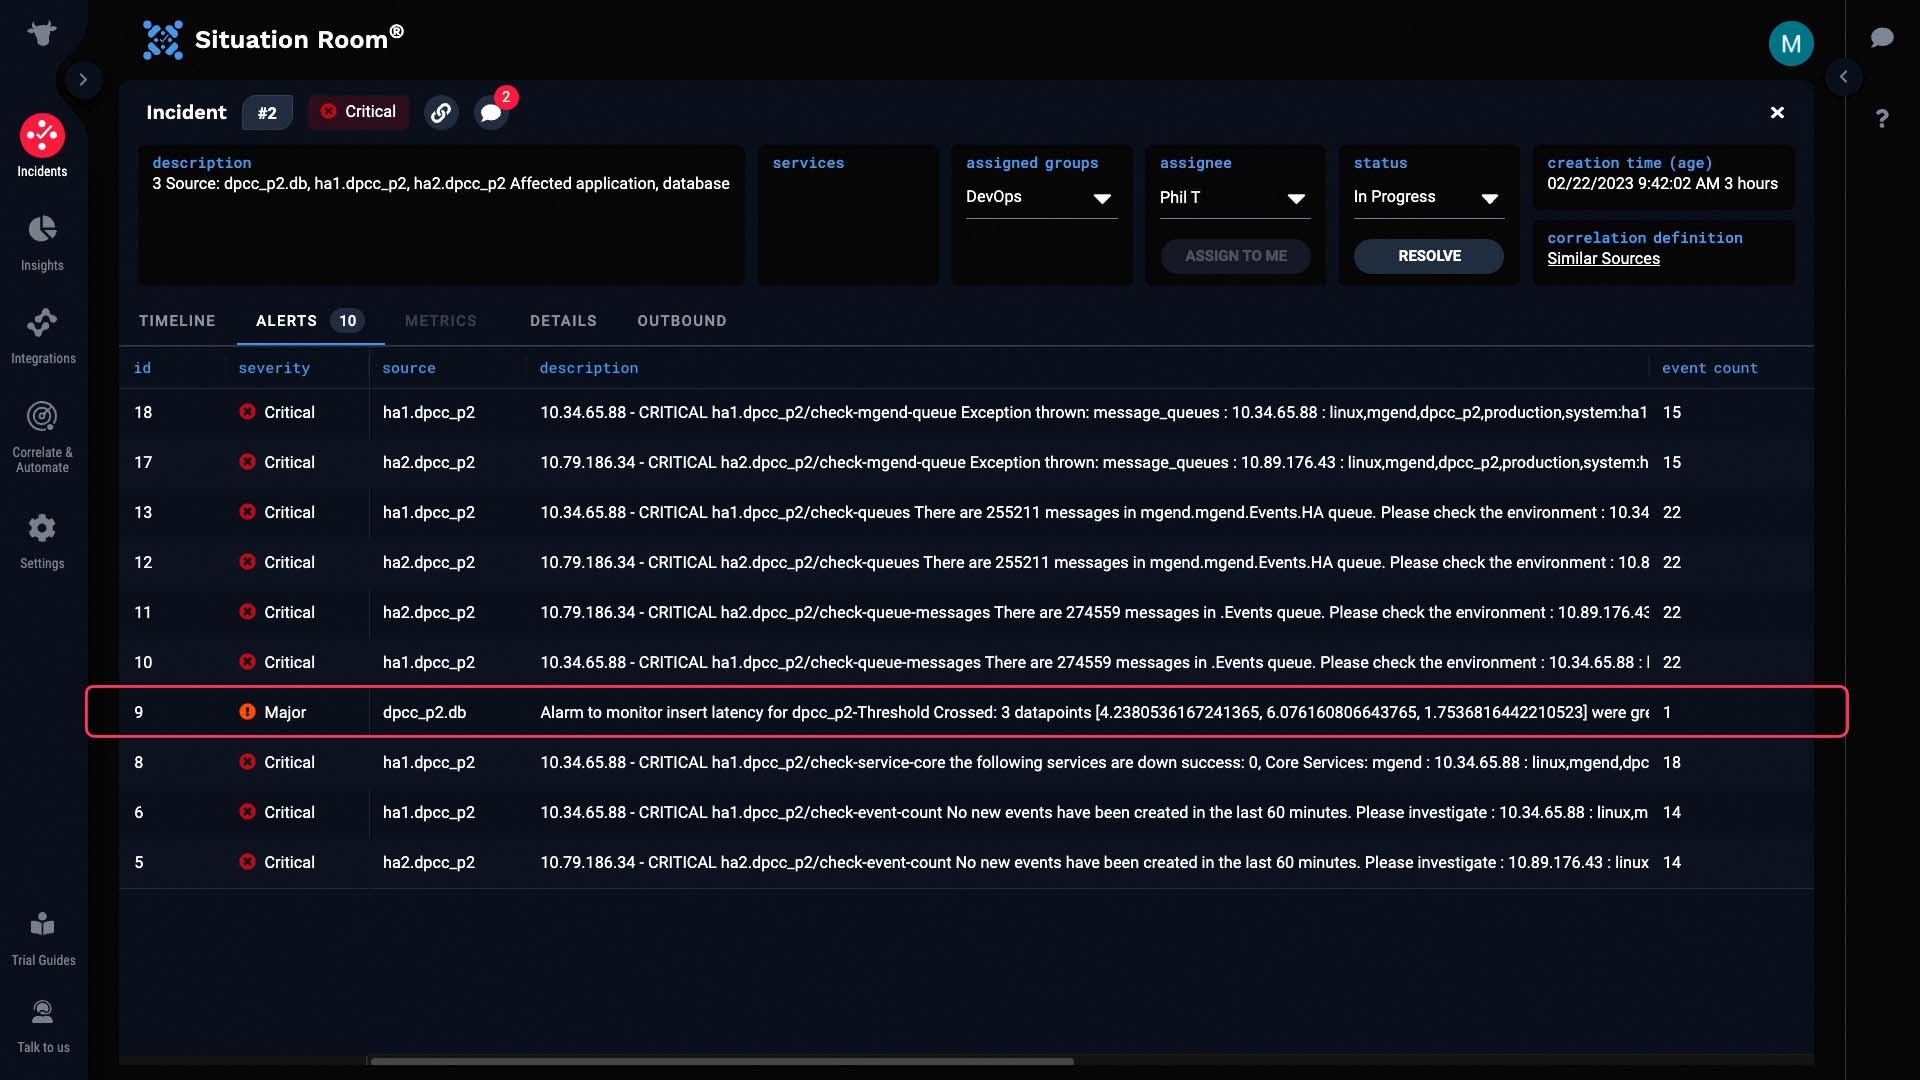
Looking here, it looks like we are having problems with slow database writes. It’s possible that database problems might have caused the core processing service to fail.
So, through Incident Management’s deduplication and correlation functionality, instead of looking at 1700 events to find 169 related events, you are presented with a complete picture from the start. Thanks for watching!
BASIC | 2 MIN
This one is another scenario to get you to work in Moogsoft in a guided manner.
Use case walkthrough: A tour of Incident Management for DevOps users ►
This video steps through an example of how a DevOps engineer might use Incident Management to resolve an incident.
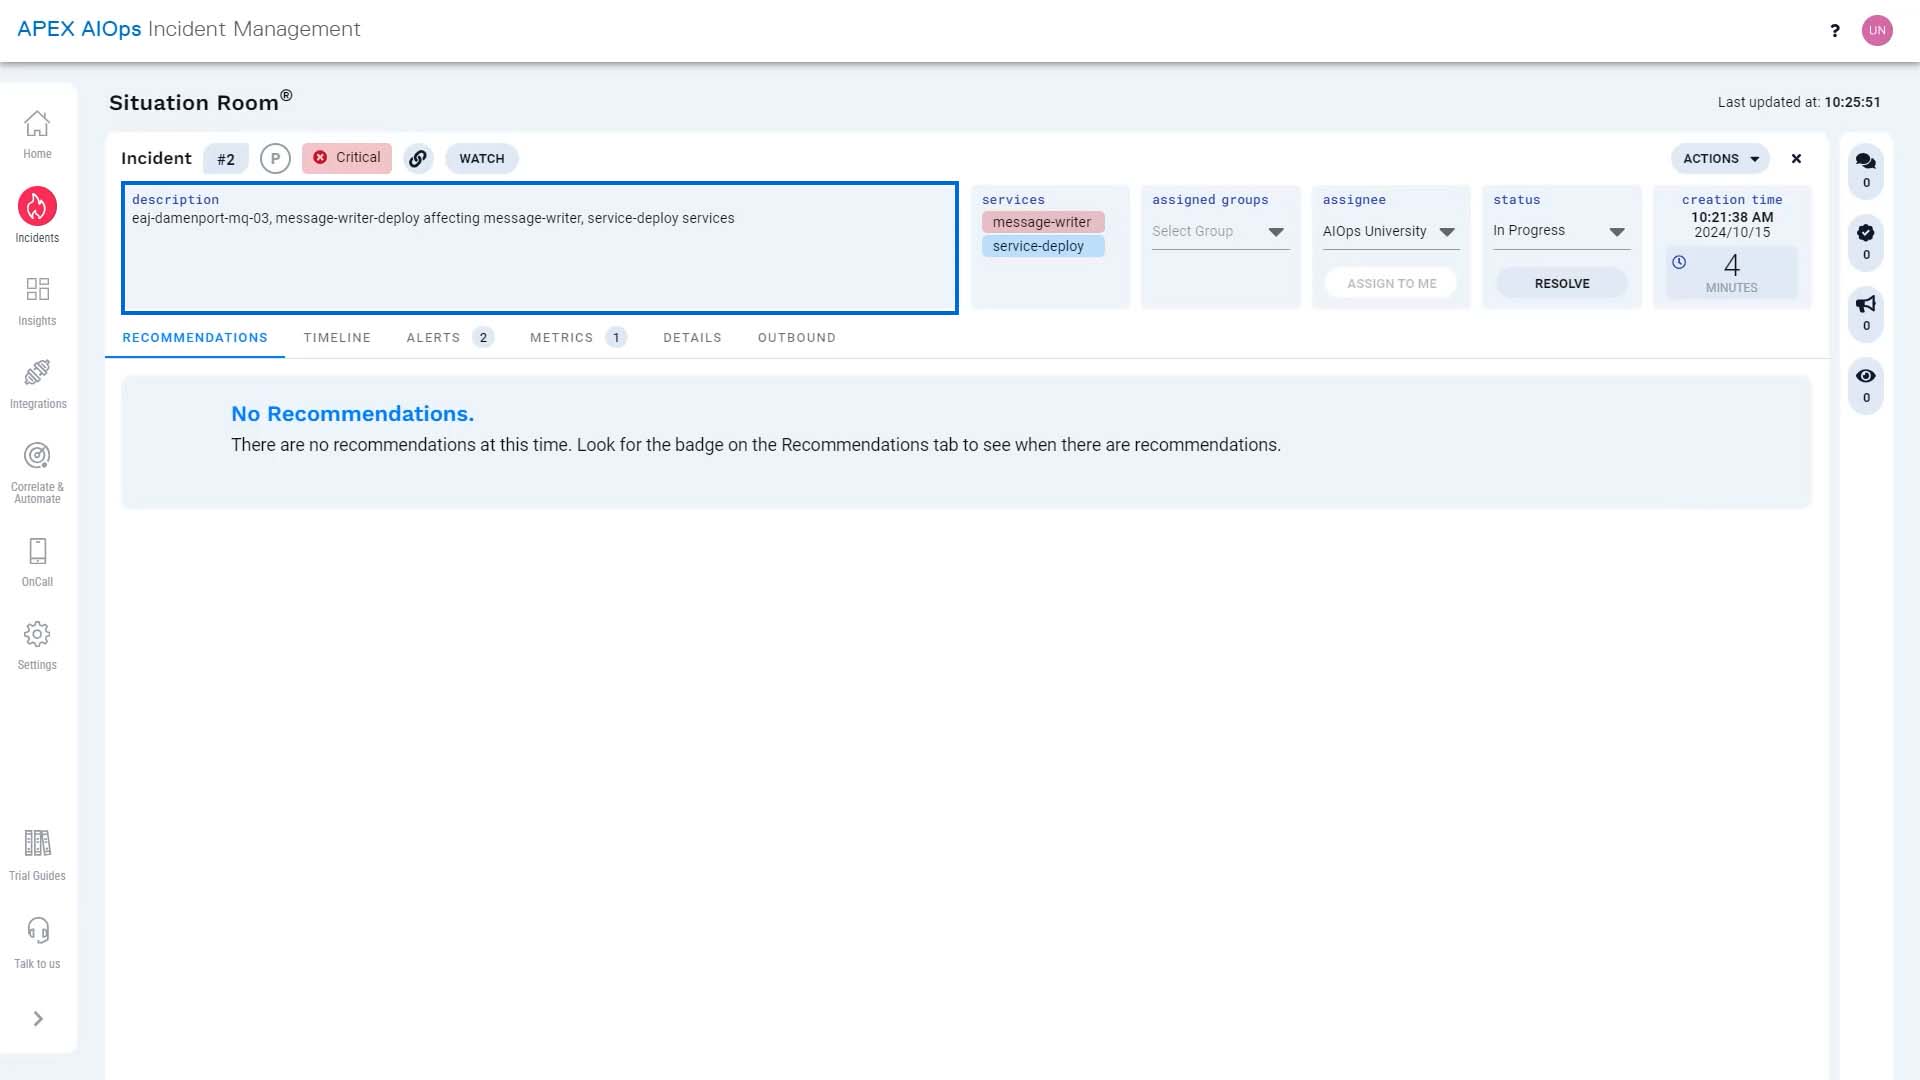
Let’s sample a day in the life of a DevOps engineer in Incident Management. This incident just came in. We are going to assign it to us and investigate.
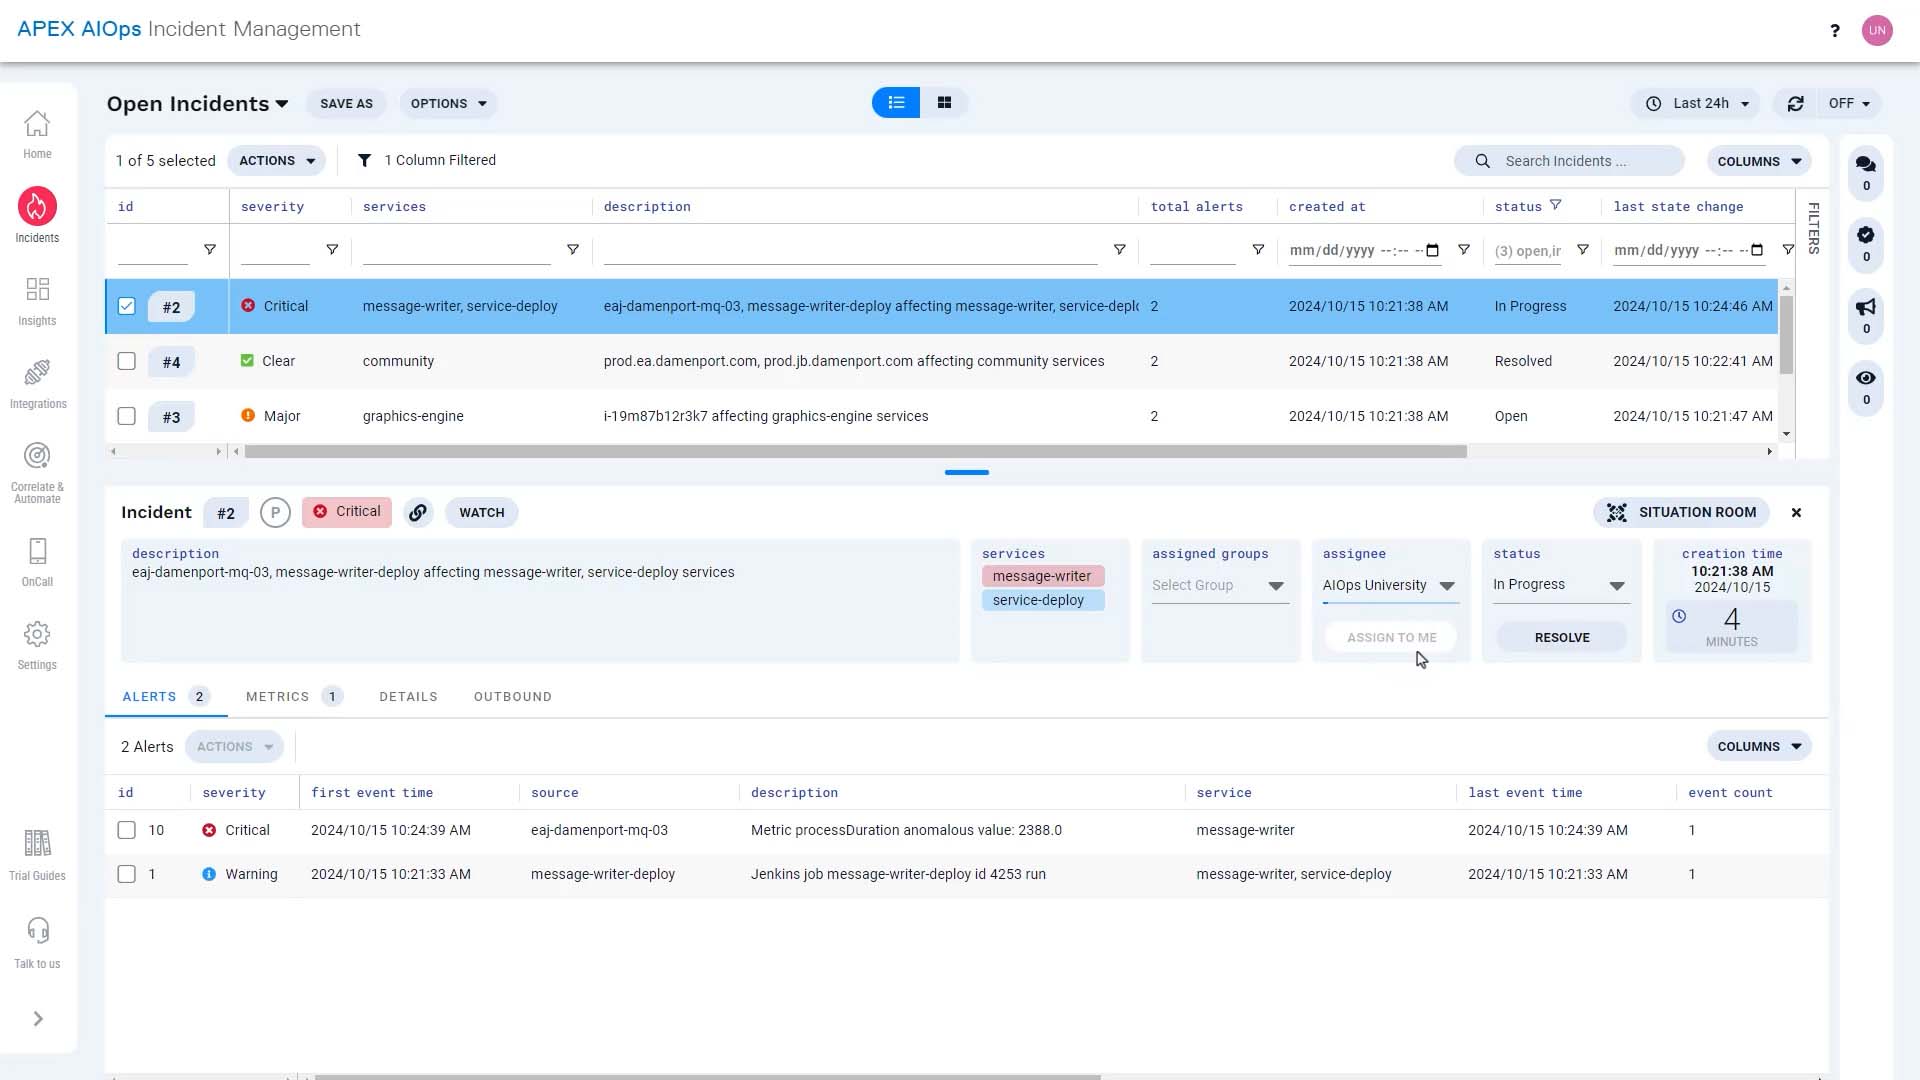
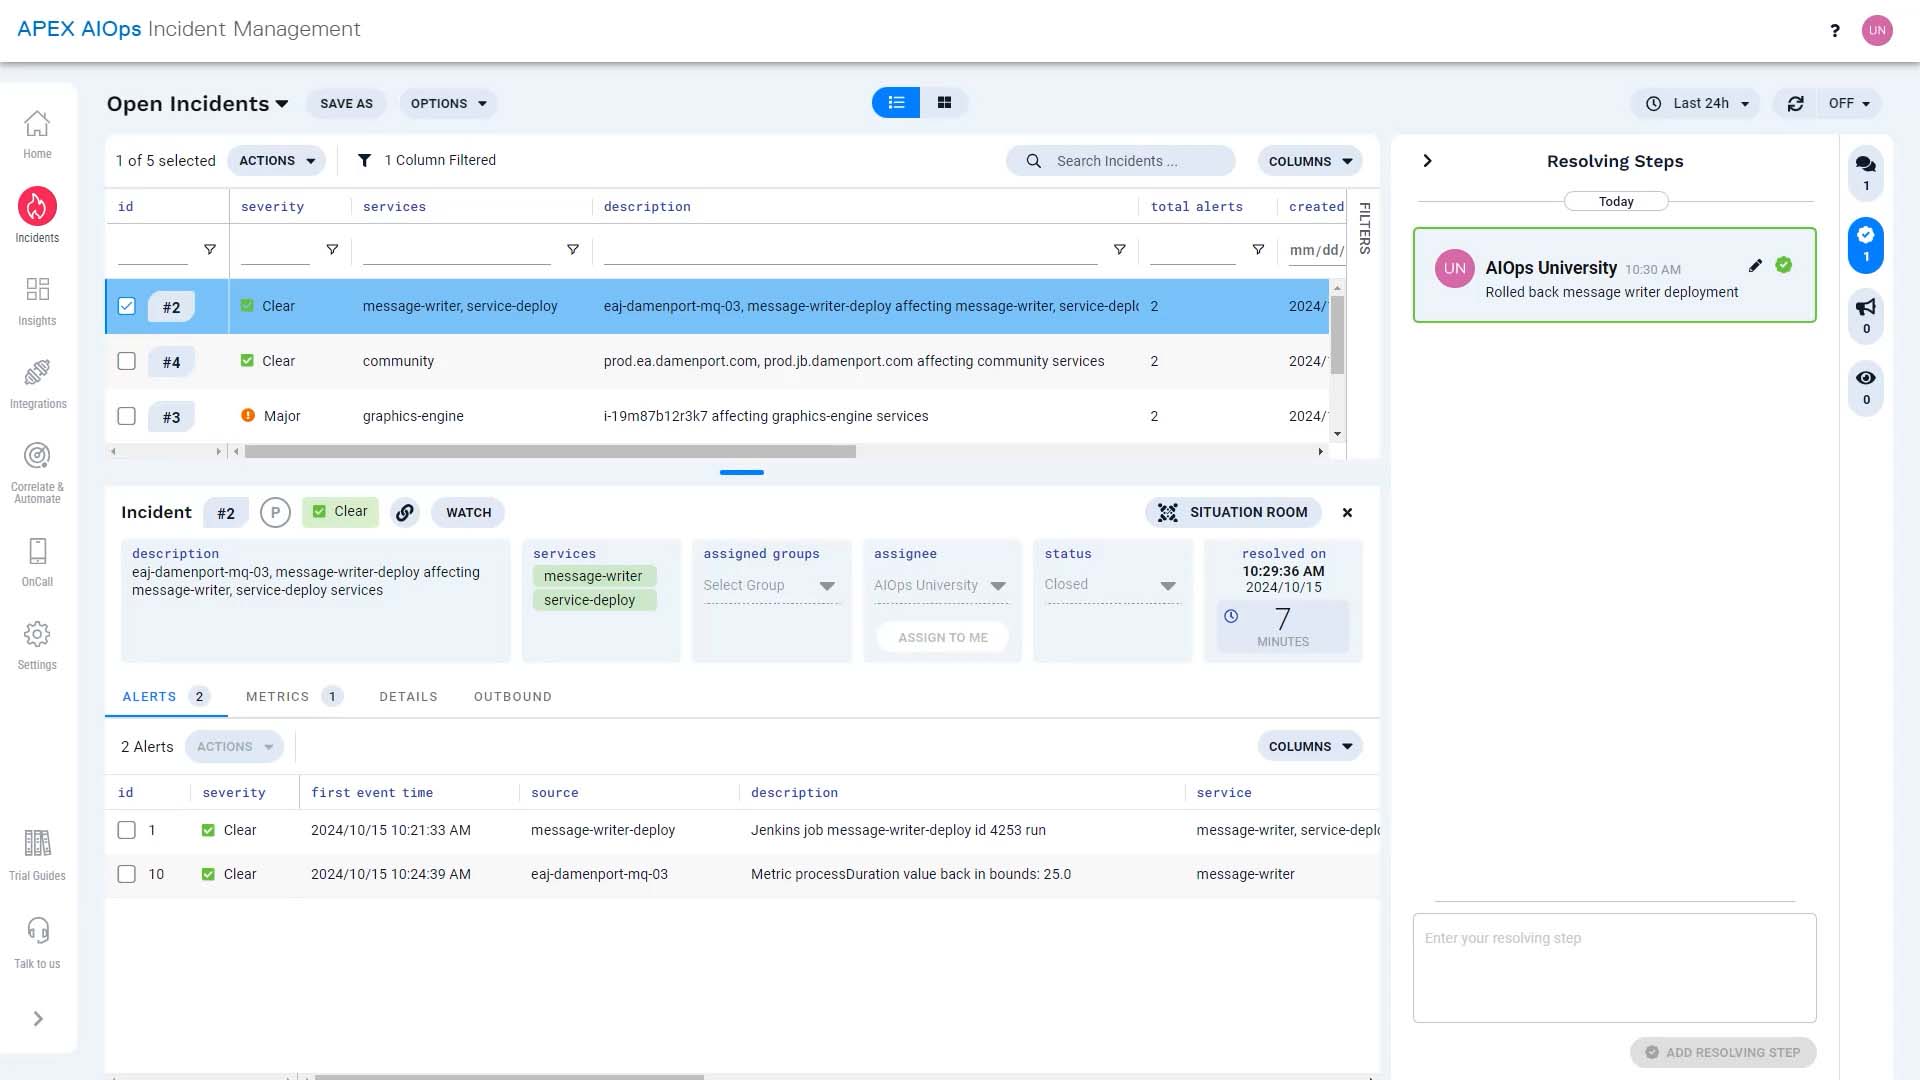
Let's go to the Situation Room for this incident. Judging from the description, the issue seems to be with the message writing service. Let’s take a look at the alerts that rolled up into this incident.
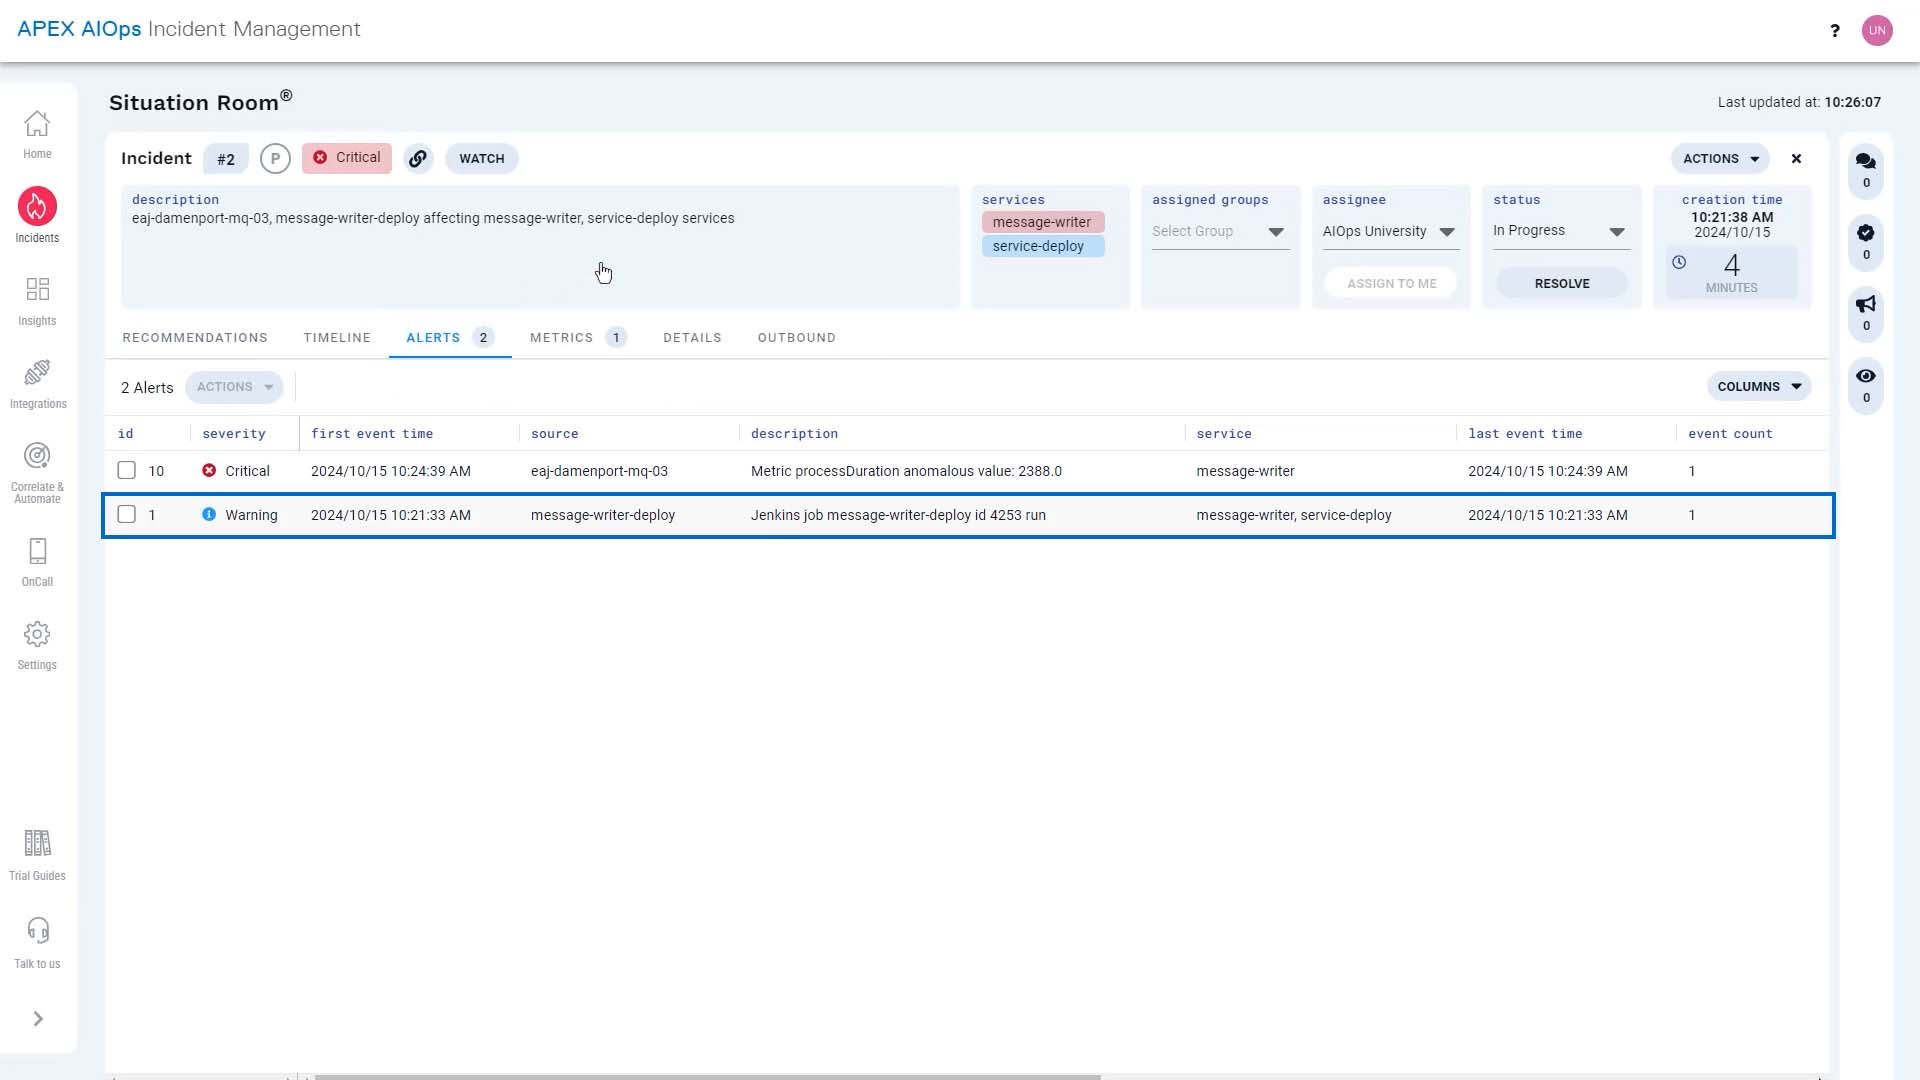
Let’s take a look at the alerts that rolled up into this incident. This is the first alert. The description says we just deployed an updated message writer service.
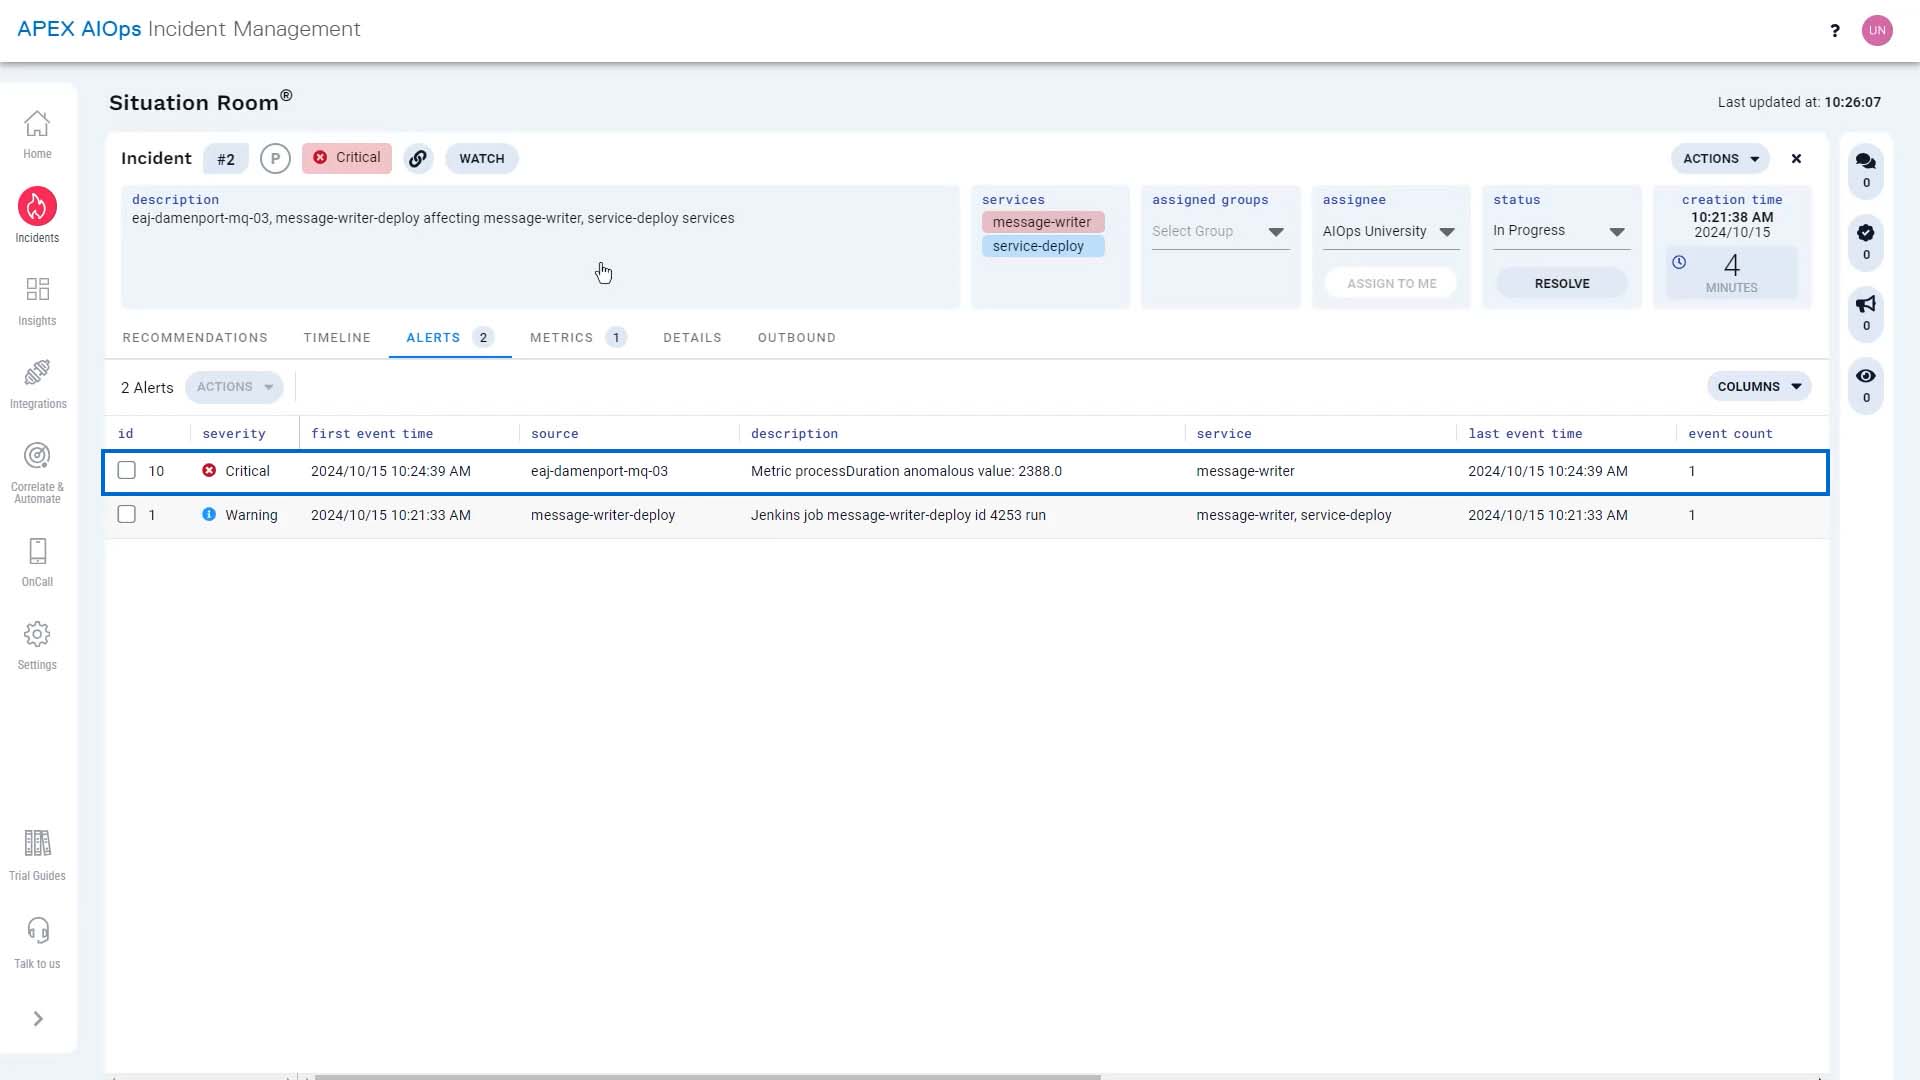
Then minutes later, the process duration metric went out of bounds to the critical state. So there seems to be a connection here.
Let’s verify this connection by looking at the metrics. By default, the metrics screen is set to show the incident range, but we want to see it in the context of what’s normal.
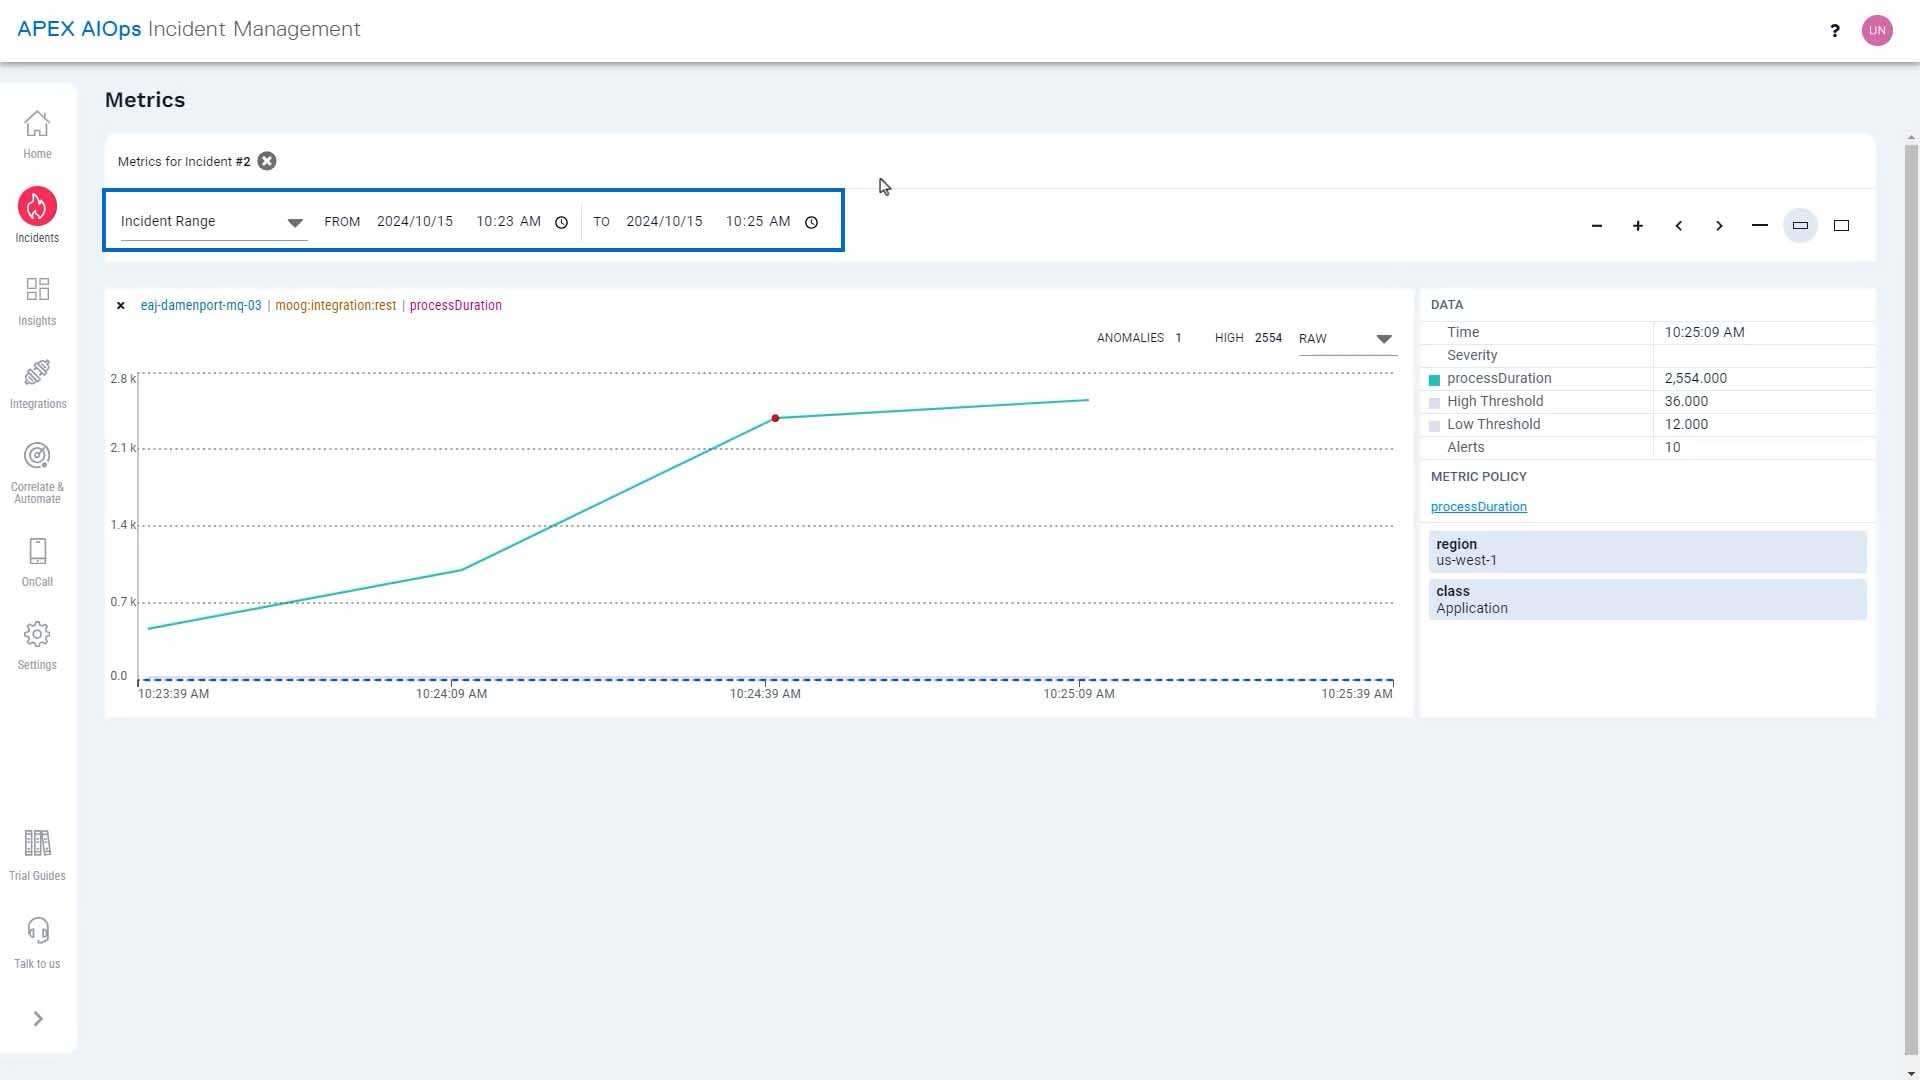
So we are going to zoom out a bit… and set the time range to the last half hour.
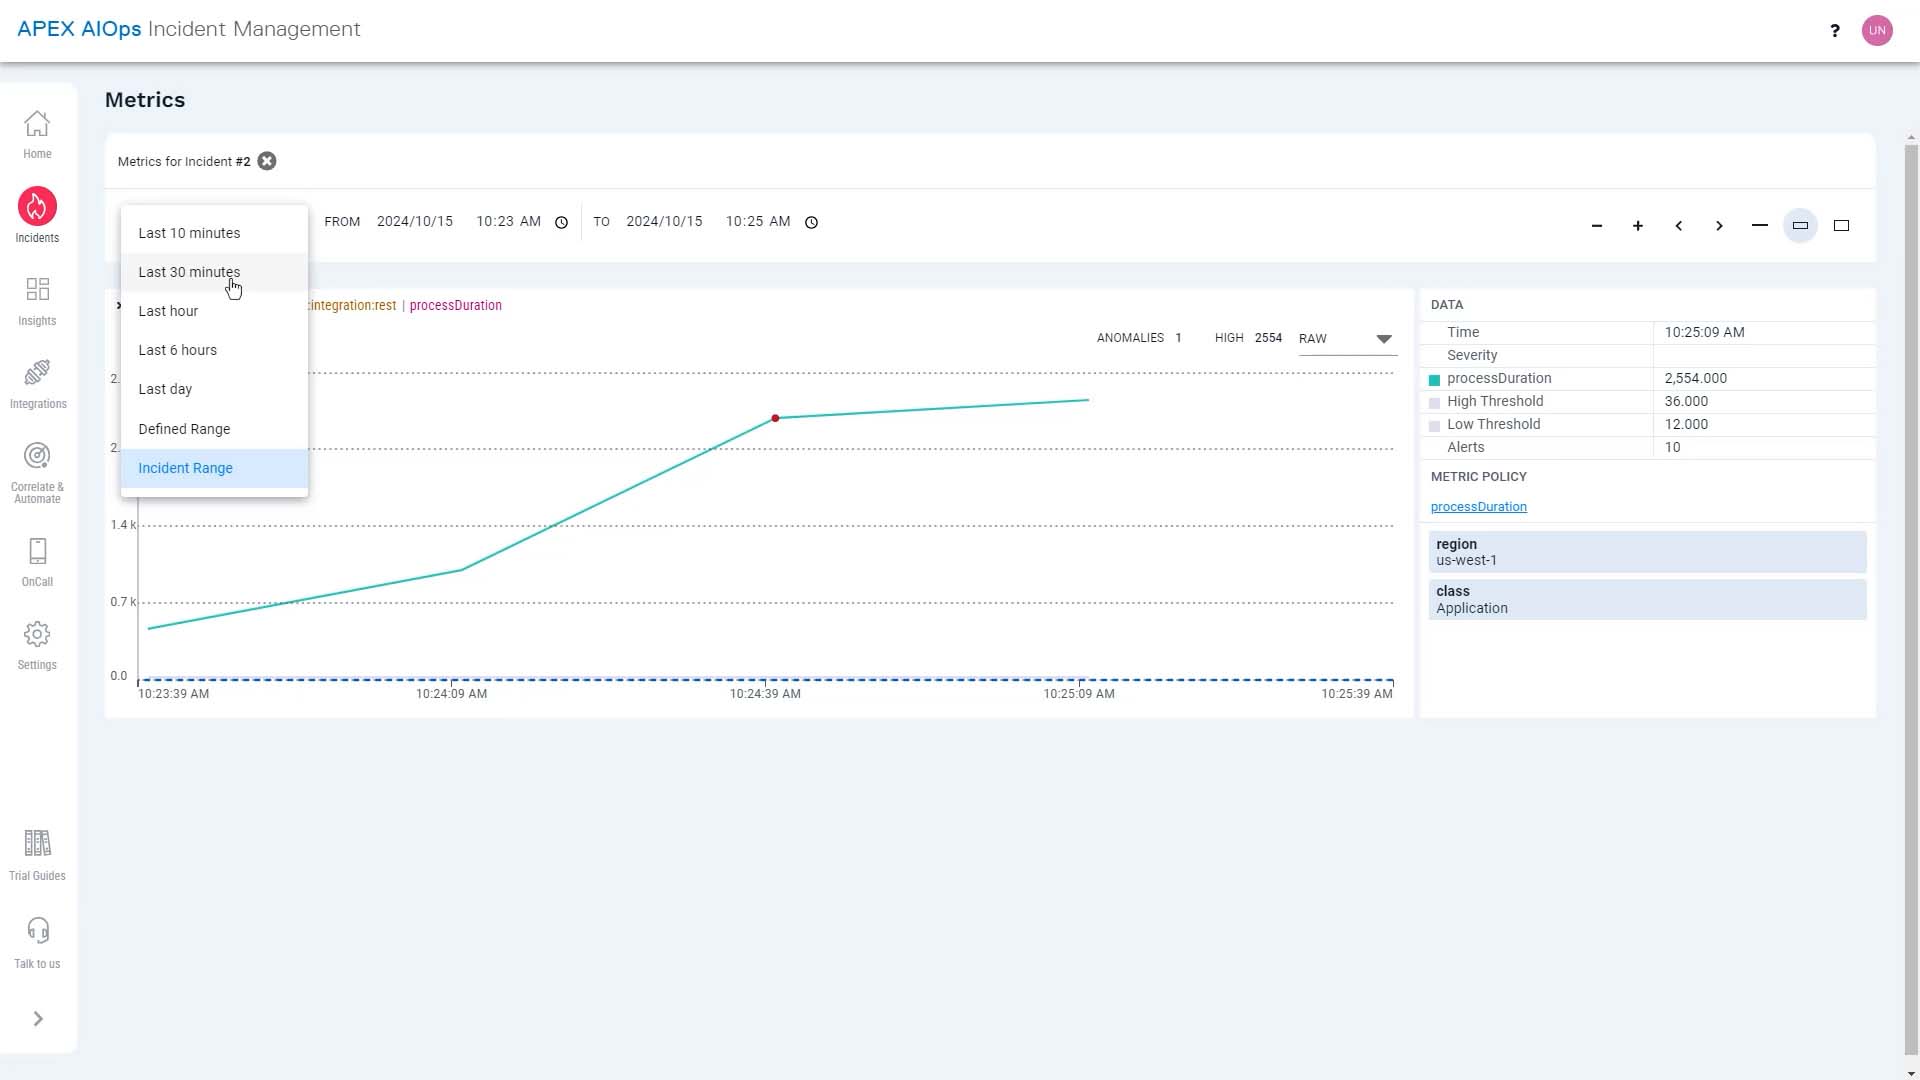
This is where the process duration metrics alert was triggered. Normally, it hardly takes 20 milliseconds to write anything to the database, and now it’s taking several seconds. That’s not good.
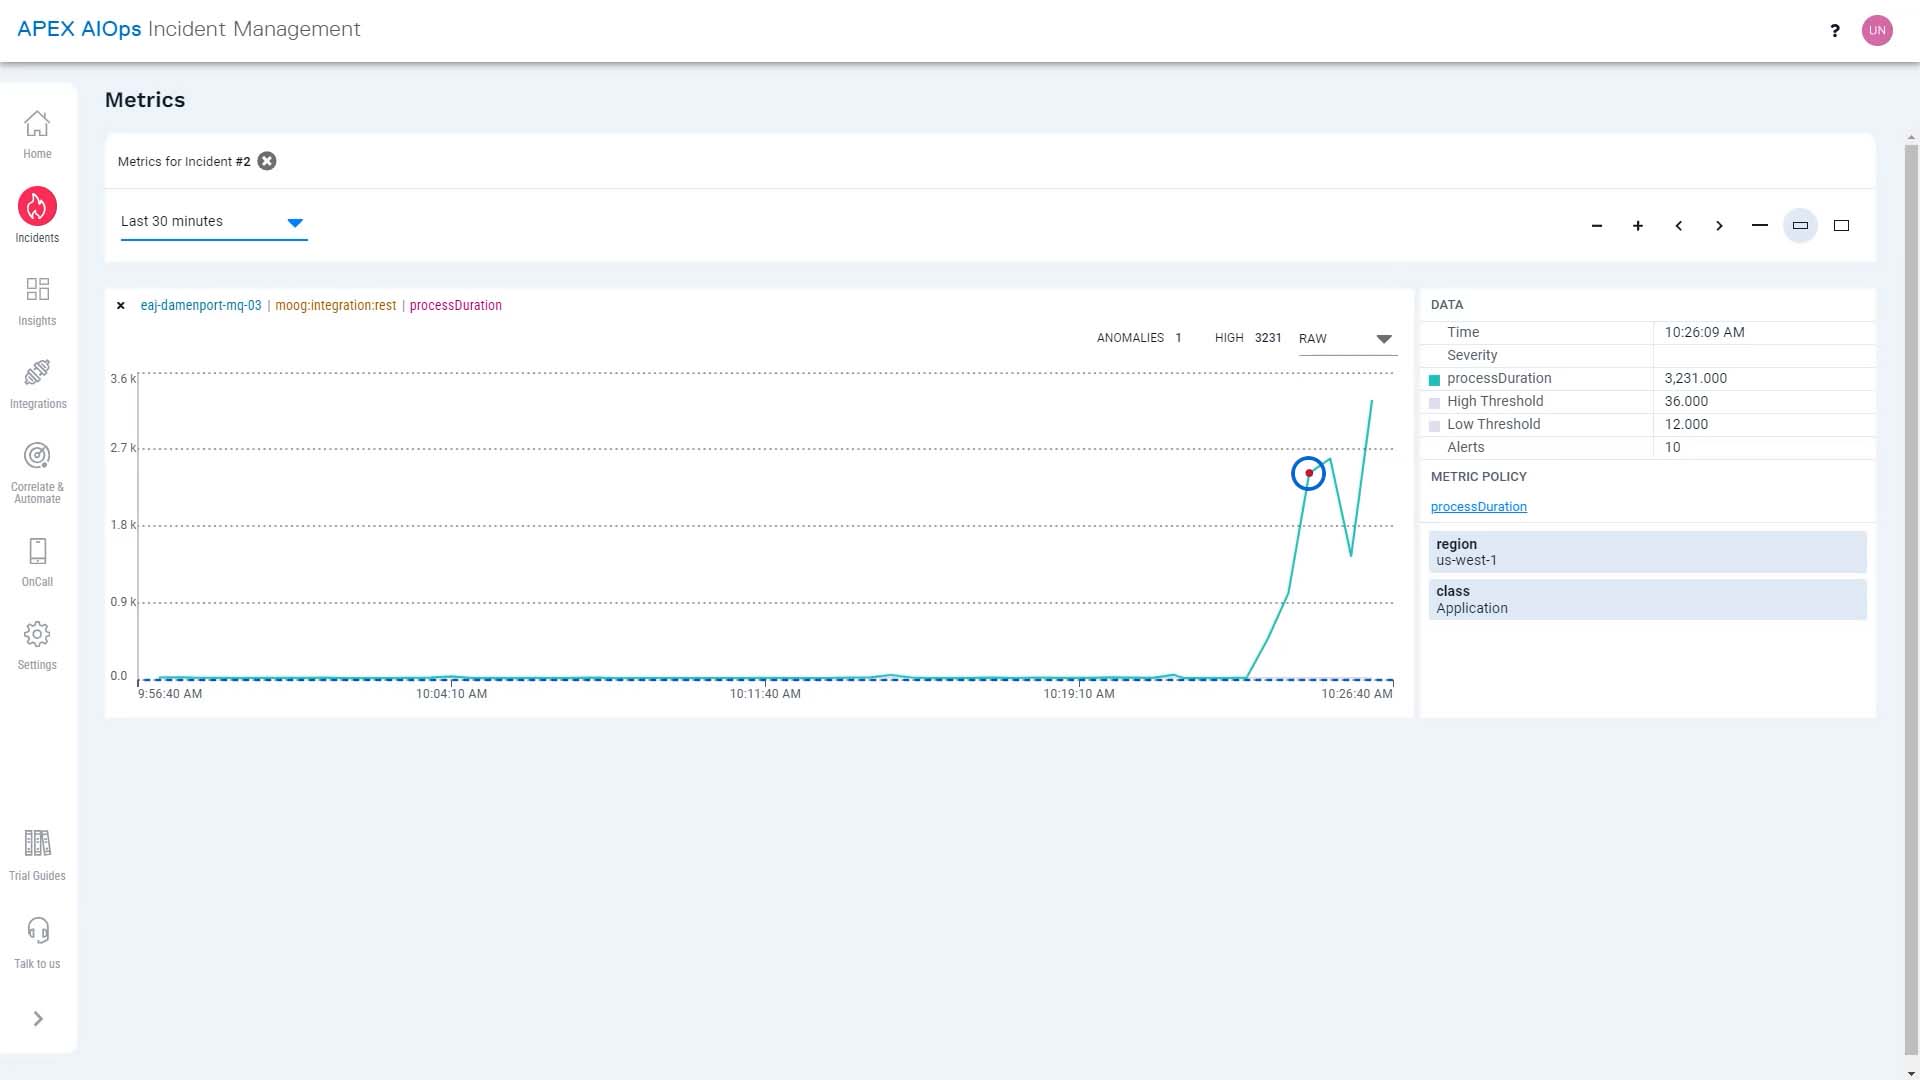
Now we have a choice- we could rollback the deployment and fix the issue in code that’s adding seconds to this process, or accept this as a new norm and have Incident Management learn it. For now, we are going to roll it back.
We rolled back the service update. And now a few minutes later, it looks like the metrics are back to normal. We’ll examine the message writing service and deploy an updated version when ready.
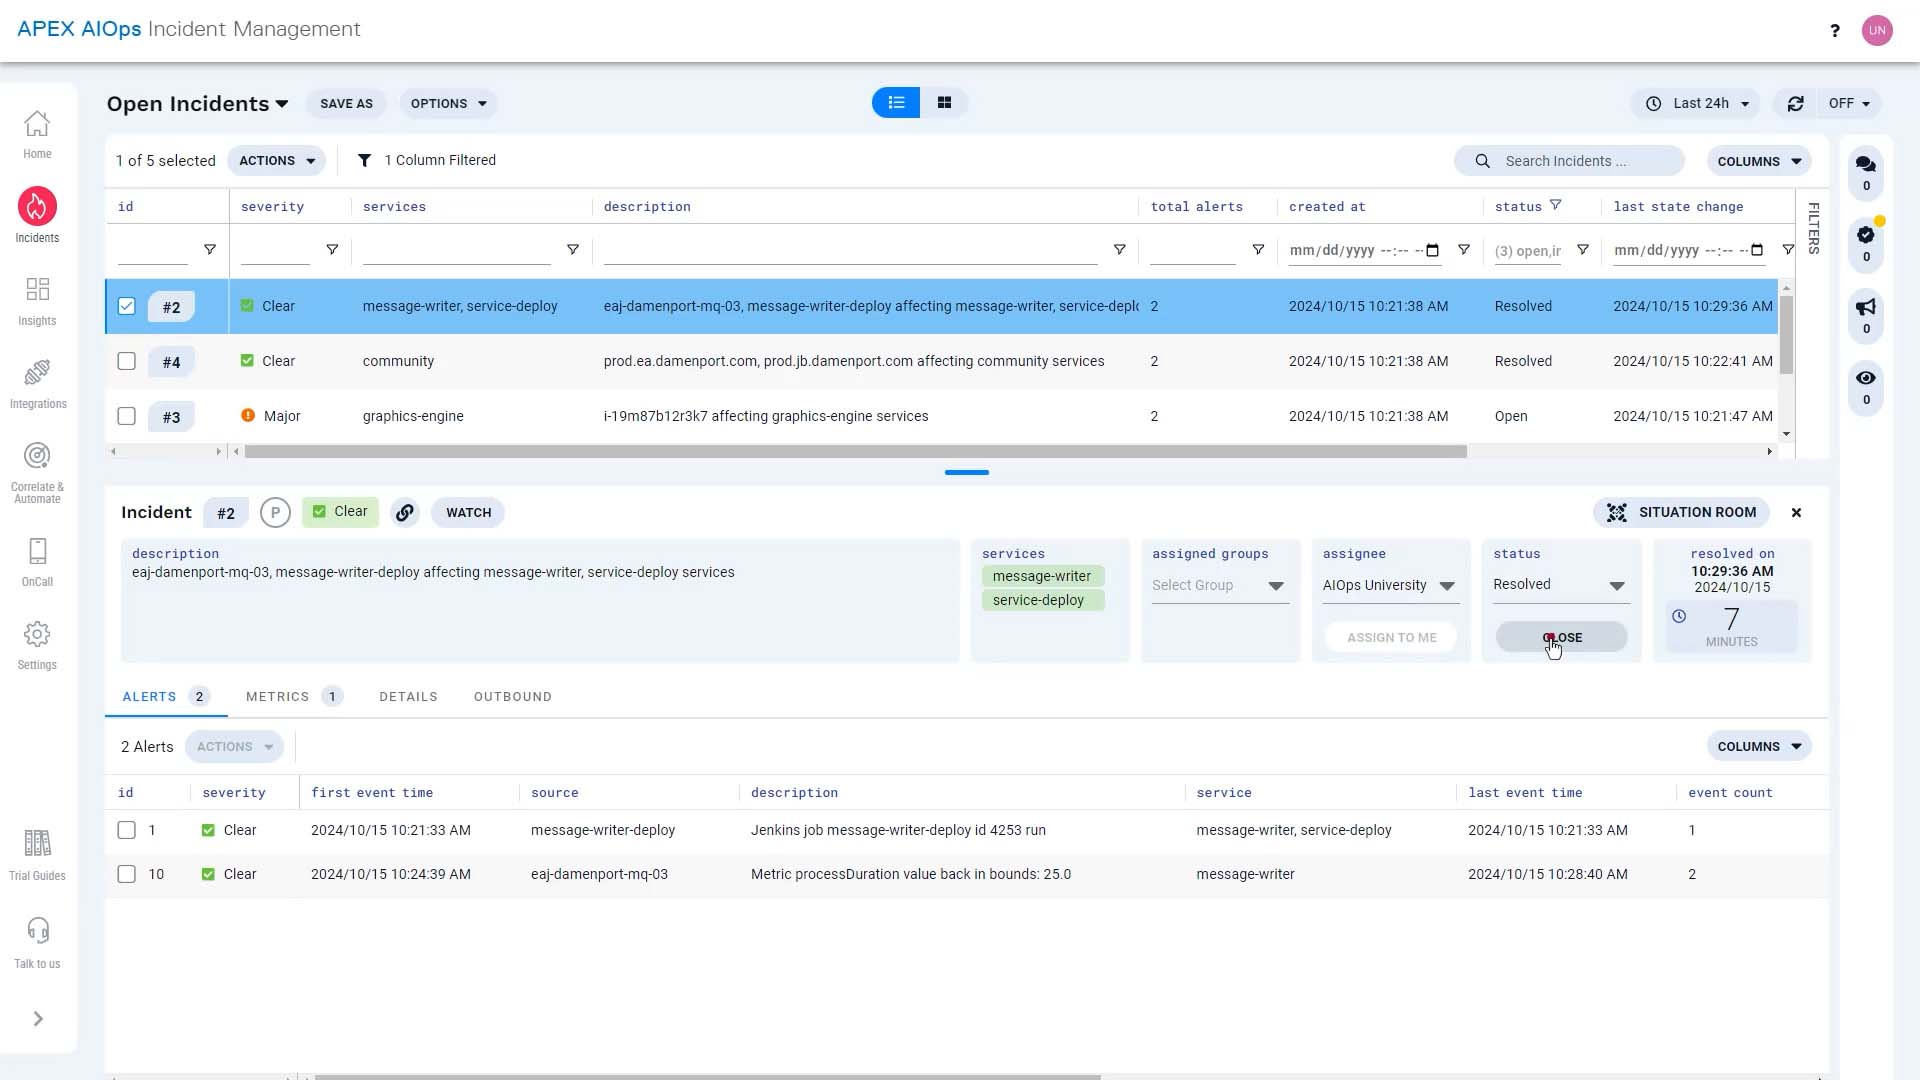
We are going to go back to the incident and close it. We’ll describe what we did to resolve the incident here, that way, Incident Management can suggest a solution for similar incidents in the future.
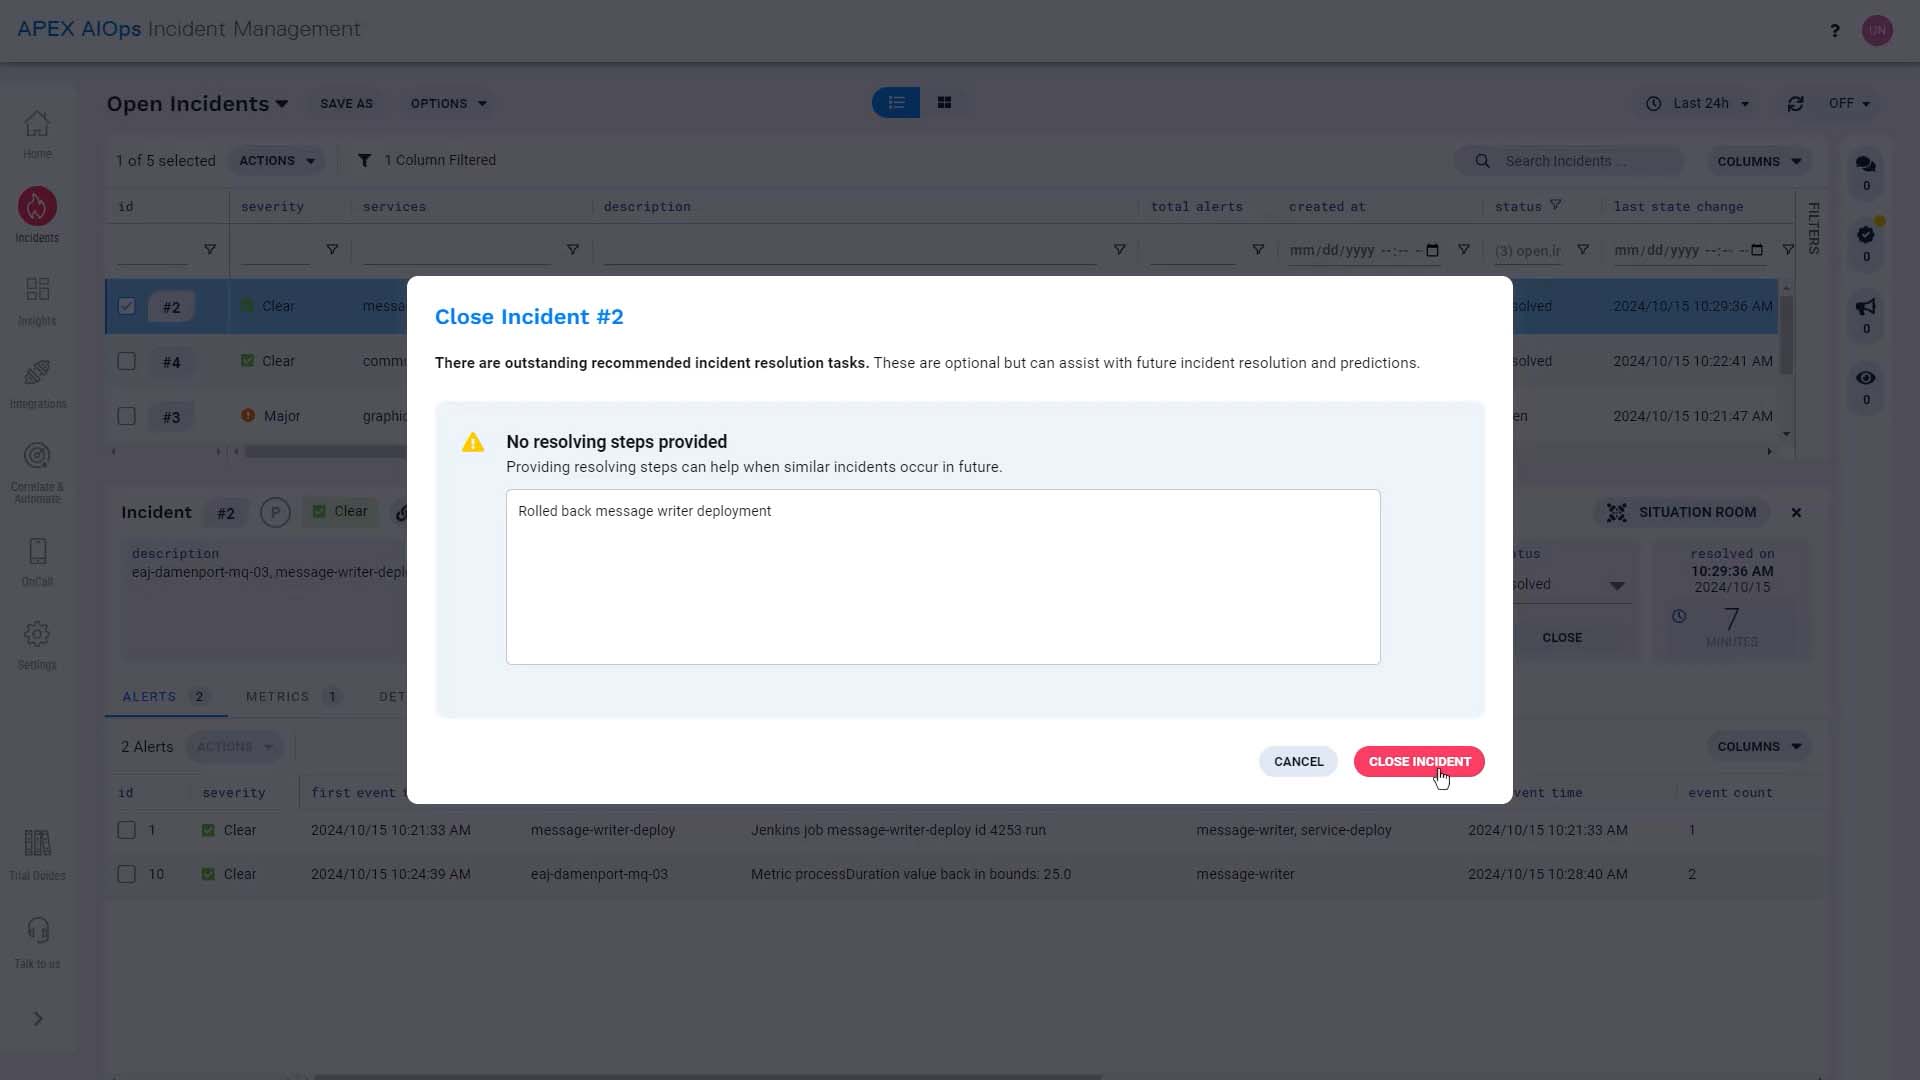
All set! Now you have seen a sample DevOps workflow in Incident Management. Thanks for watching!
BASIC | 6 MIN
In this video, we will troubleshoot a sample incident to see the power of alert correlation.
Use case walkthrough: Power of alert correlation ►
This video steps through a use case example to showcase the power of alert correlation in APEX AIOps Incident Management.
*Please note Moogsoft is now part of Dell's IT Operations solution called APEX AIOps, and changed its name to APEX AIOps Incident Management. The UI in this video may differ slightly but the content covered is still relevant.
We’ll troubleshoot a sample incident to see the power of alert correlation.
Here’s a simple setup that we’ll be using for our demonstration. We have a few different sources that are sending data to Incident Management.
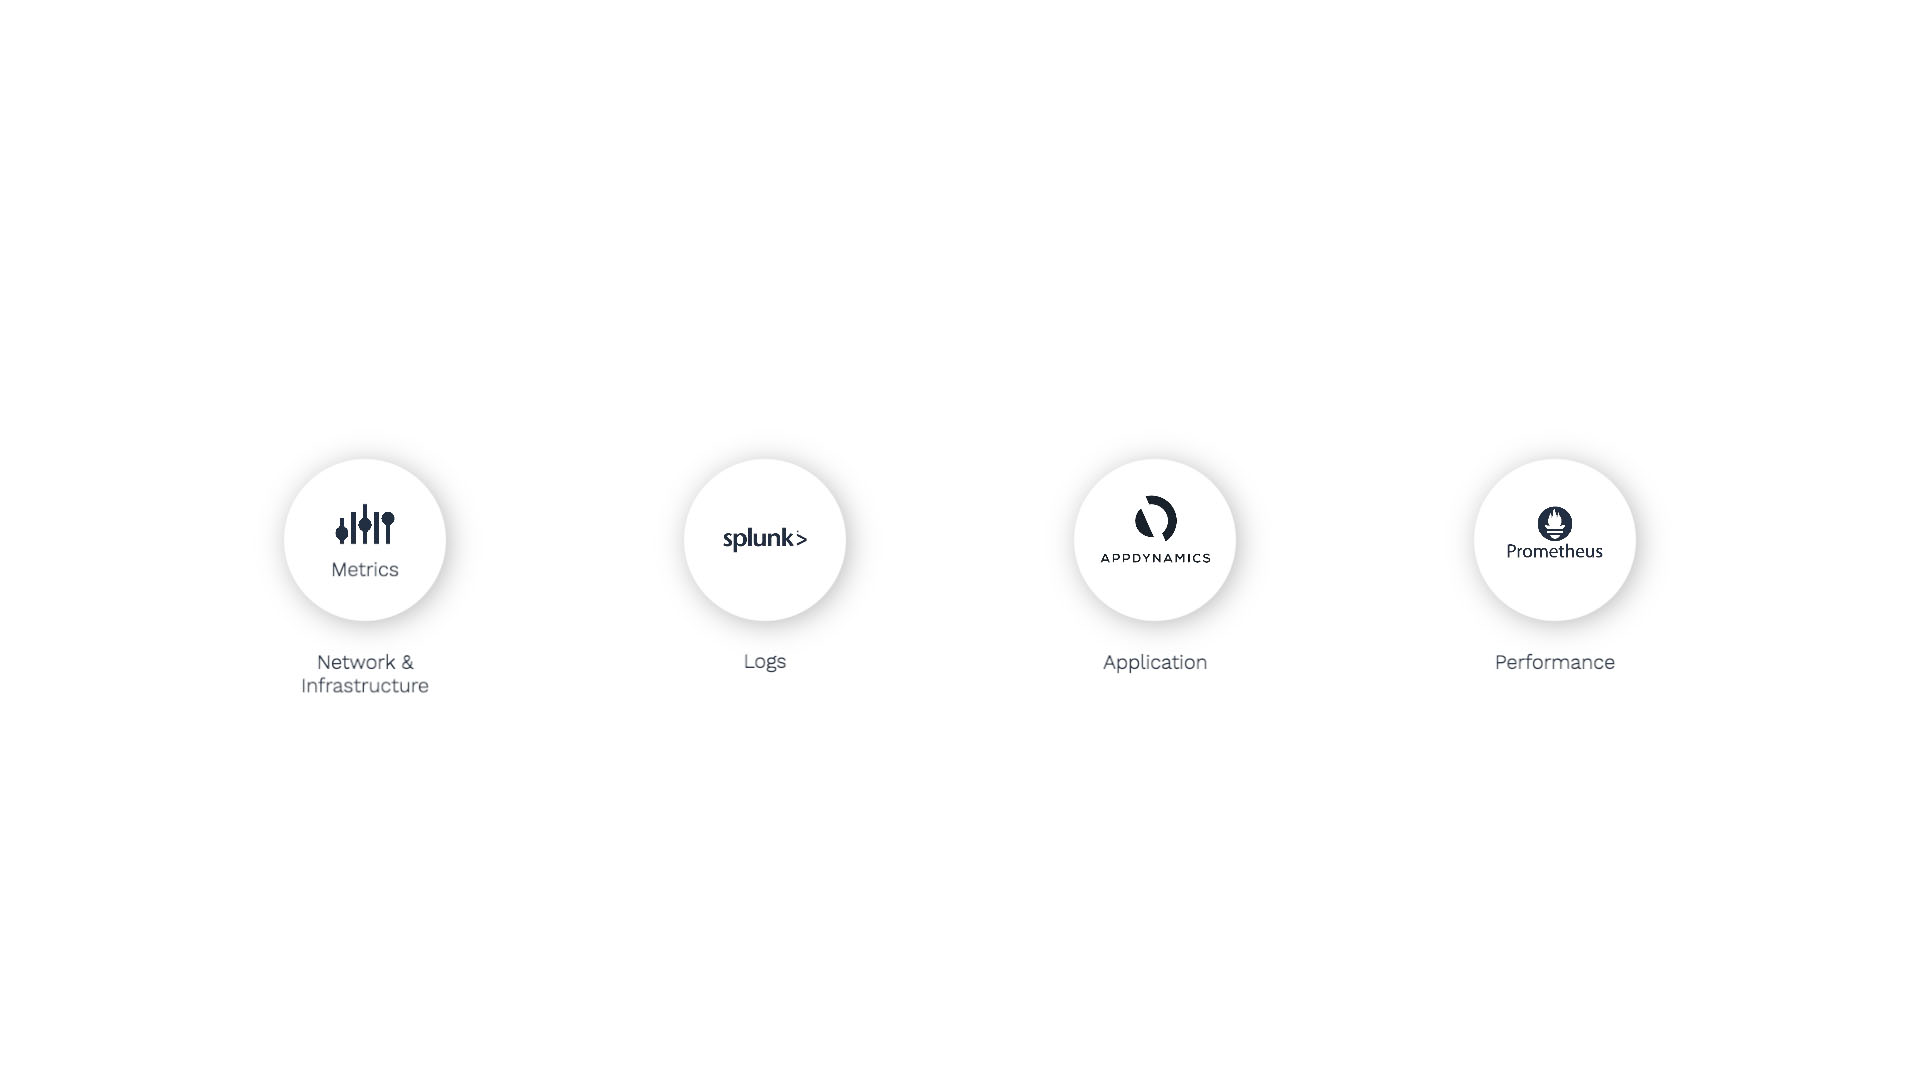
For starters, we’re ingesting metrics using the Metrics API. Incident Management is data agnostic, meaning that these metrics can be of any type, and can originate from any source.
We’re also using Splunk for logs and analytics, AppDynamics for application performance monitoring, and Prometheus for database and infrastructure performance monitoring.
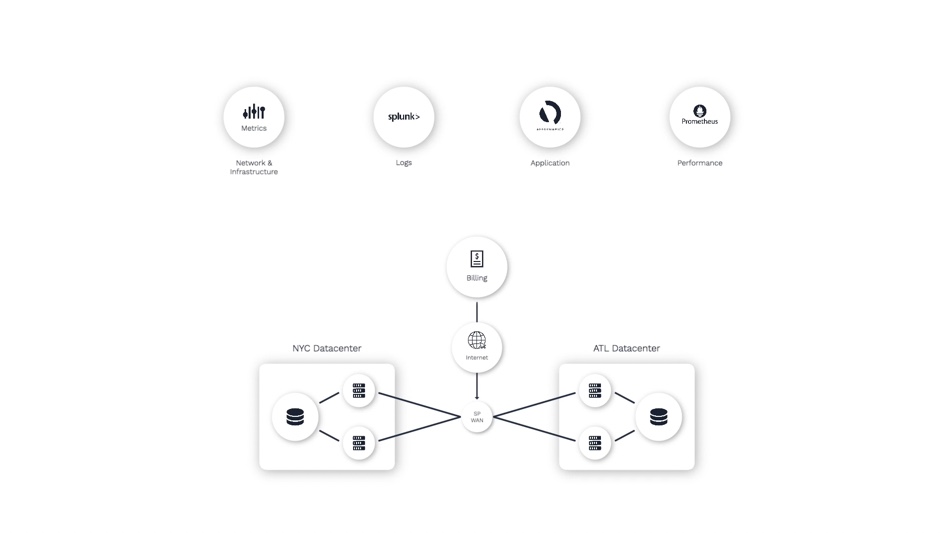
And here’s what we are monitoring.
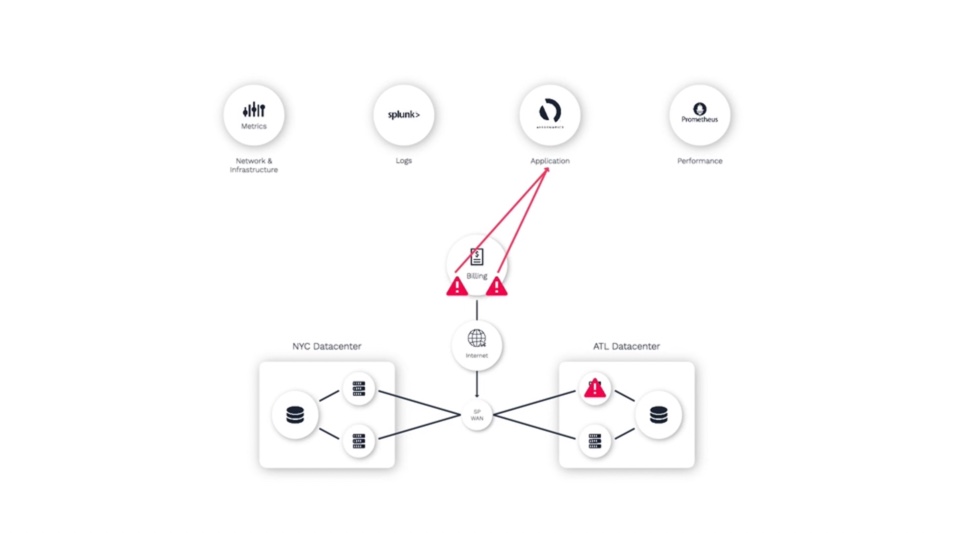
We have a three-tier, customer-facing application called Billing that relies on databases in Atlanta and New York.
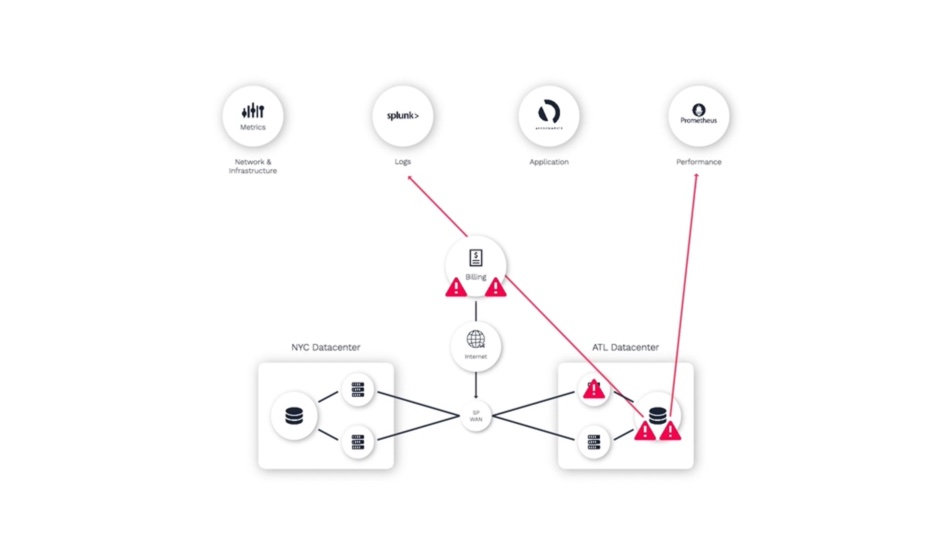
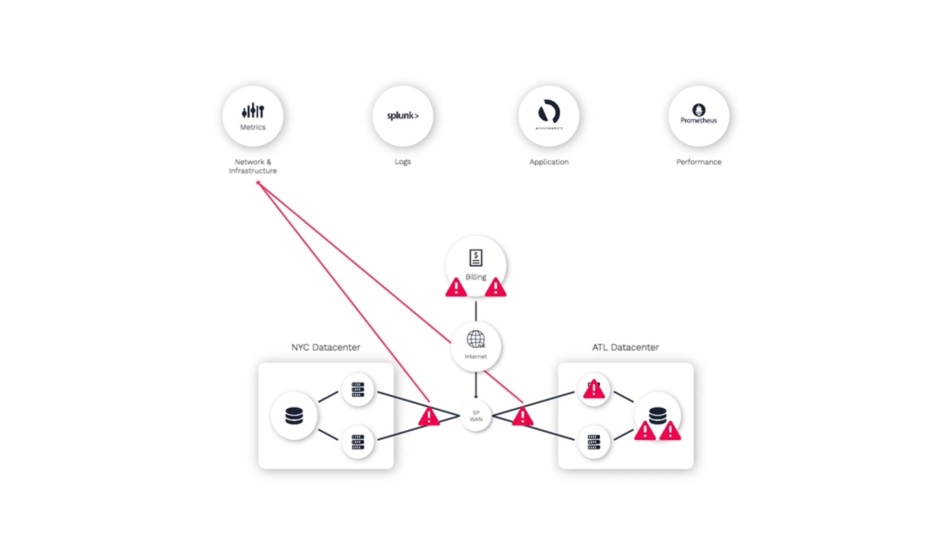
One of the switches in the Atlanta data center experiences some degradation - maybe some packet loss - which impedes the communication between the application server and database.
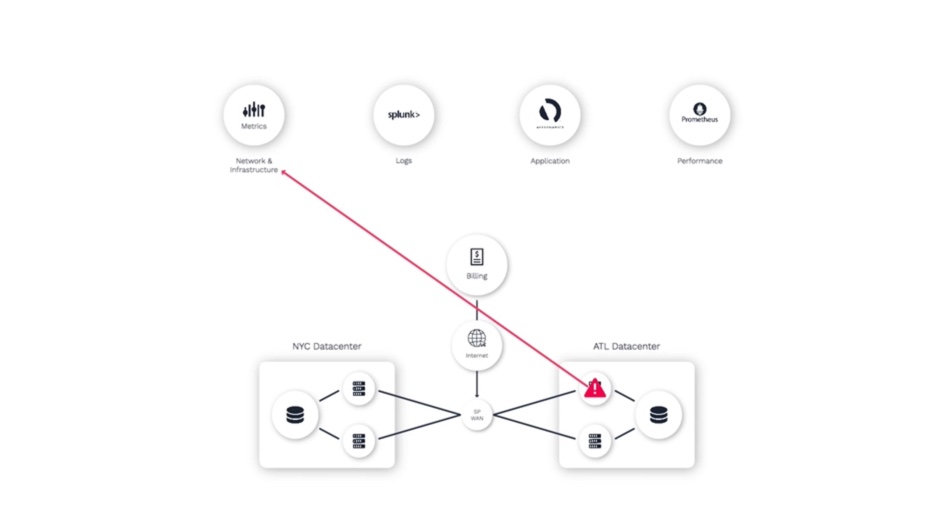
Since all three of these domains are monitored by different teams using different tools, we’ll see application alerts...
Database alerts...
And network alerts.
As an operator trying to resolve this problem, they often don’t have visibility into what other teams are seeing in their monitoring tools. So it takes time to synthesize your analysis of what you can see, with the insights from others.
That’s where Incident Management comes in. Incident Management identifies related alerts and groups them together, organizes them into relevant incidents, and presents these incidents with rich context, making it easy for us to identify the underlying problem.
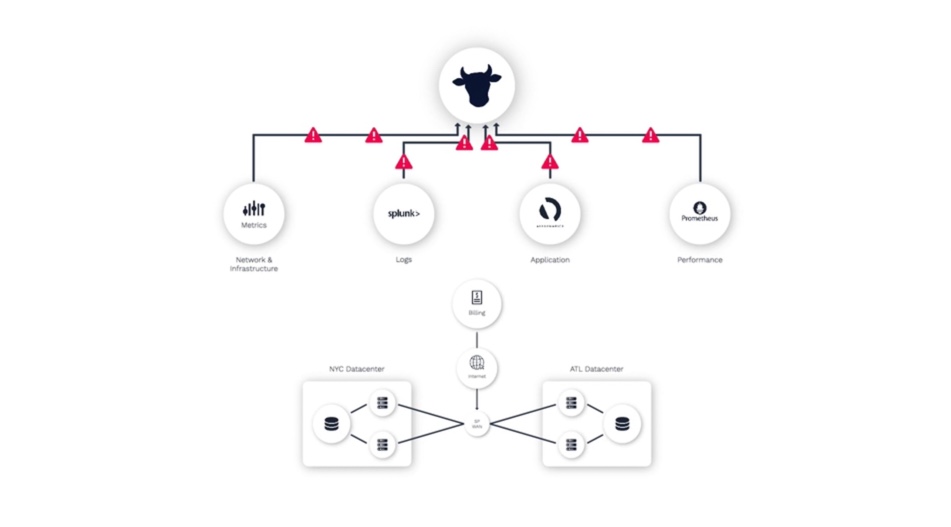
Let me show you what I mean.
Here is the Incidents panel, where we’ll start our triage efforts.
And this is the incident you’d get for the scenario we just went over.
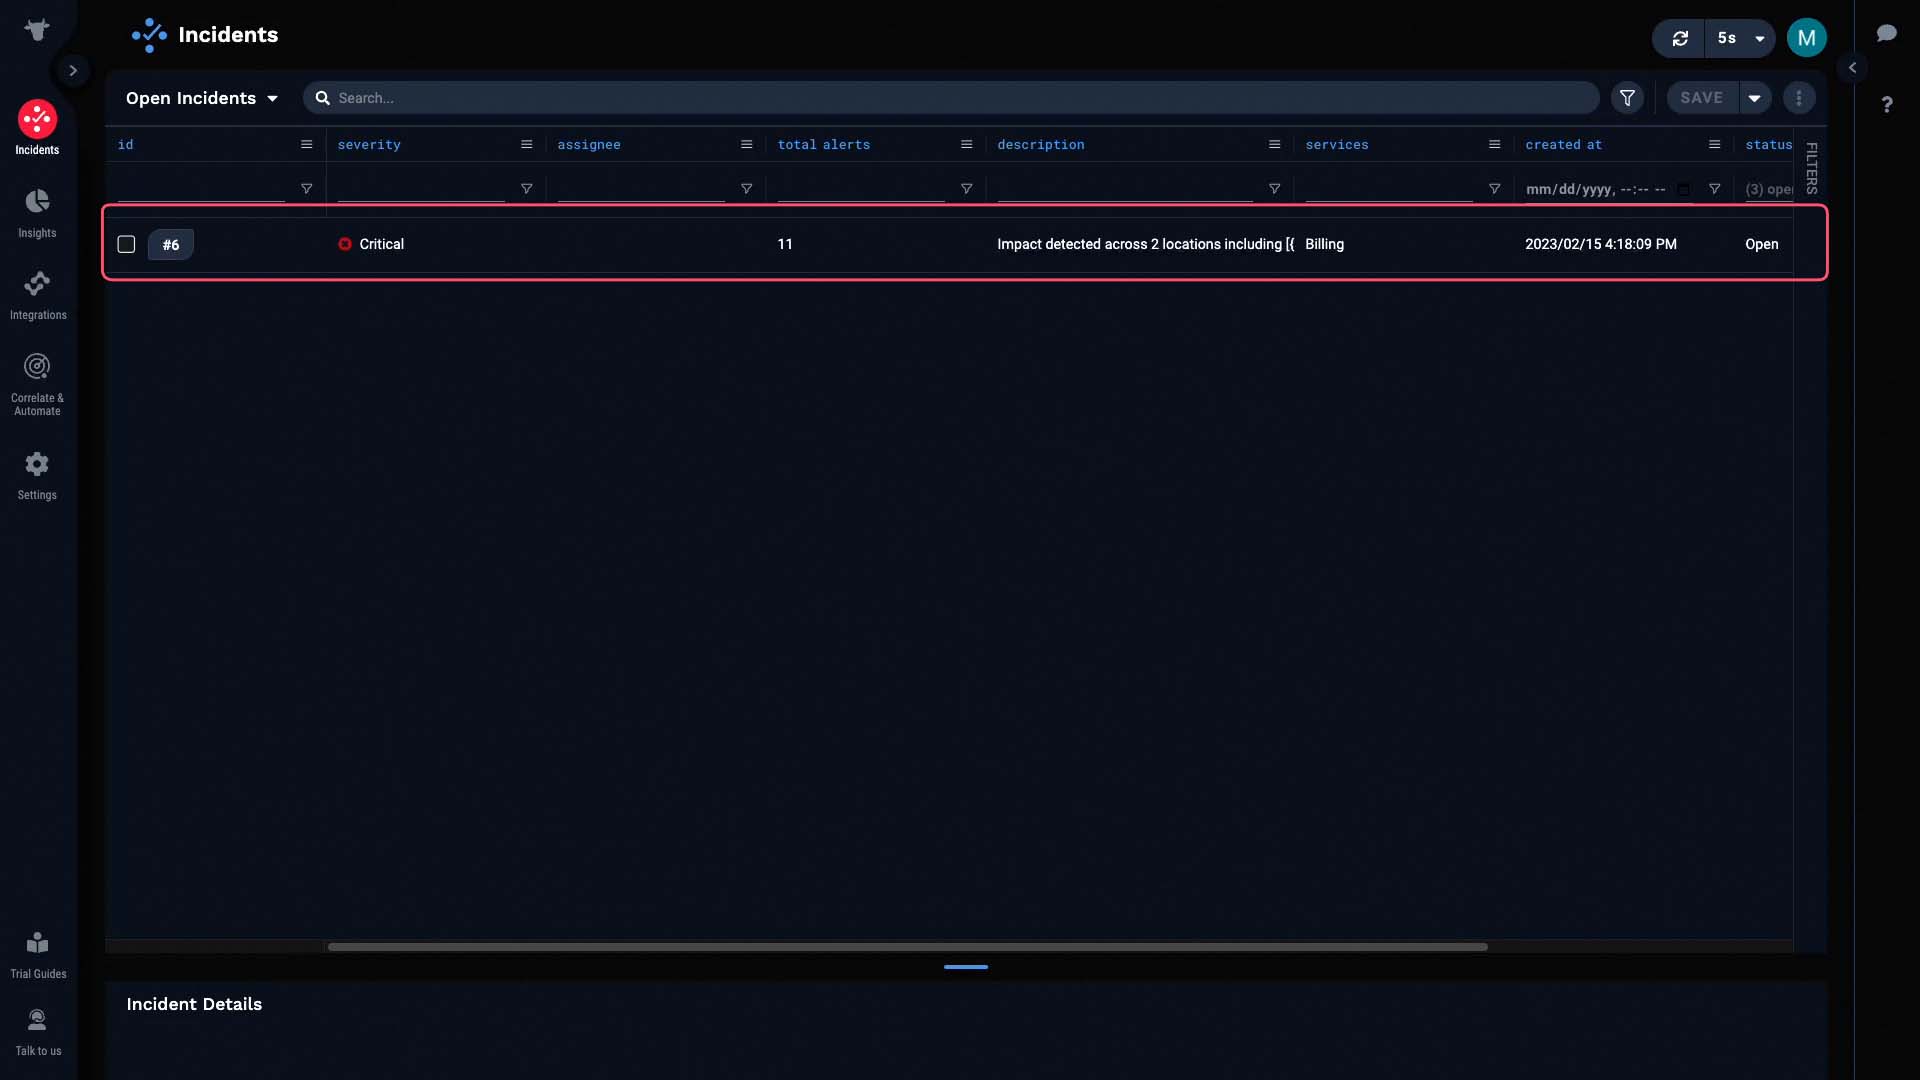
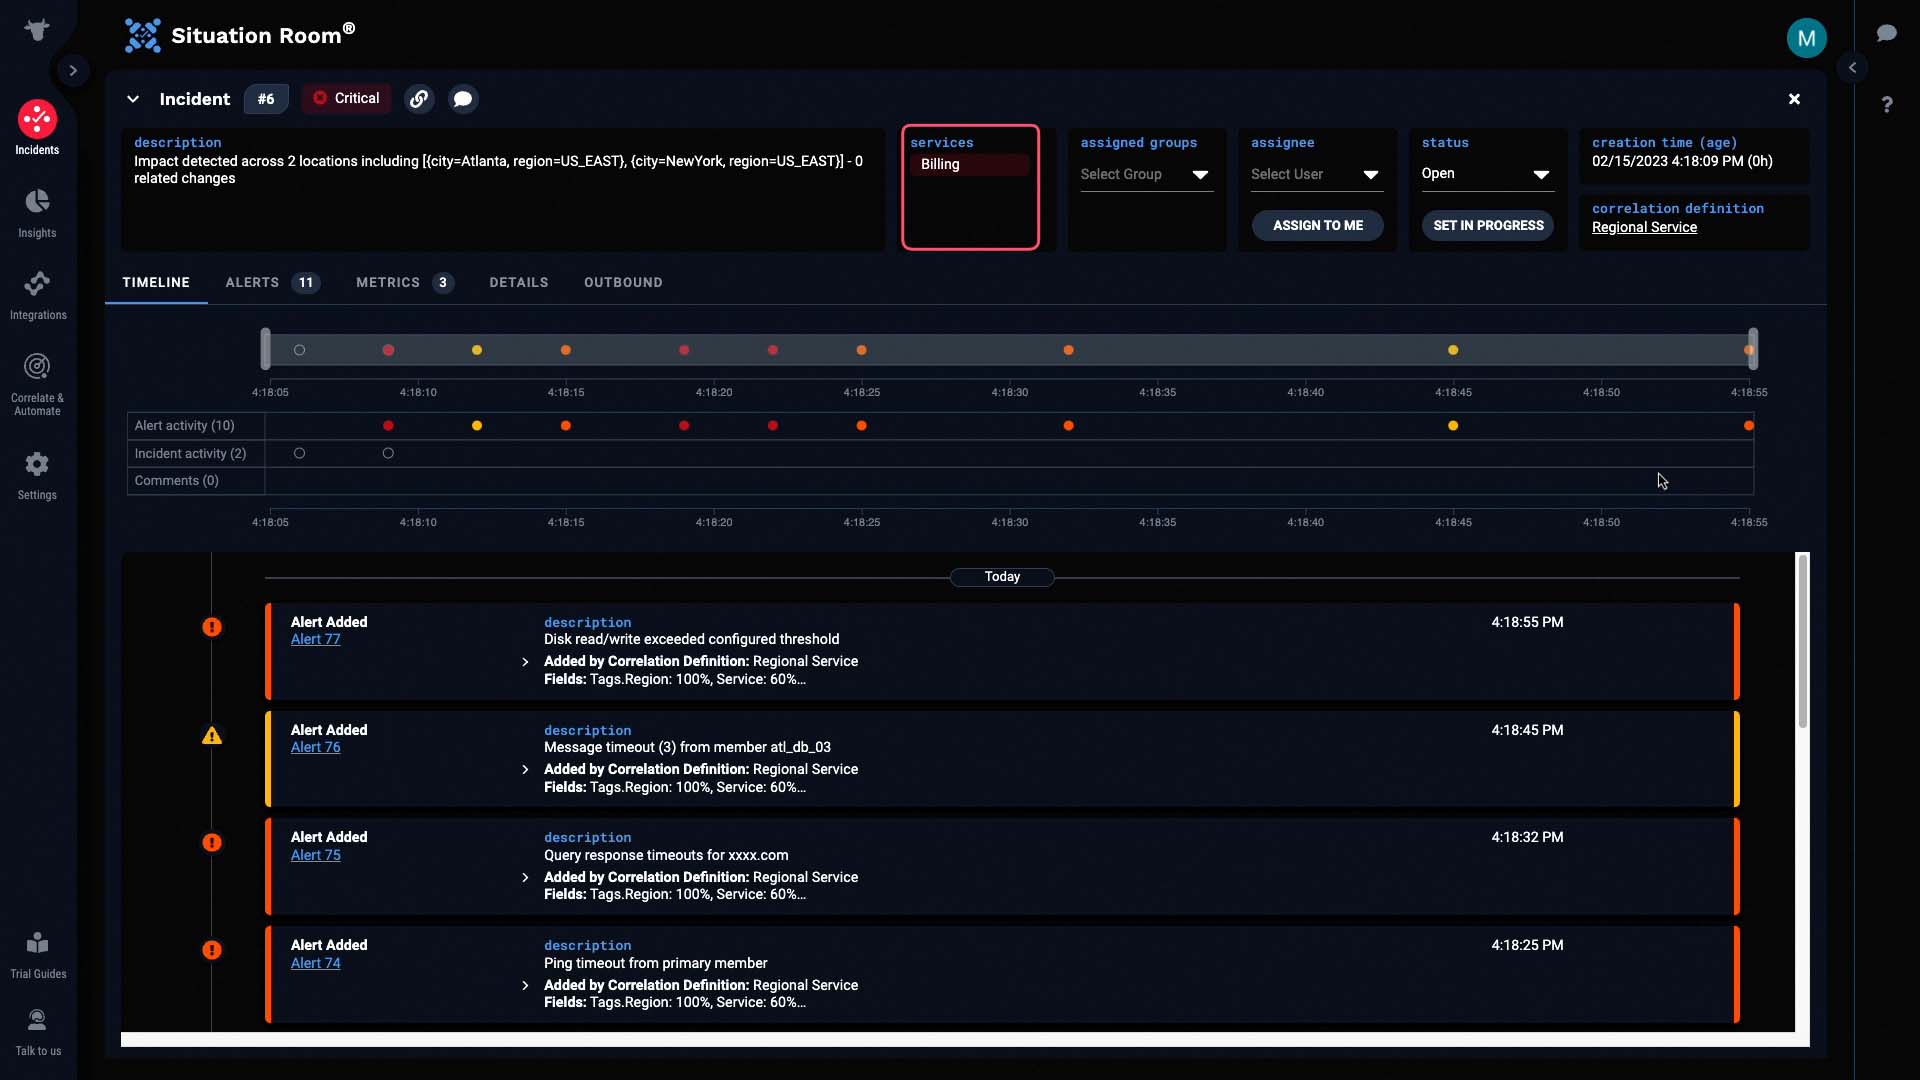
Let's go into the Situation room to discover more. The service impacted by this incident is Billing...
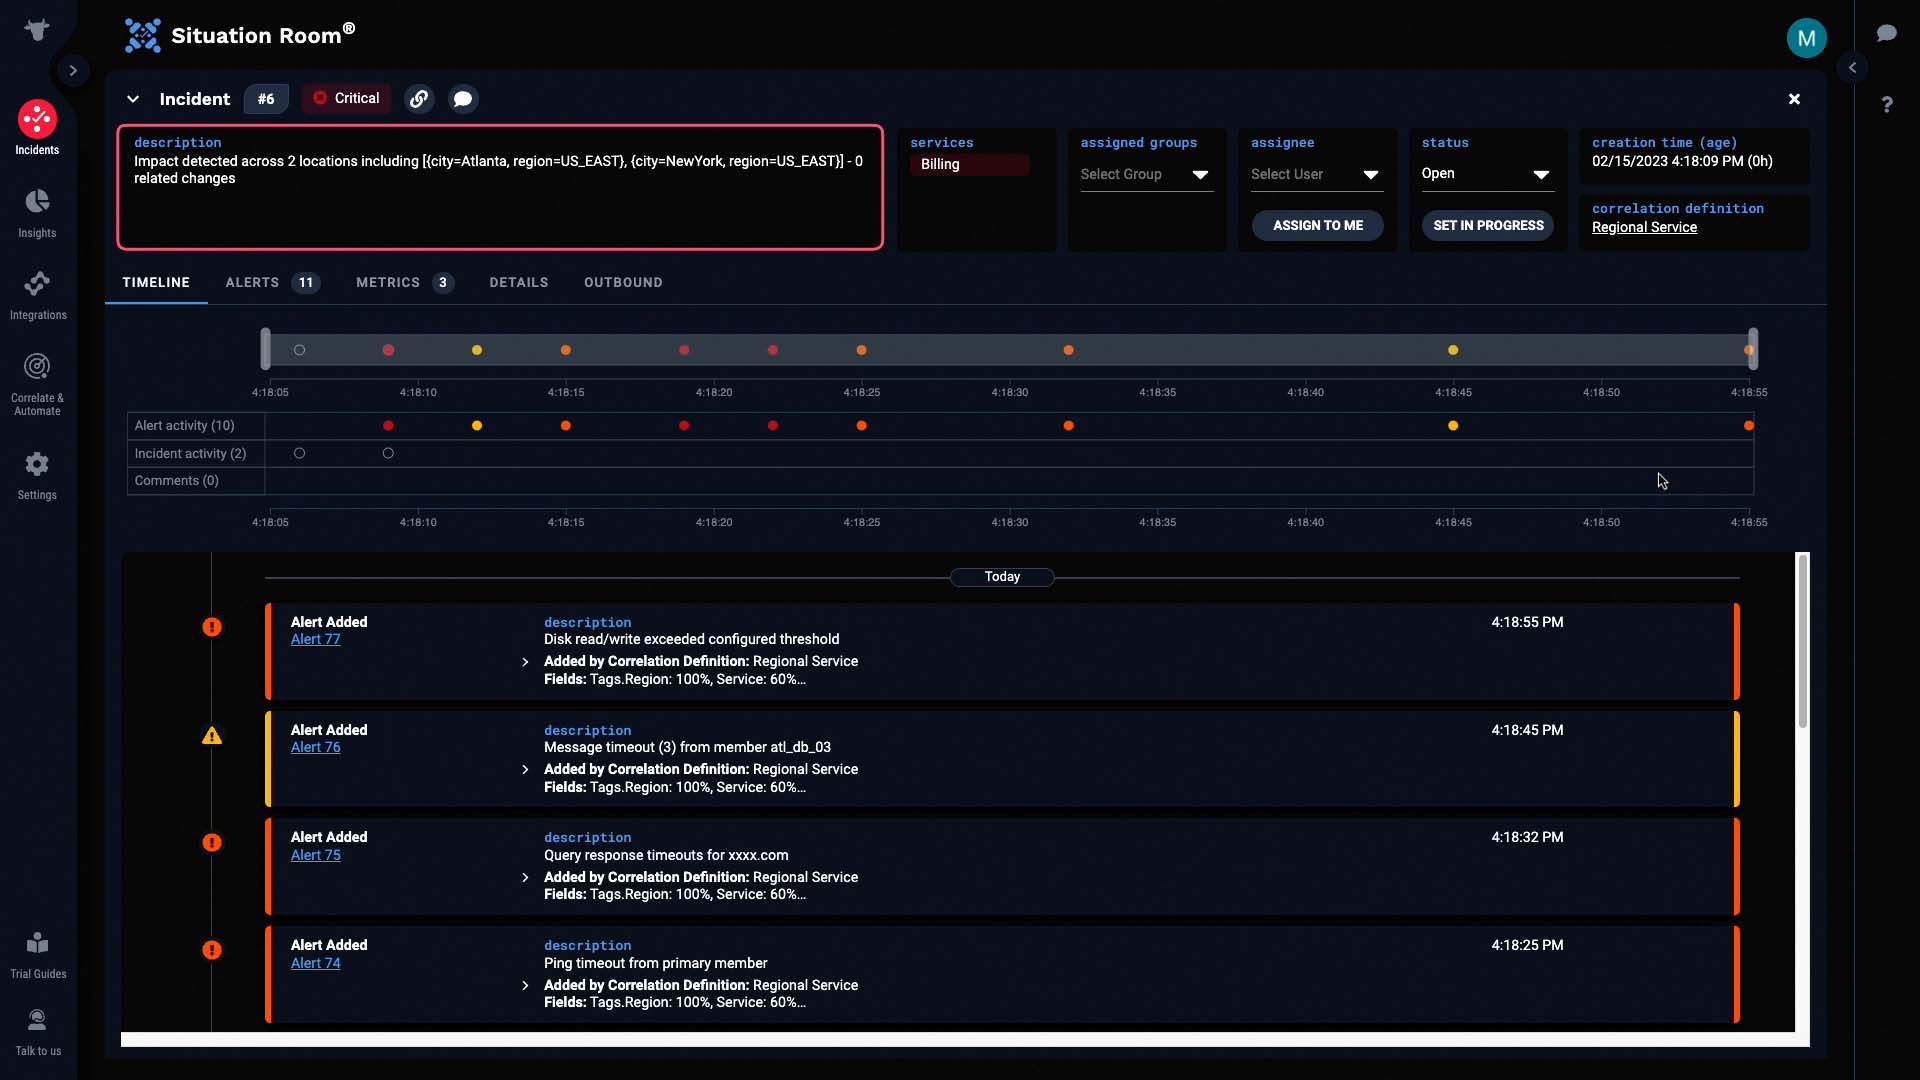
And the description has been dynamically populated to tell us the critical information - in this case, the locations affected by the incident.
And this incident contains 11 alerts. No doubt, these came from all four data sources.
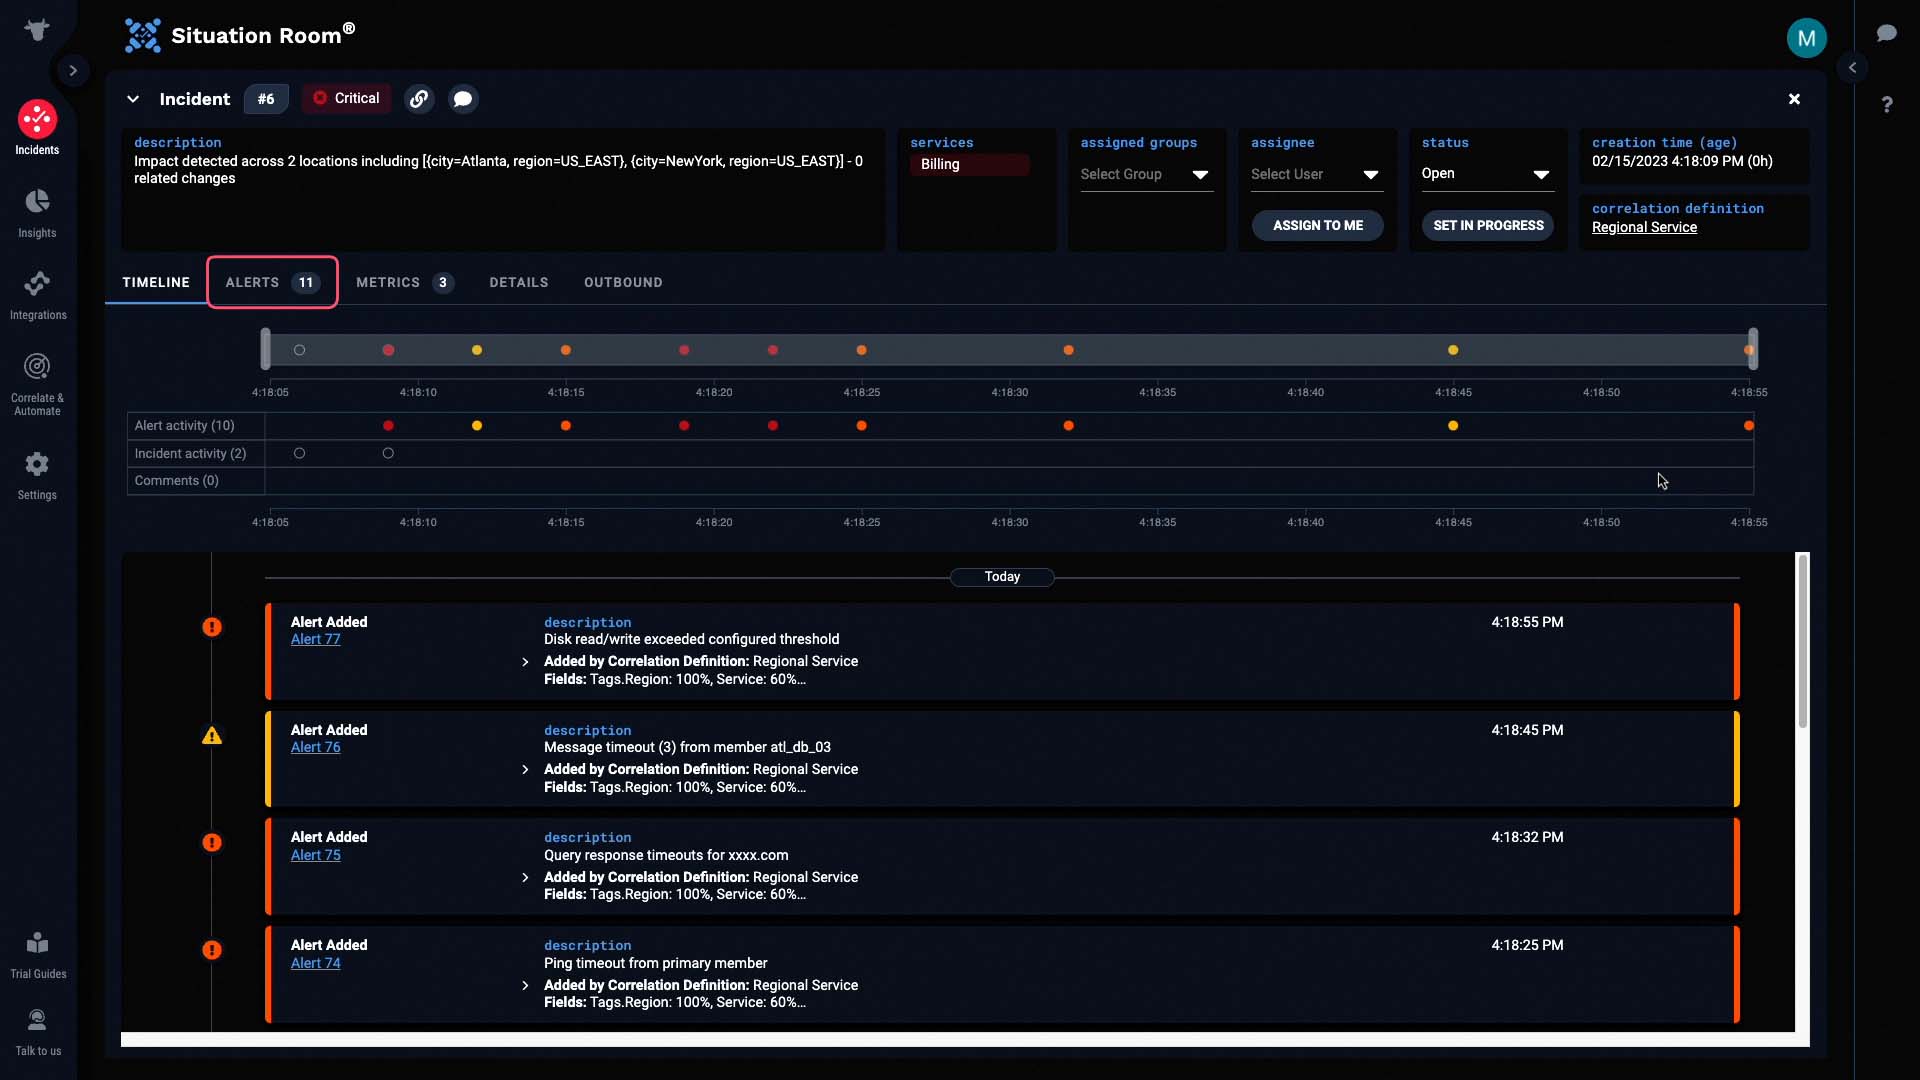
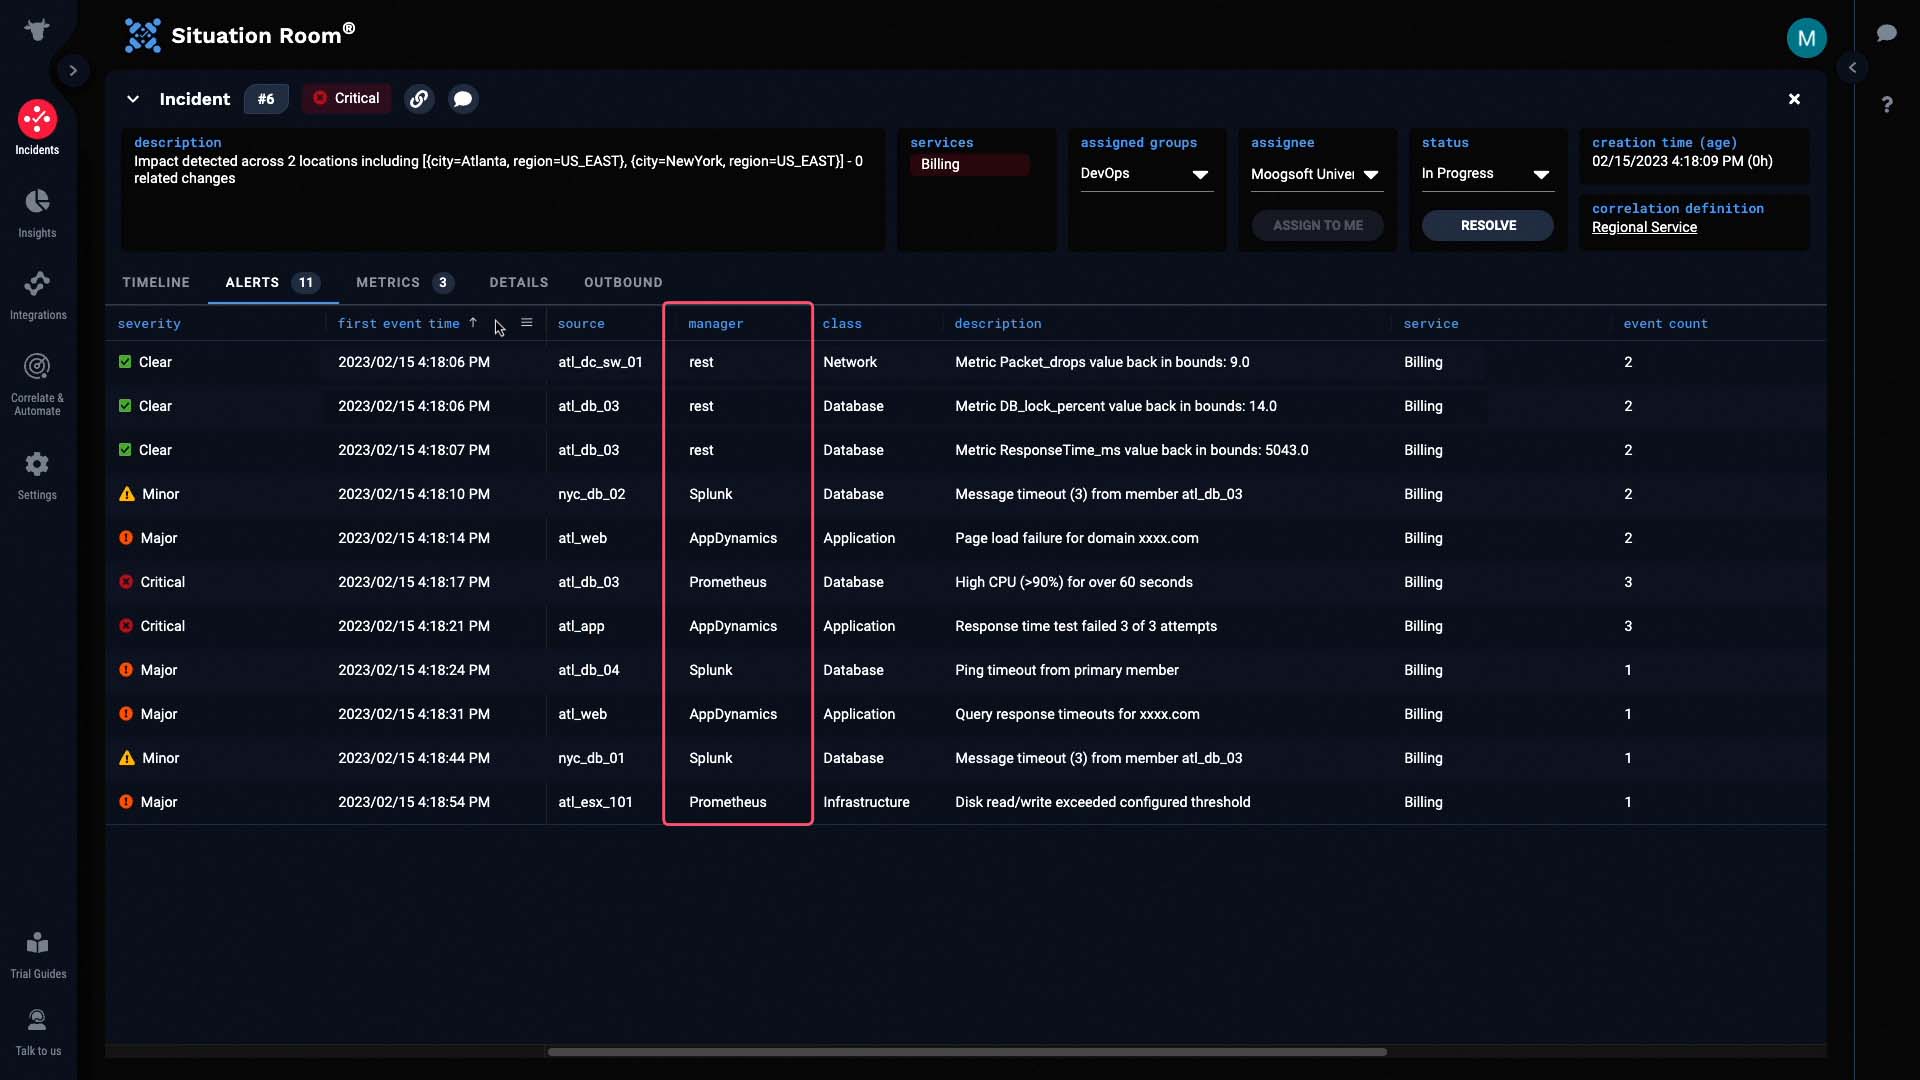
Sure enough, we got some application related alerts from AppDynamics, database alerts via Prometheus and Splunk, infrastructure alerts from Prometheus, and network alerts from the Metrics API. Such context helps us decide which teams in our organization we might want to engage.
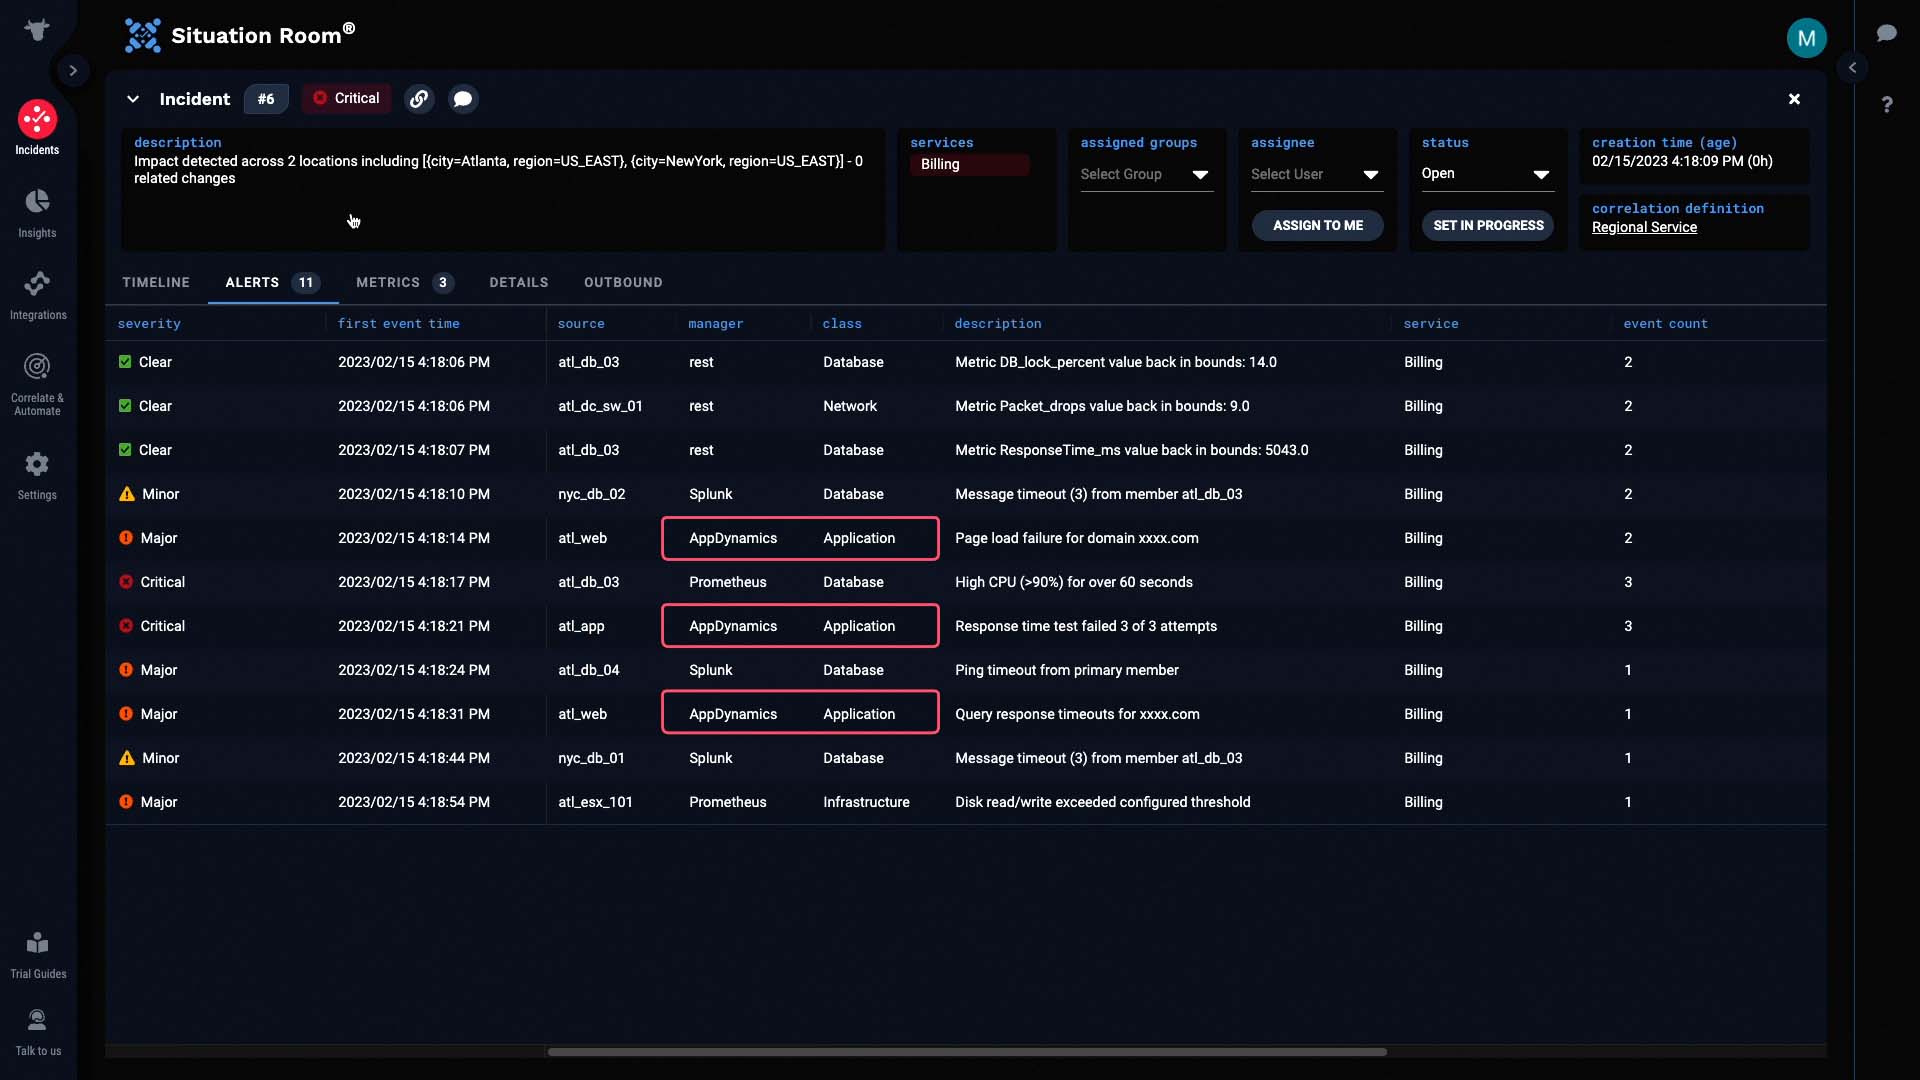
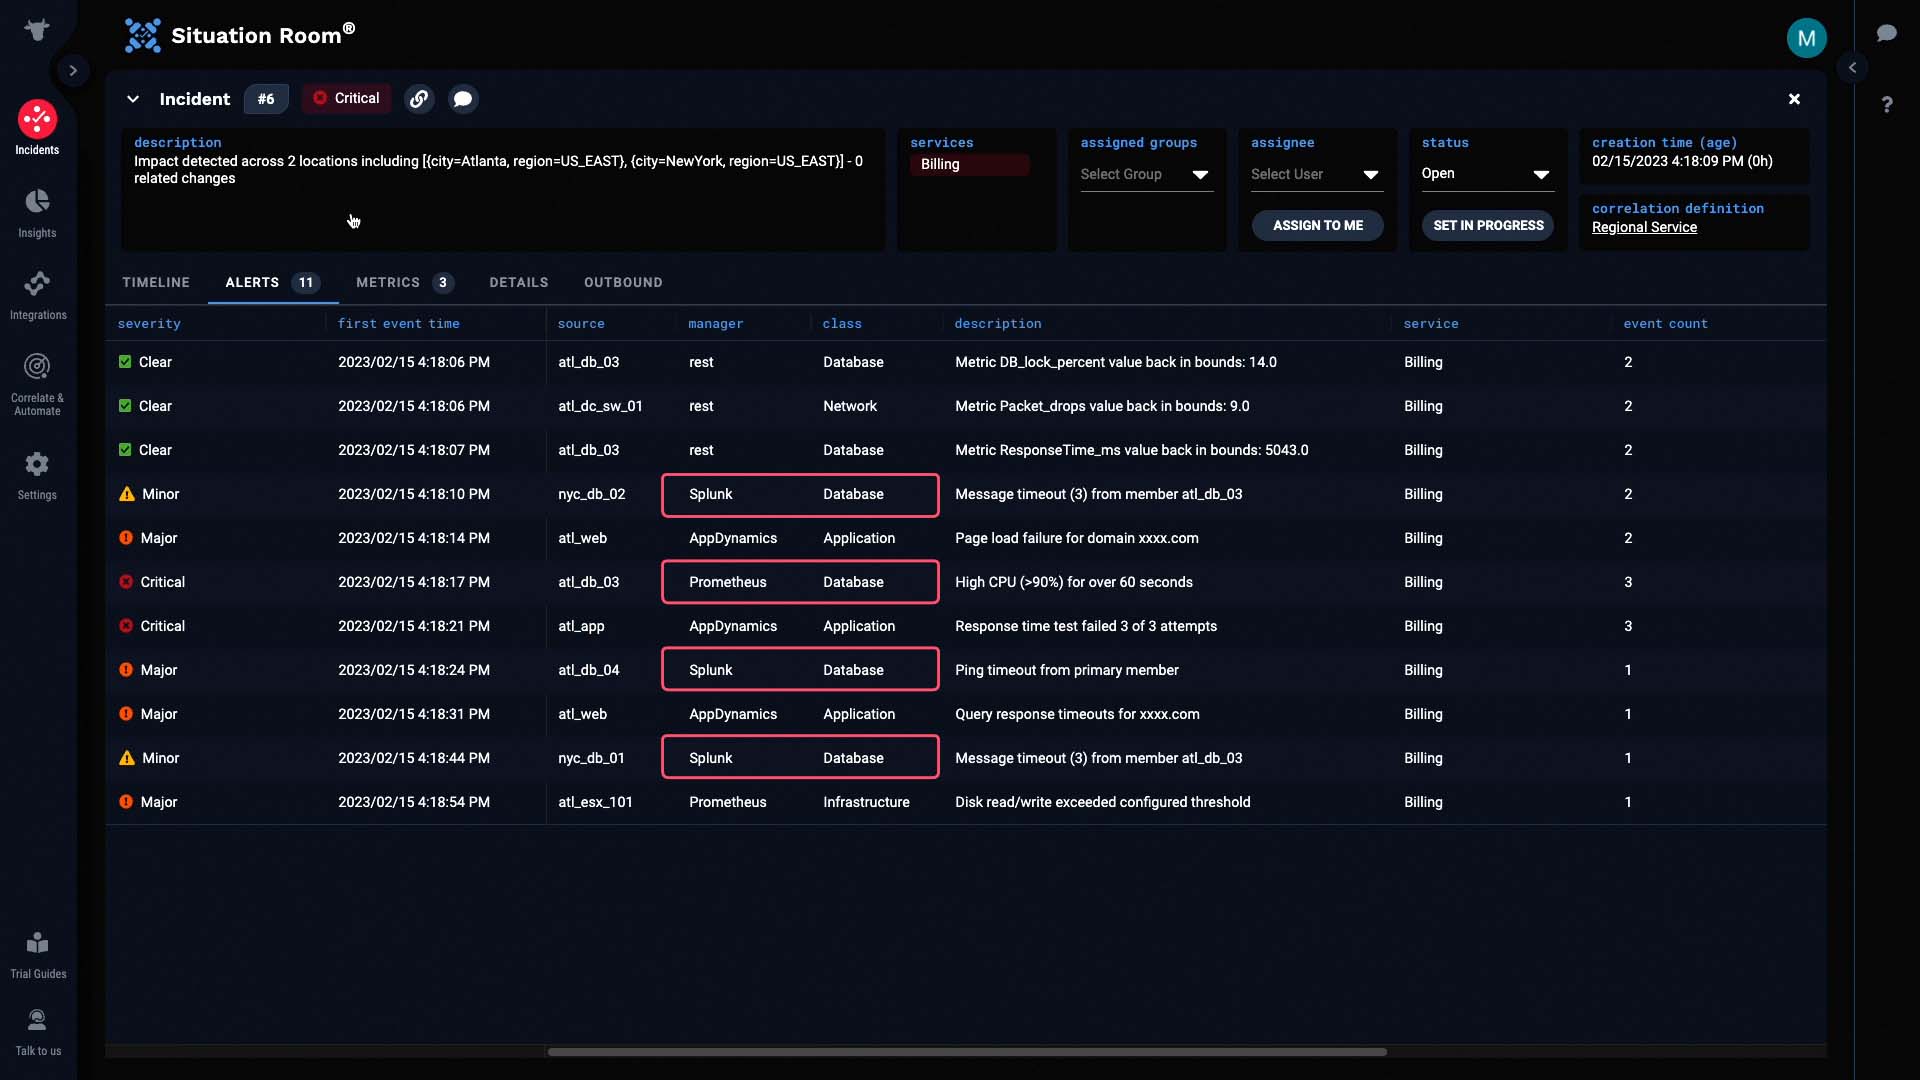
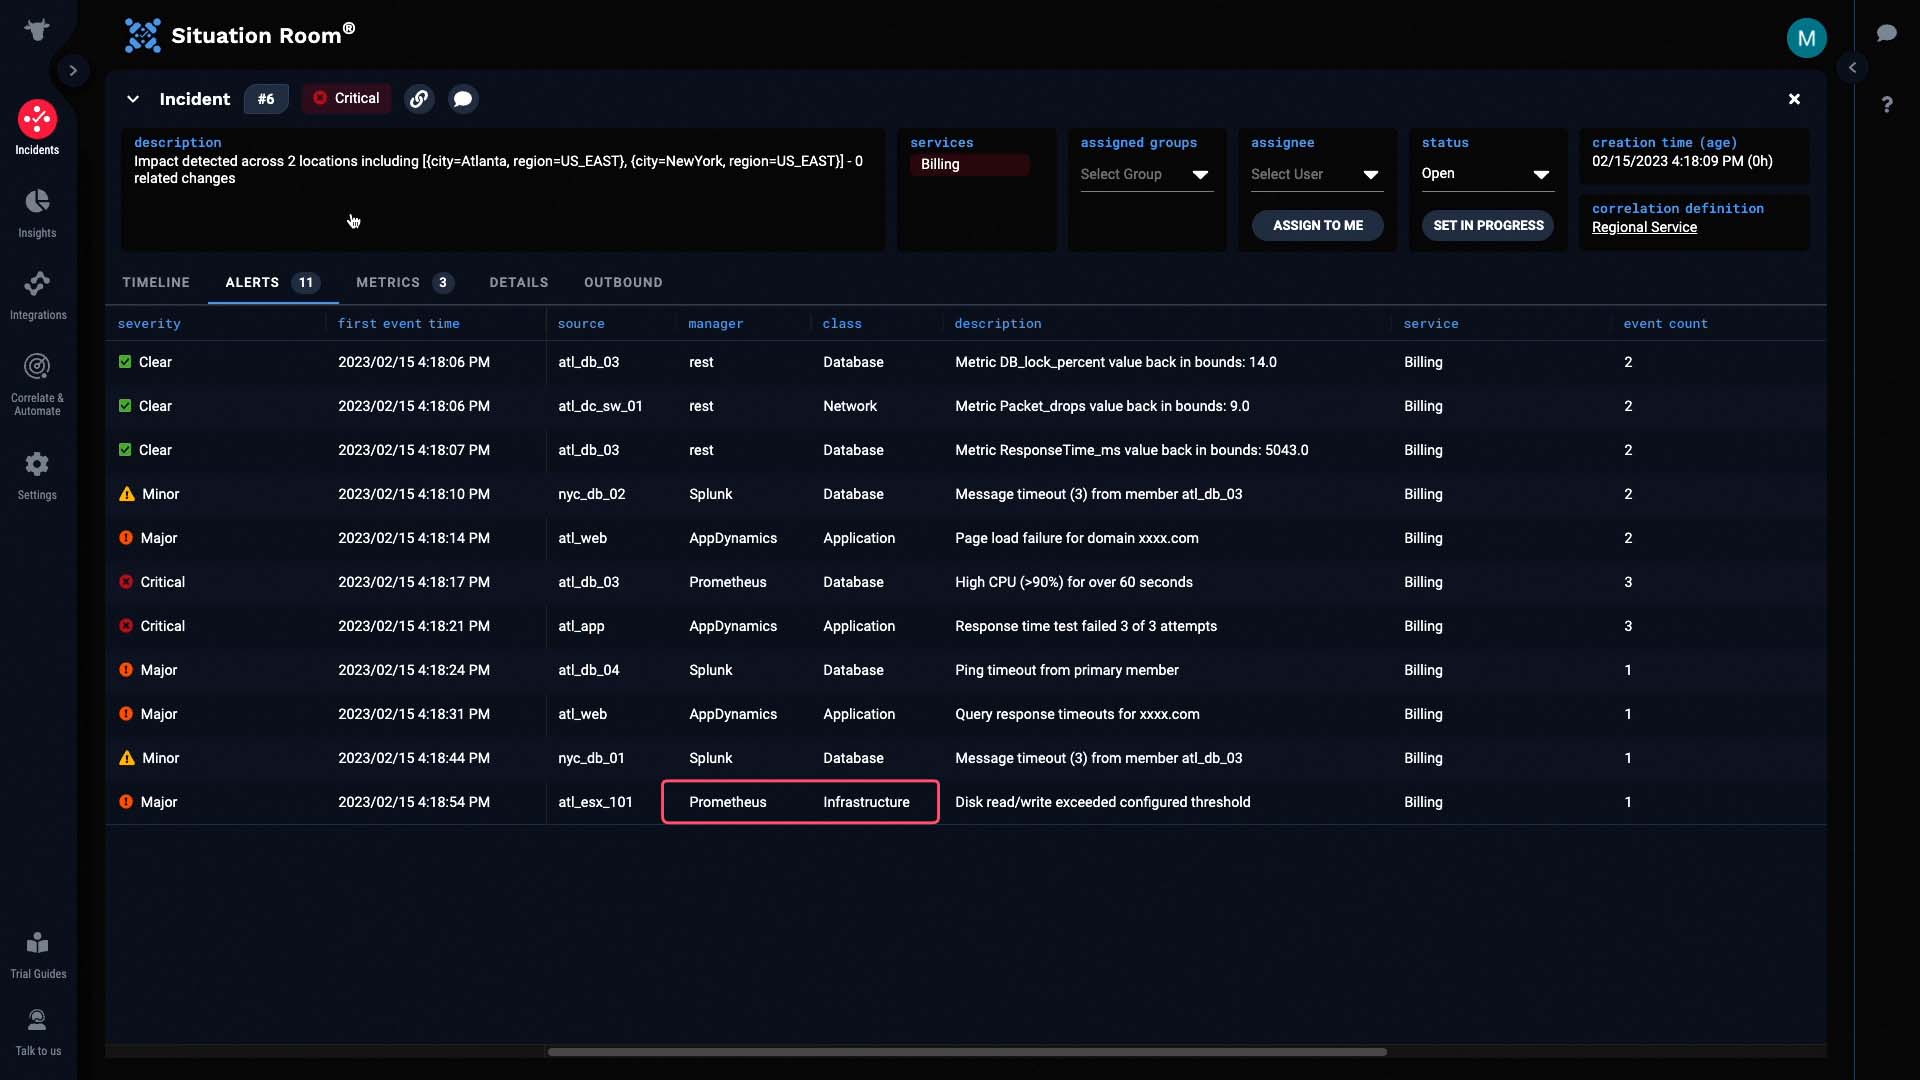
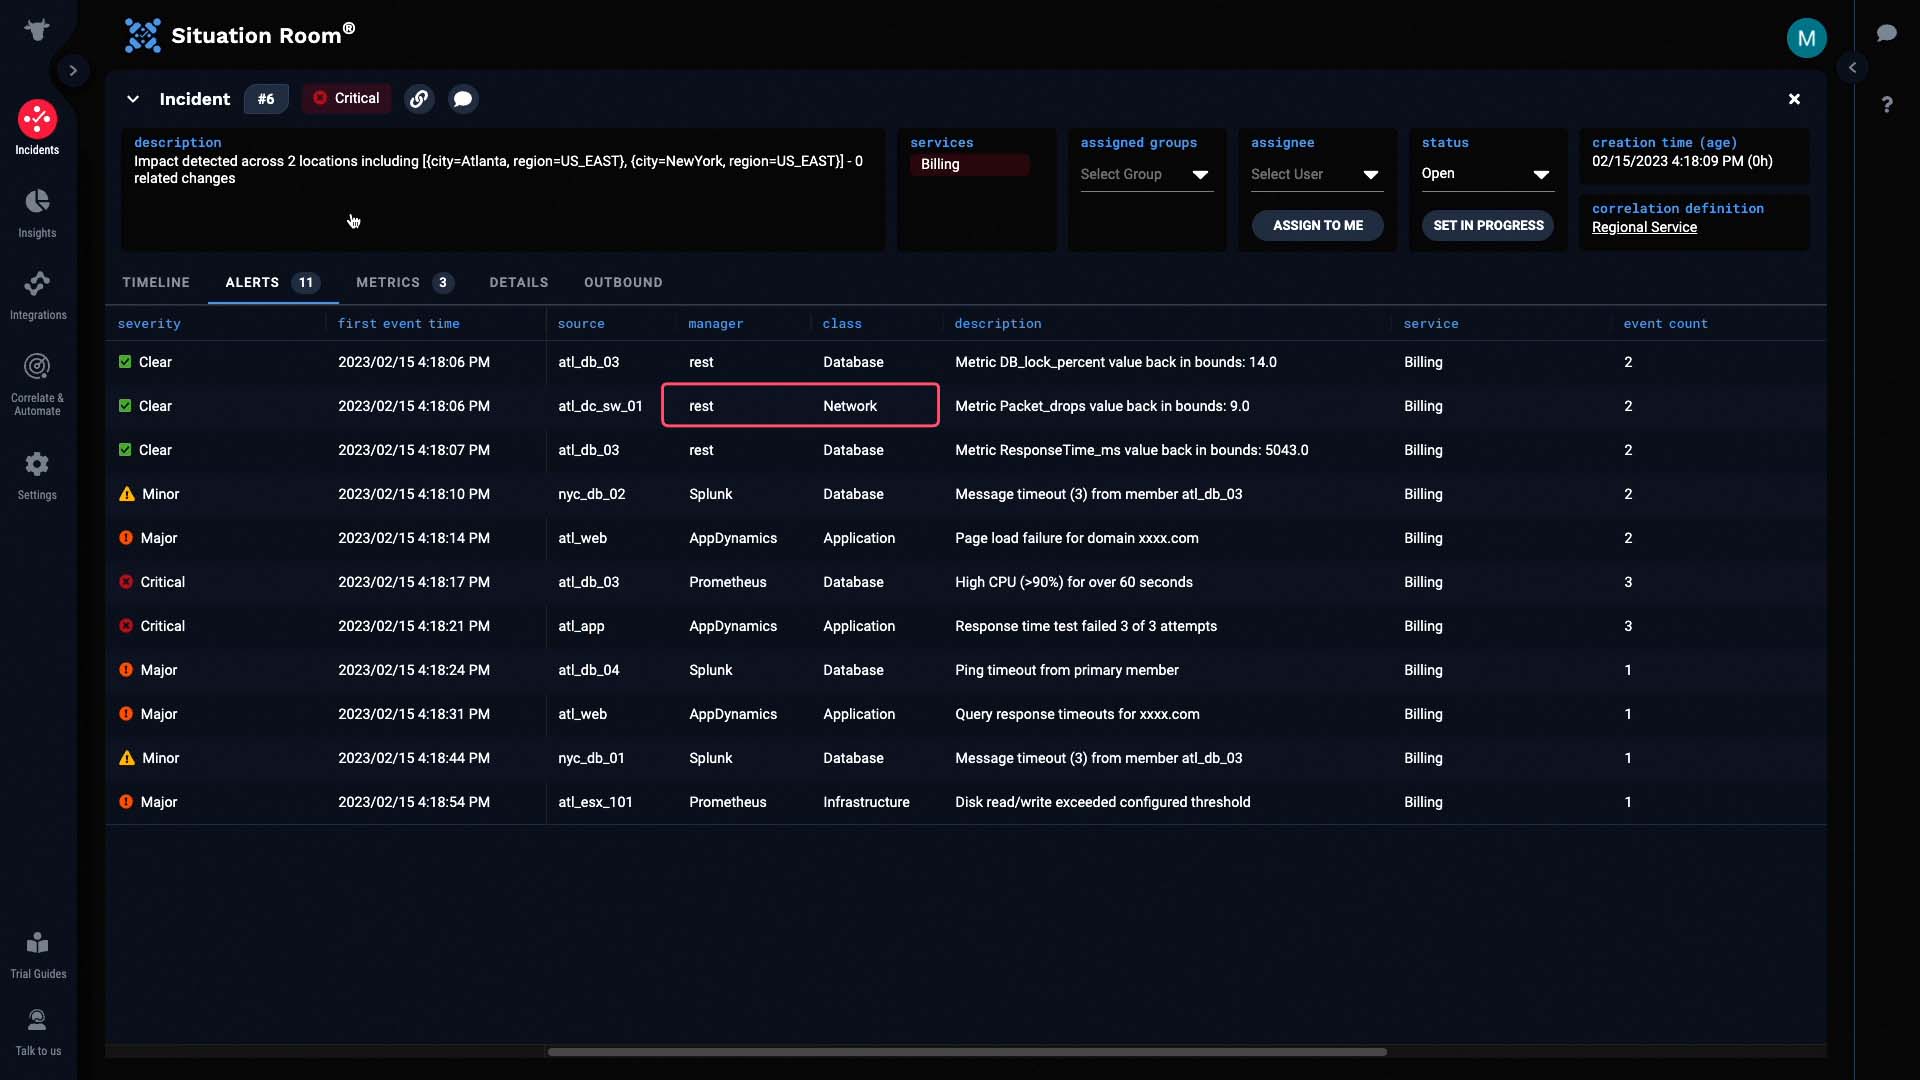
We are going to own this incident, and assign it to our group.
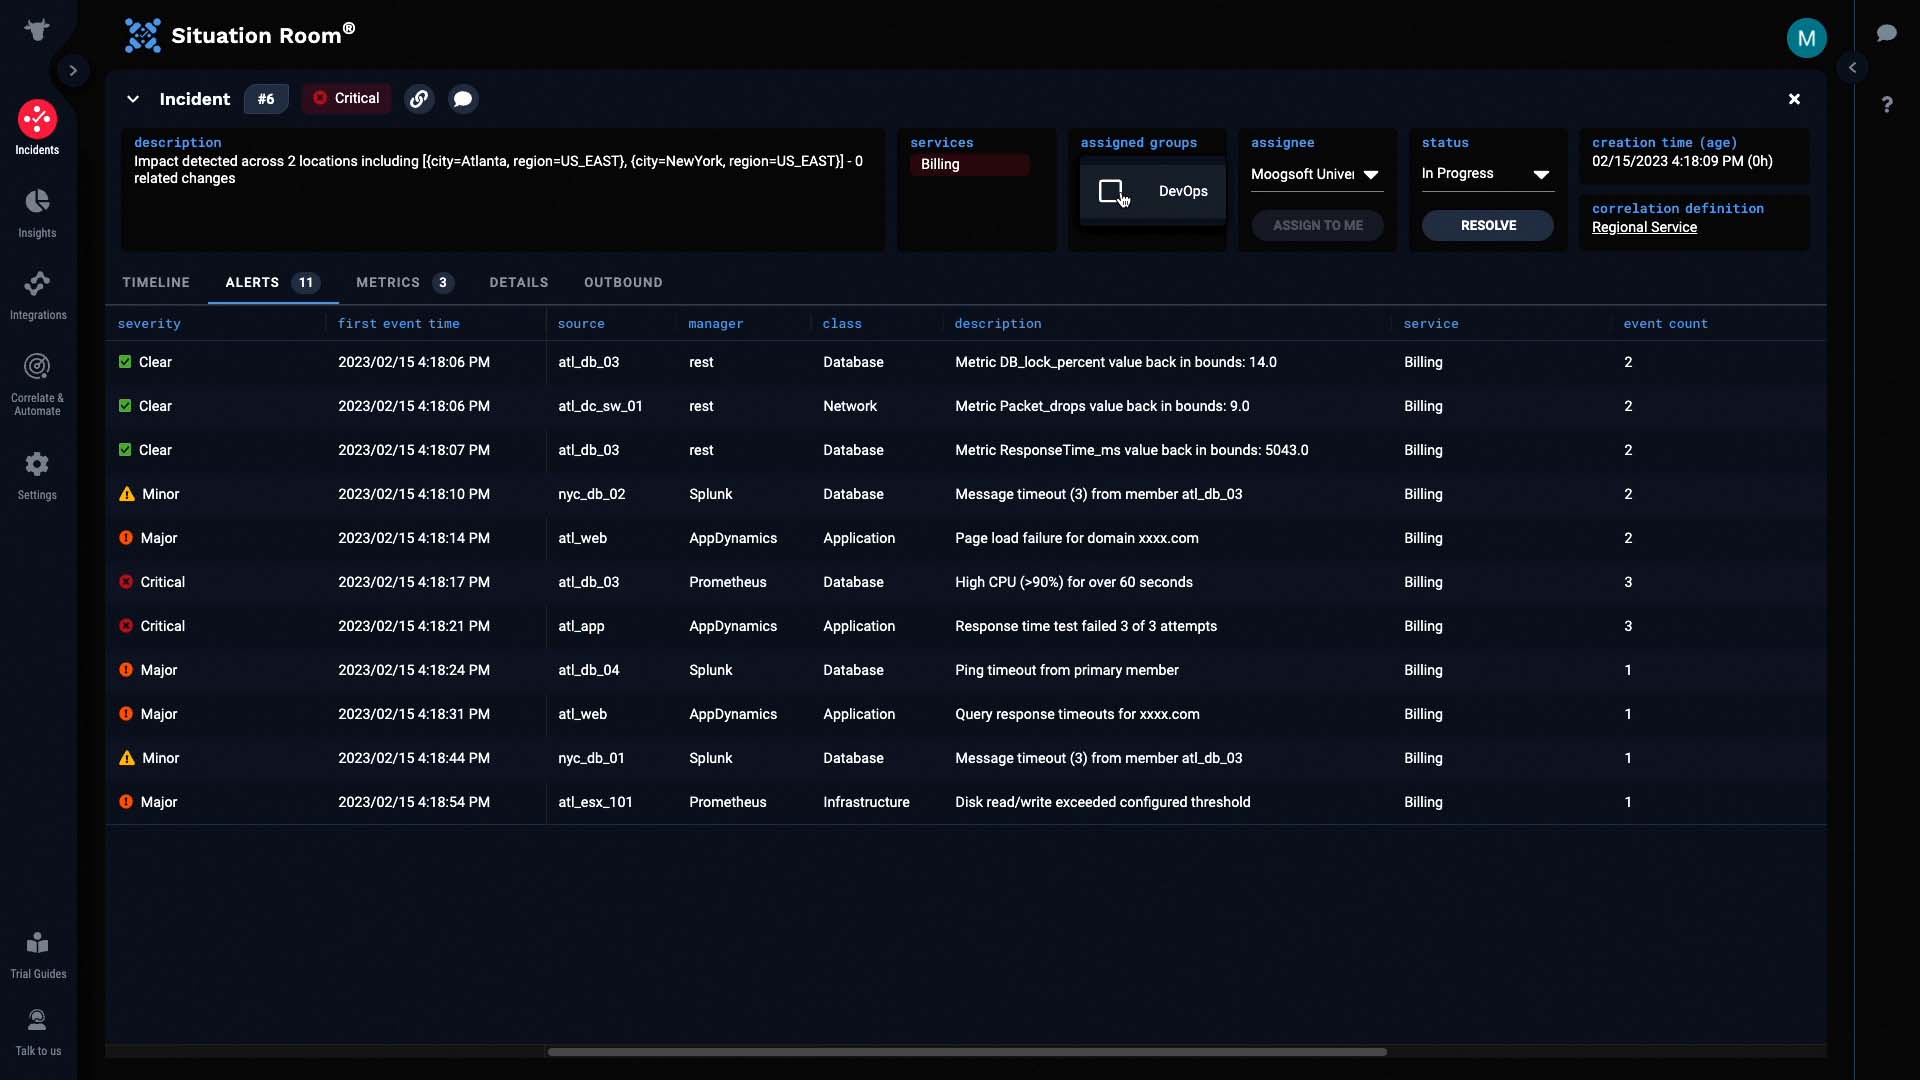
Now let’s examine the alerts.
We’ll sort these alerts by First Event Time so we can see how the issue started, and how it evolved.
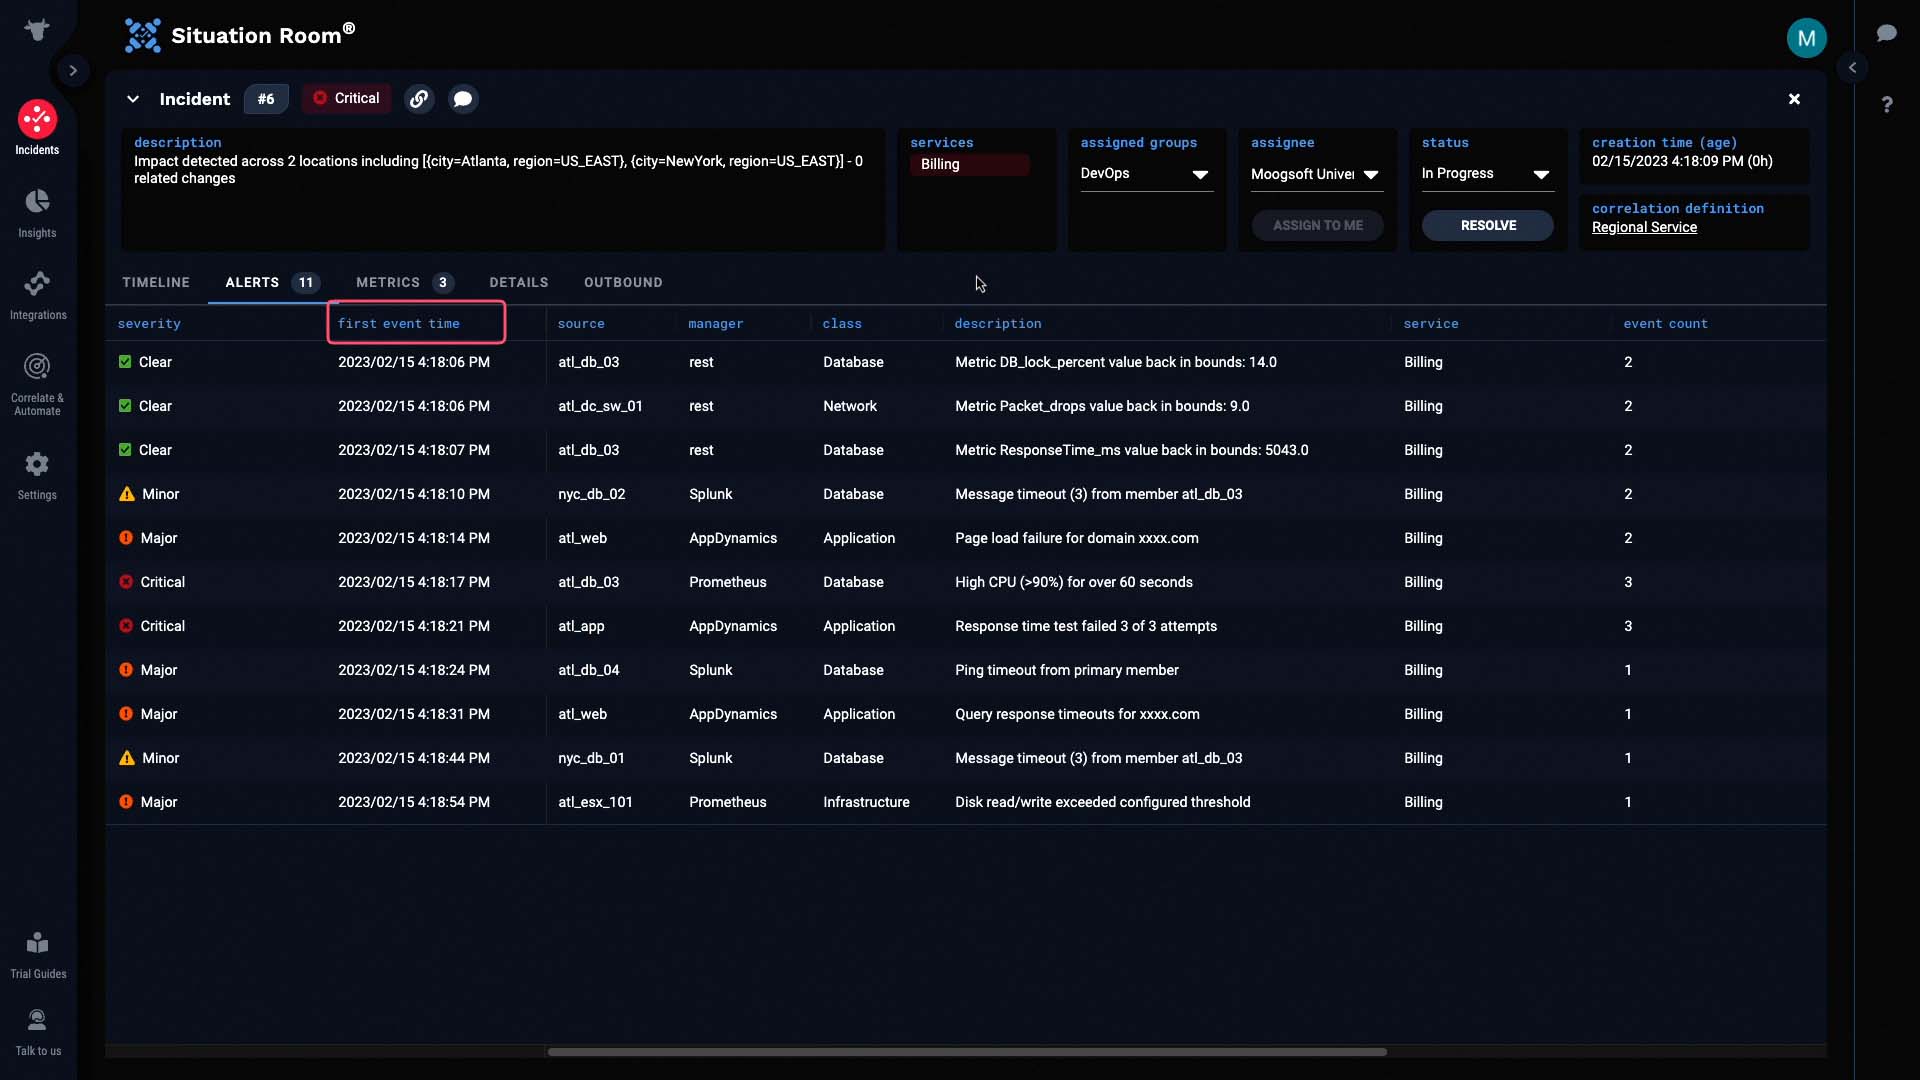
You can see in the Manager column how this incident combines alerts from four different data sources.
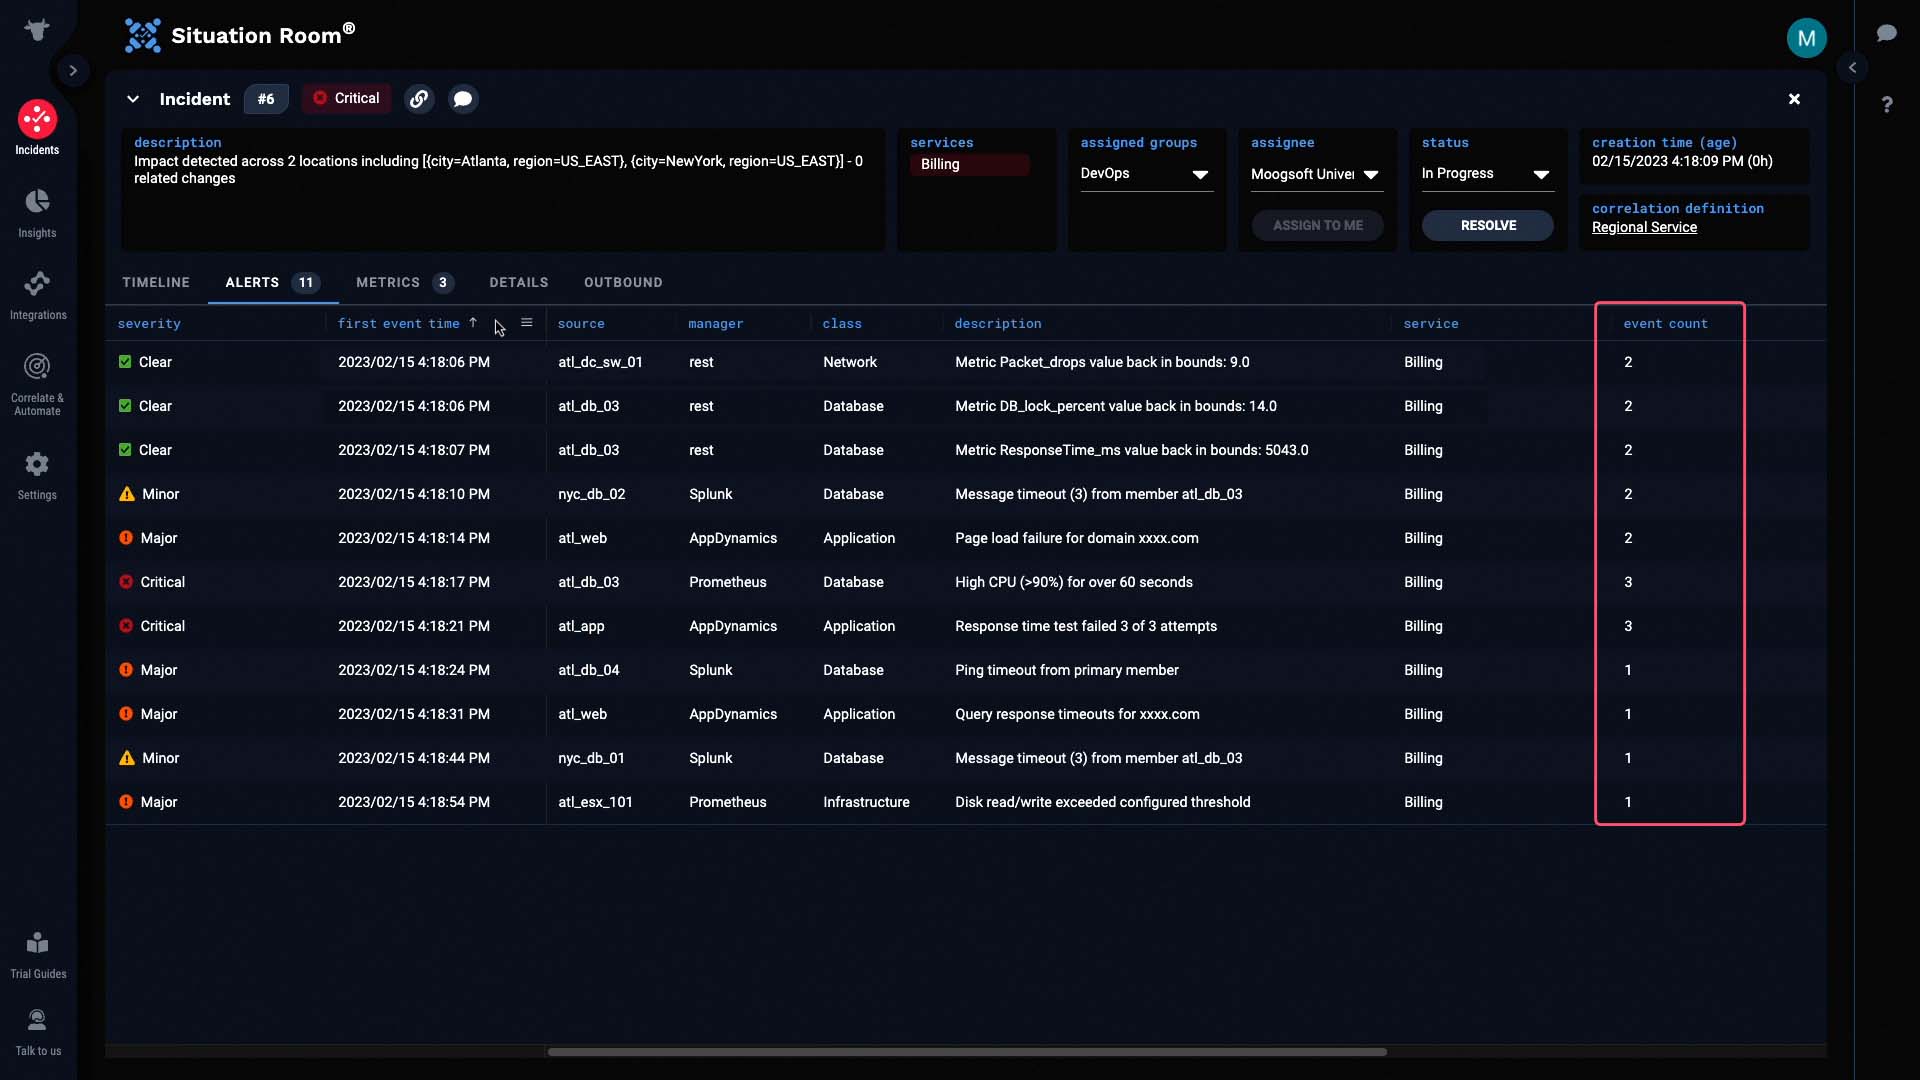
And under event count, you can see how Incident Management provides noise reduction by deduplicating events into alerts.
Now let’s look at the individual alerts.
The very first alert came from a switch in the Atlanta data center. It looks like the packet drops went out of bounds.
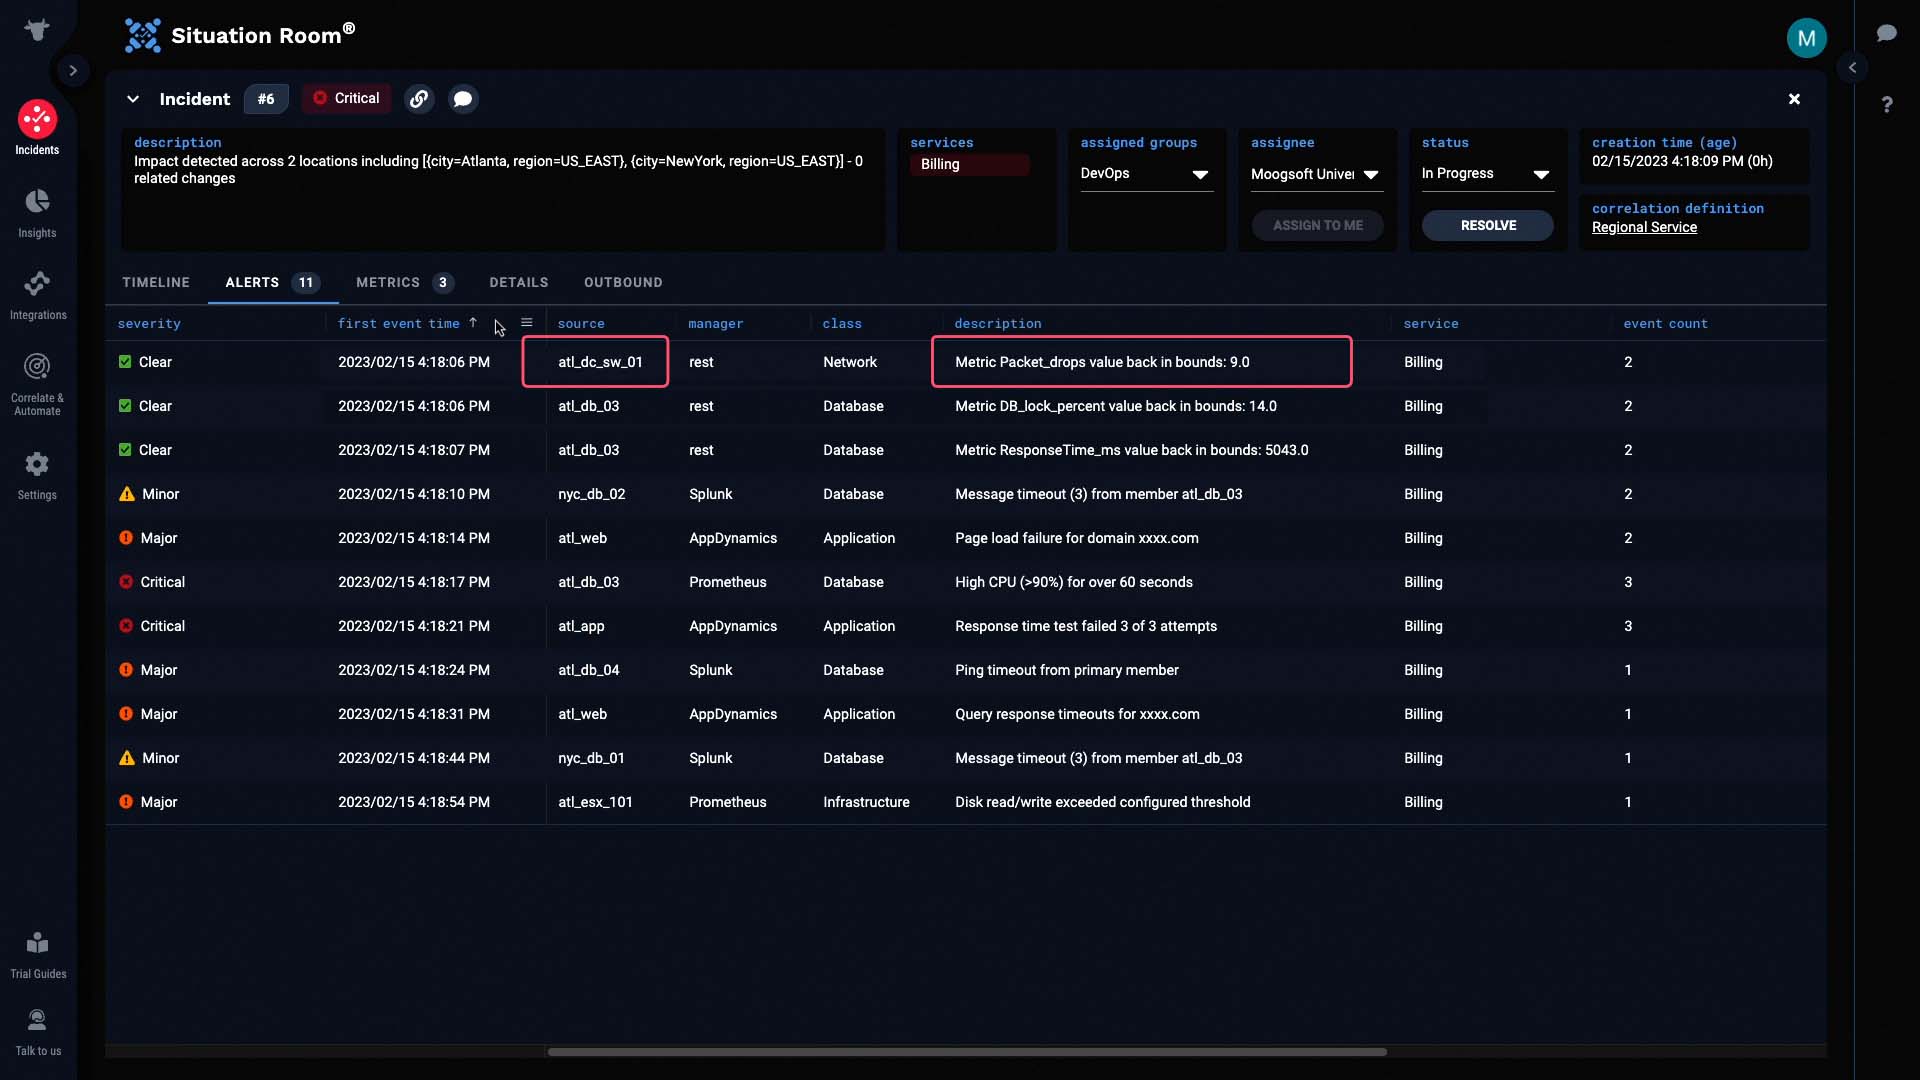
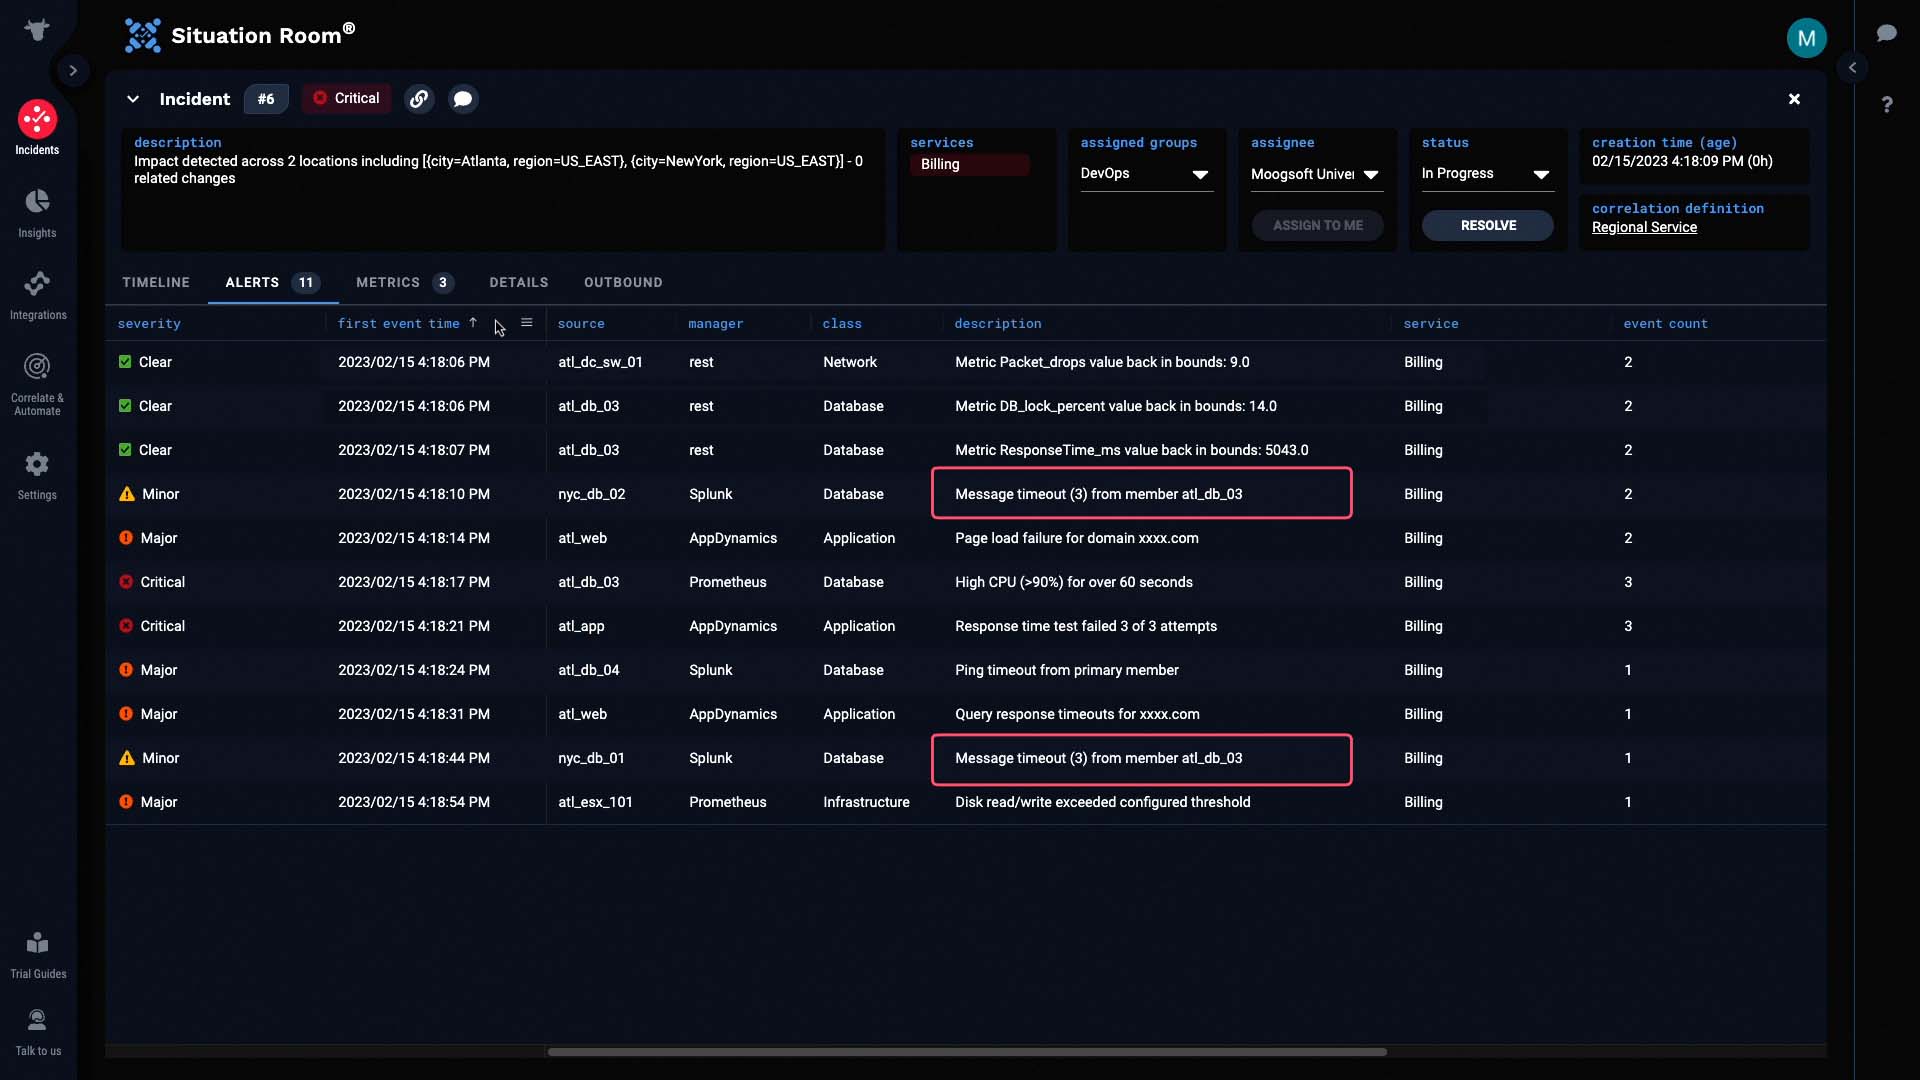
Only a few seconds after this alert was created, we began receiving additional alerts about database timeouts...
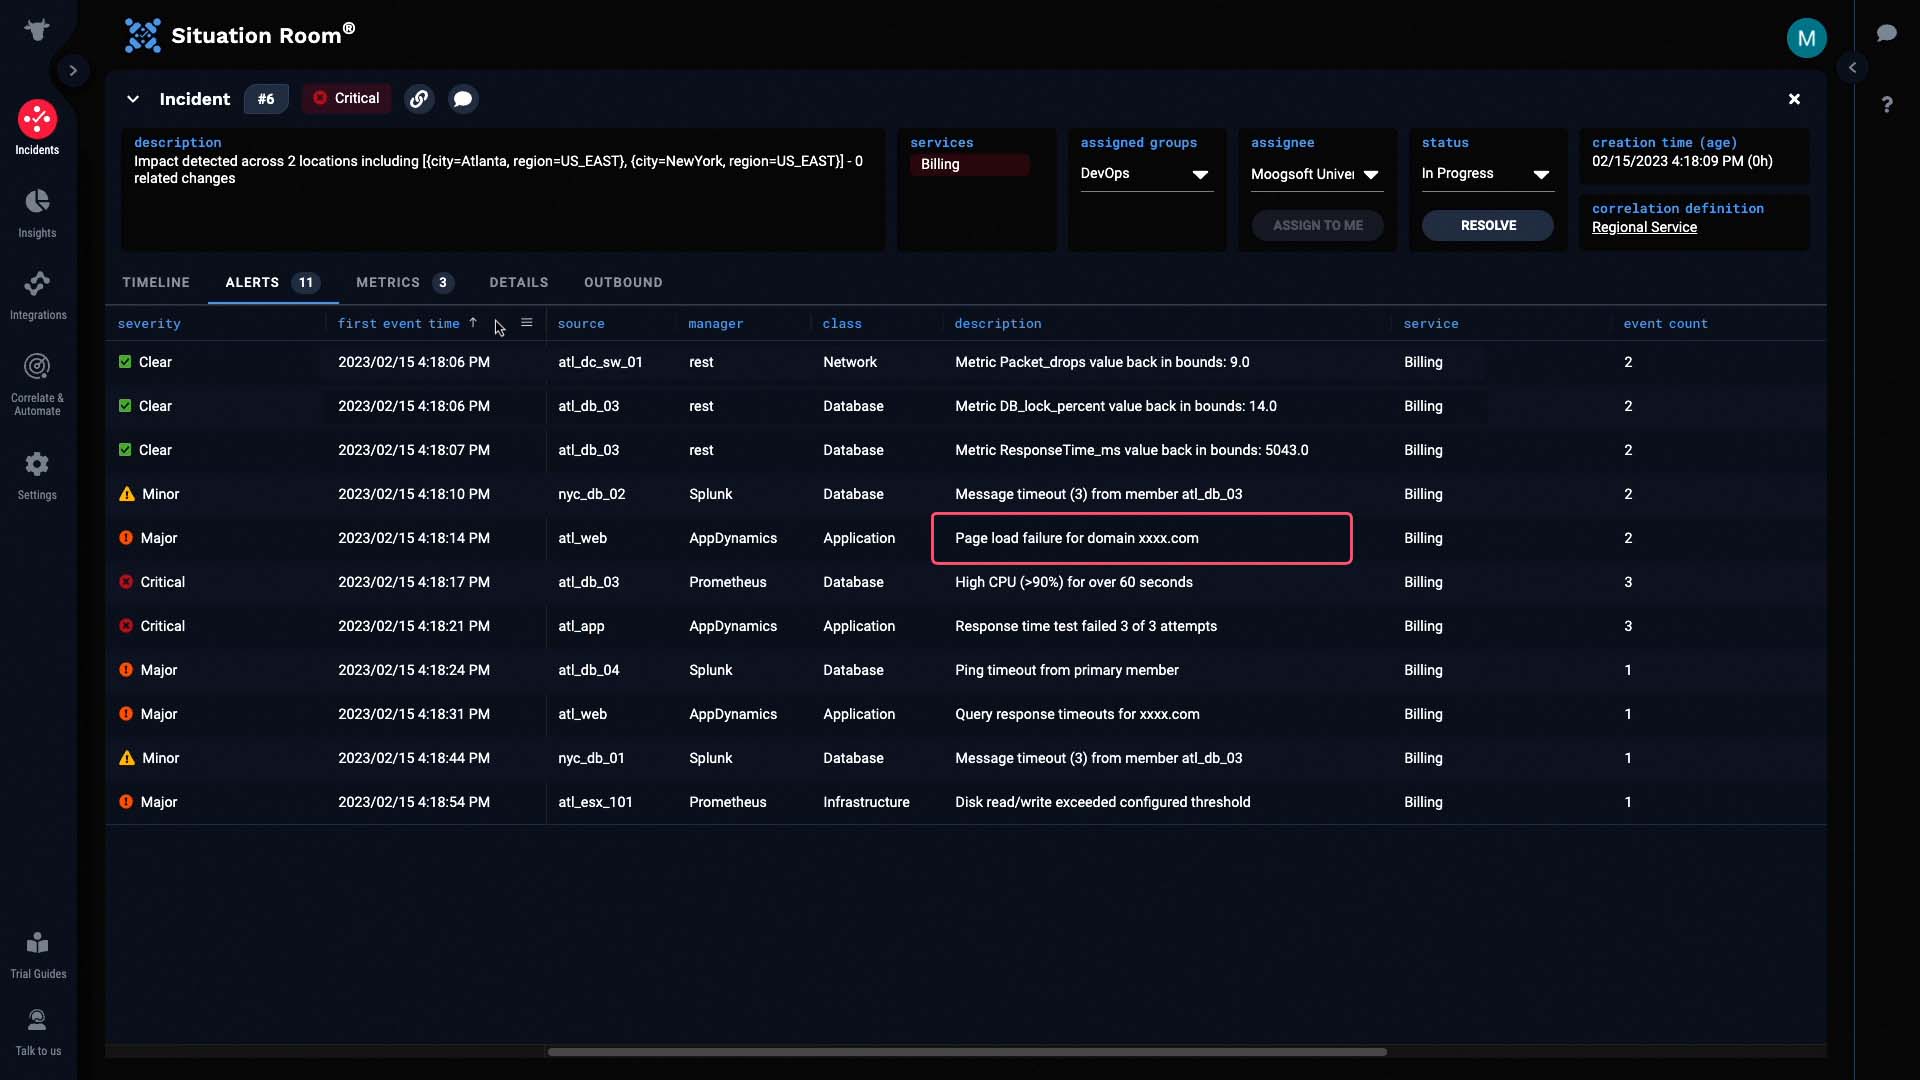
Application page load failures...
And various other issues.
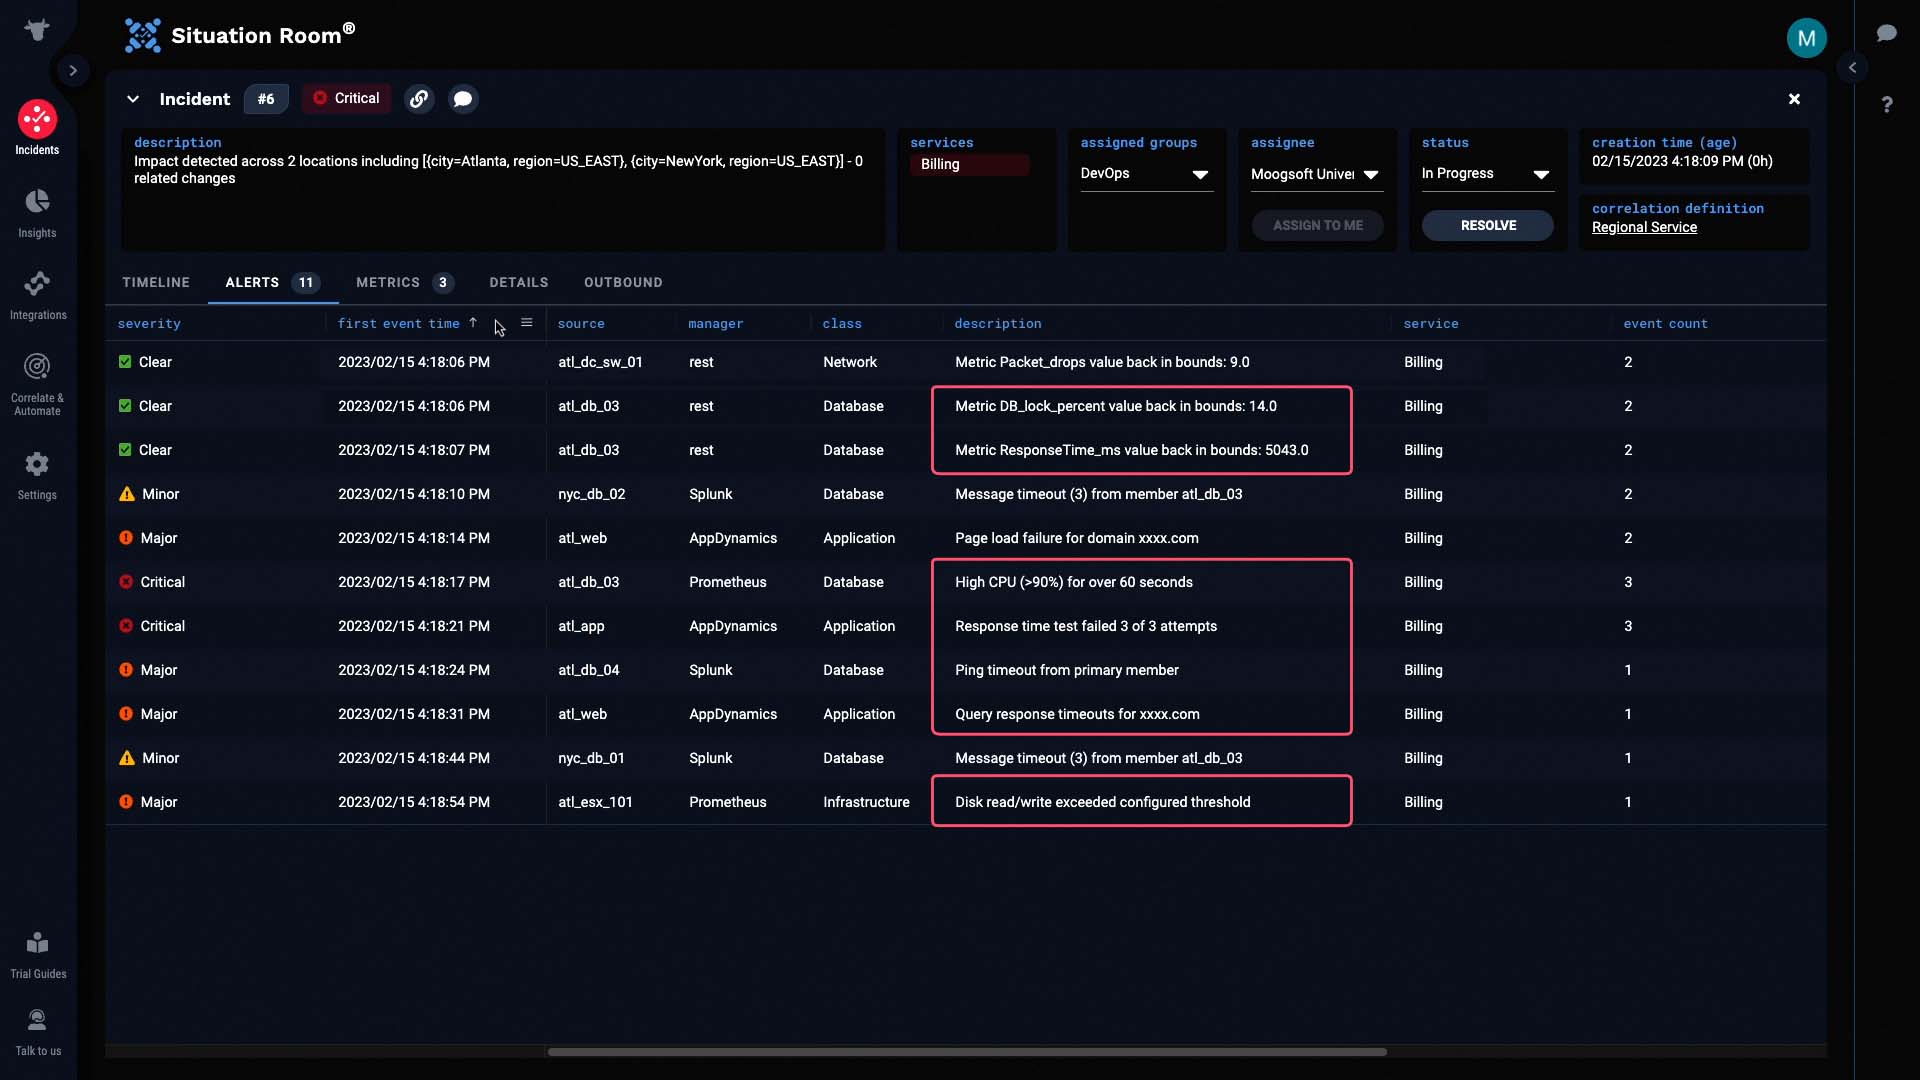
So from this, it seems that the packet drop alert might be the root cause behind this incident.
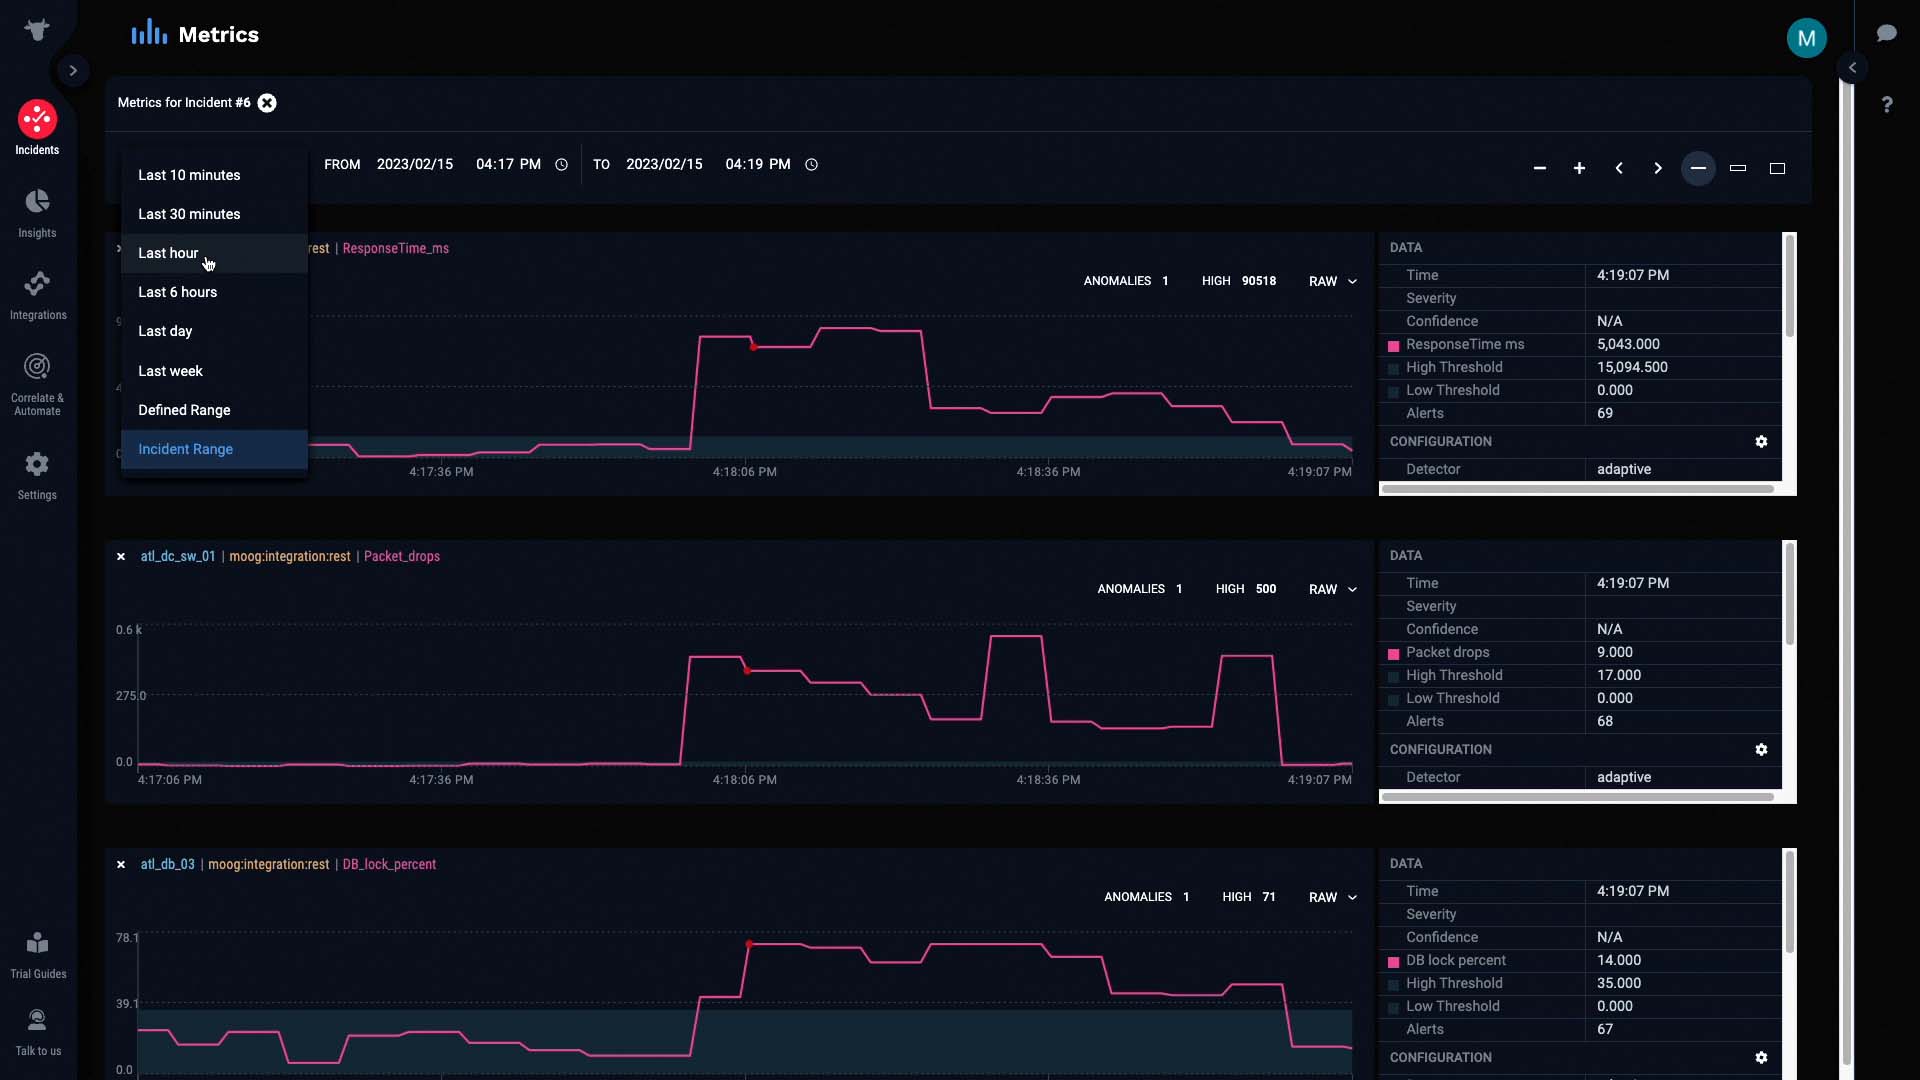
Let’s do some further investigation by looking at the metrics for this incident. We’ll only examine relevant data from the past hour.
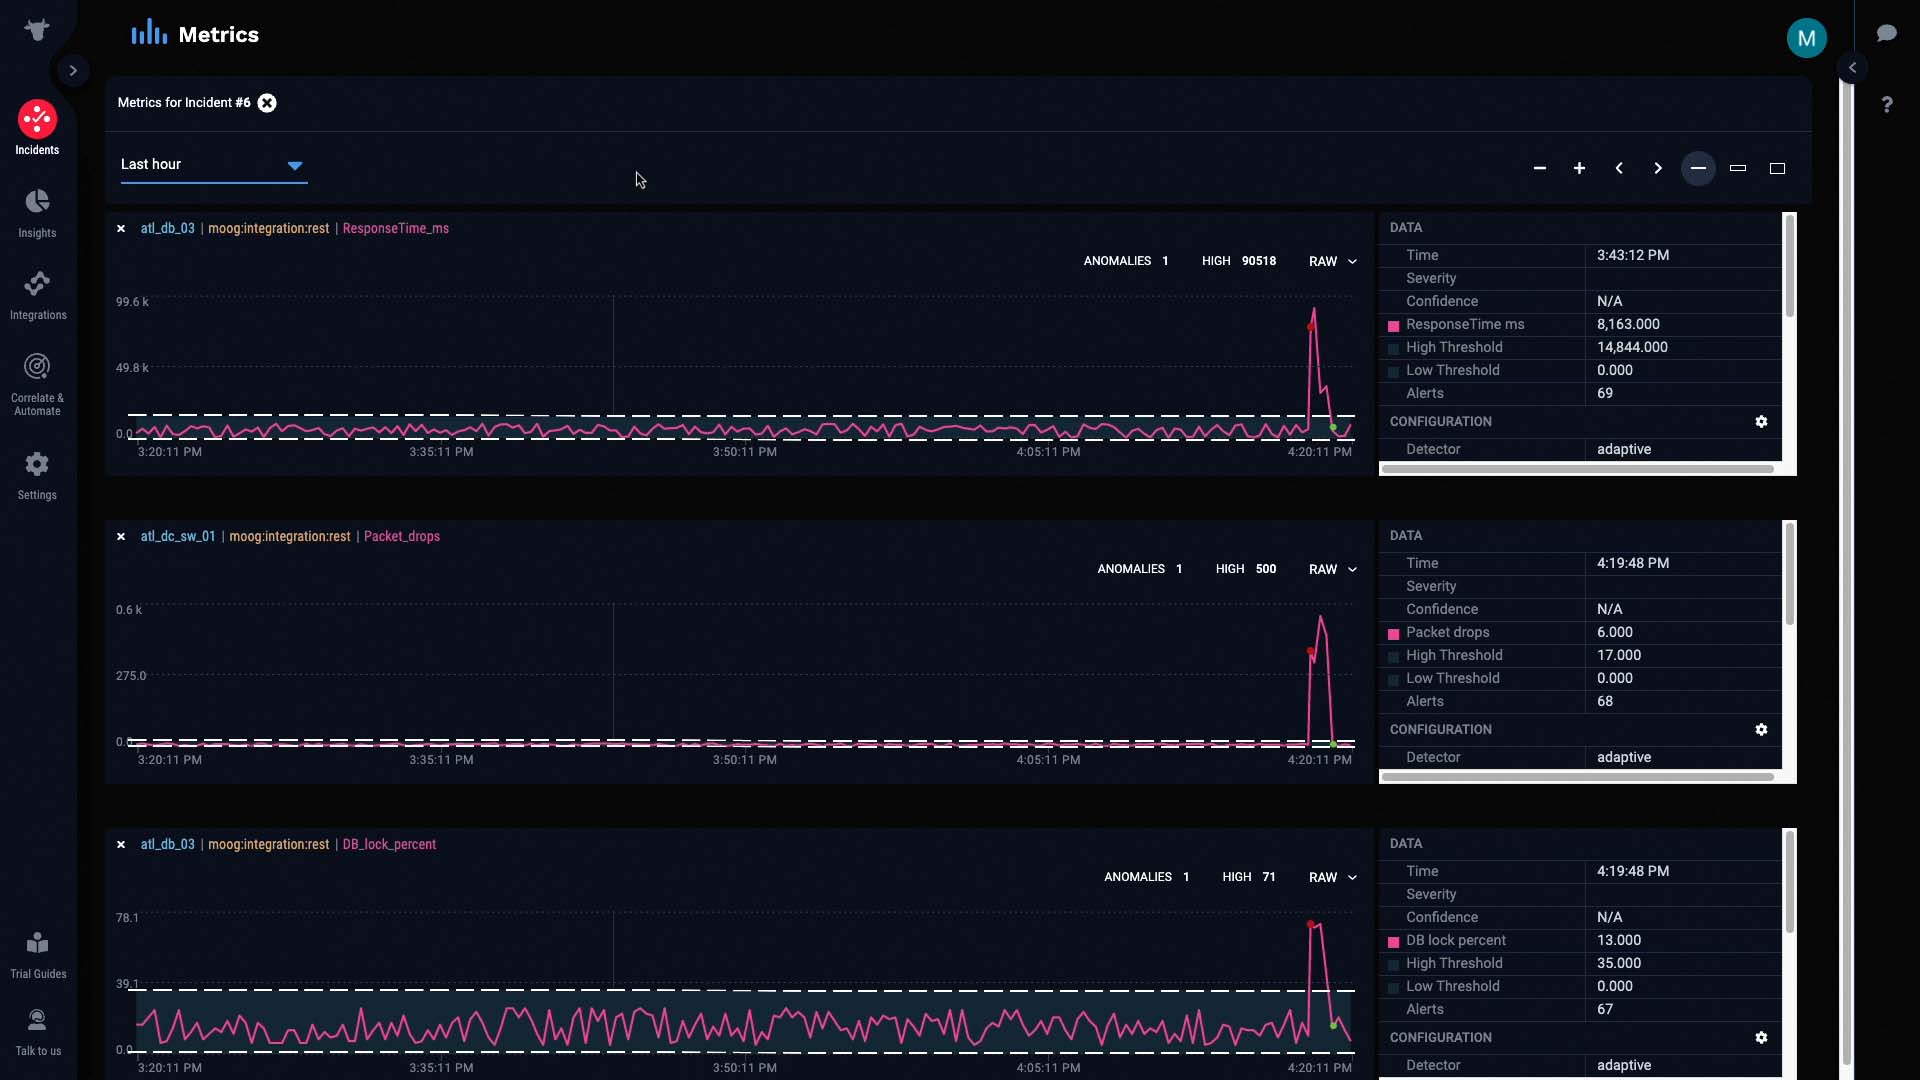
For each of these metrics, the pink line represents the raw values of the metric at any given interval. The light gray band in the background represents the normal operating range of the metric, as calculated by Incident Management.
And these colored dots represent anomalies in the metric that Incident Management has detected and classified, in terms of significance.
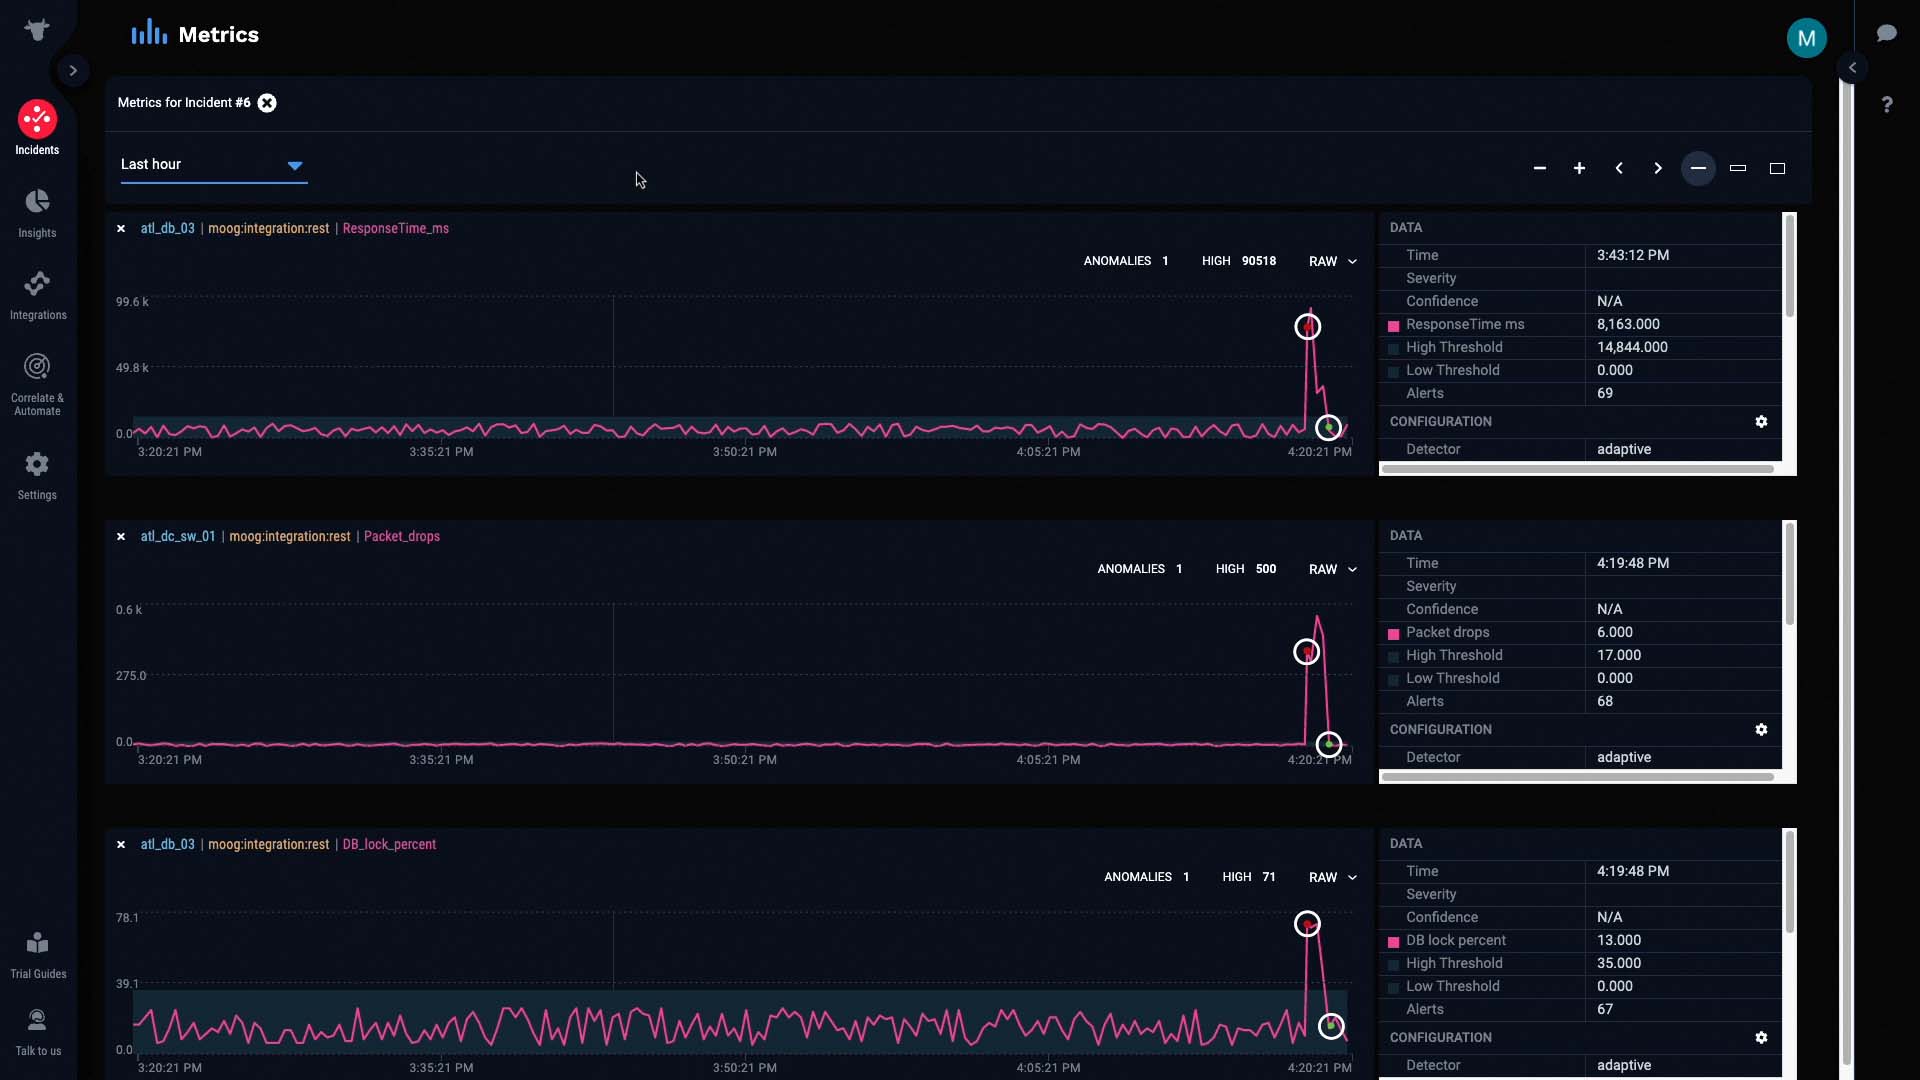
As the metric continued to stray out of bounds, the anomaly was classified as Critical...
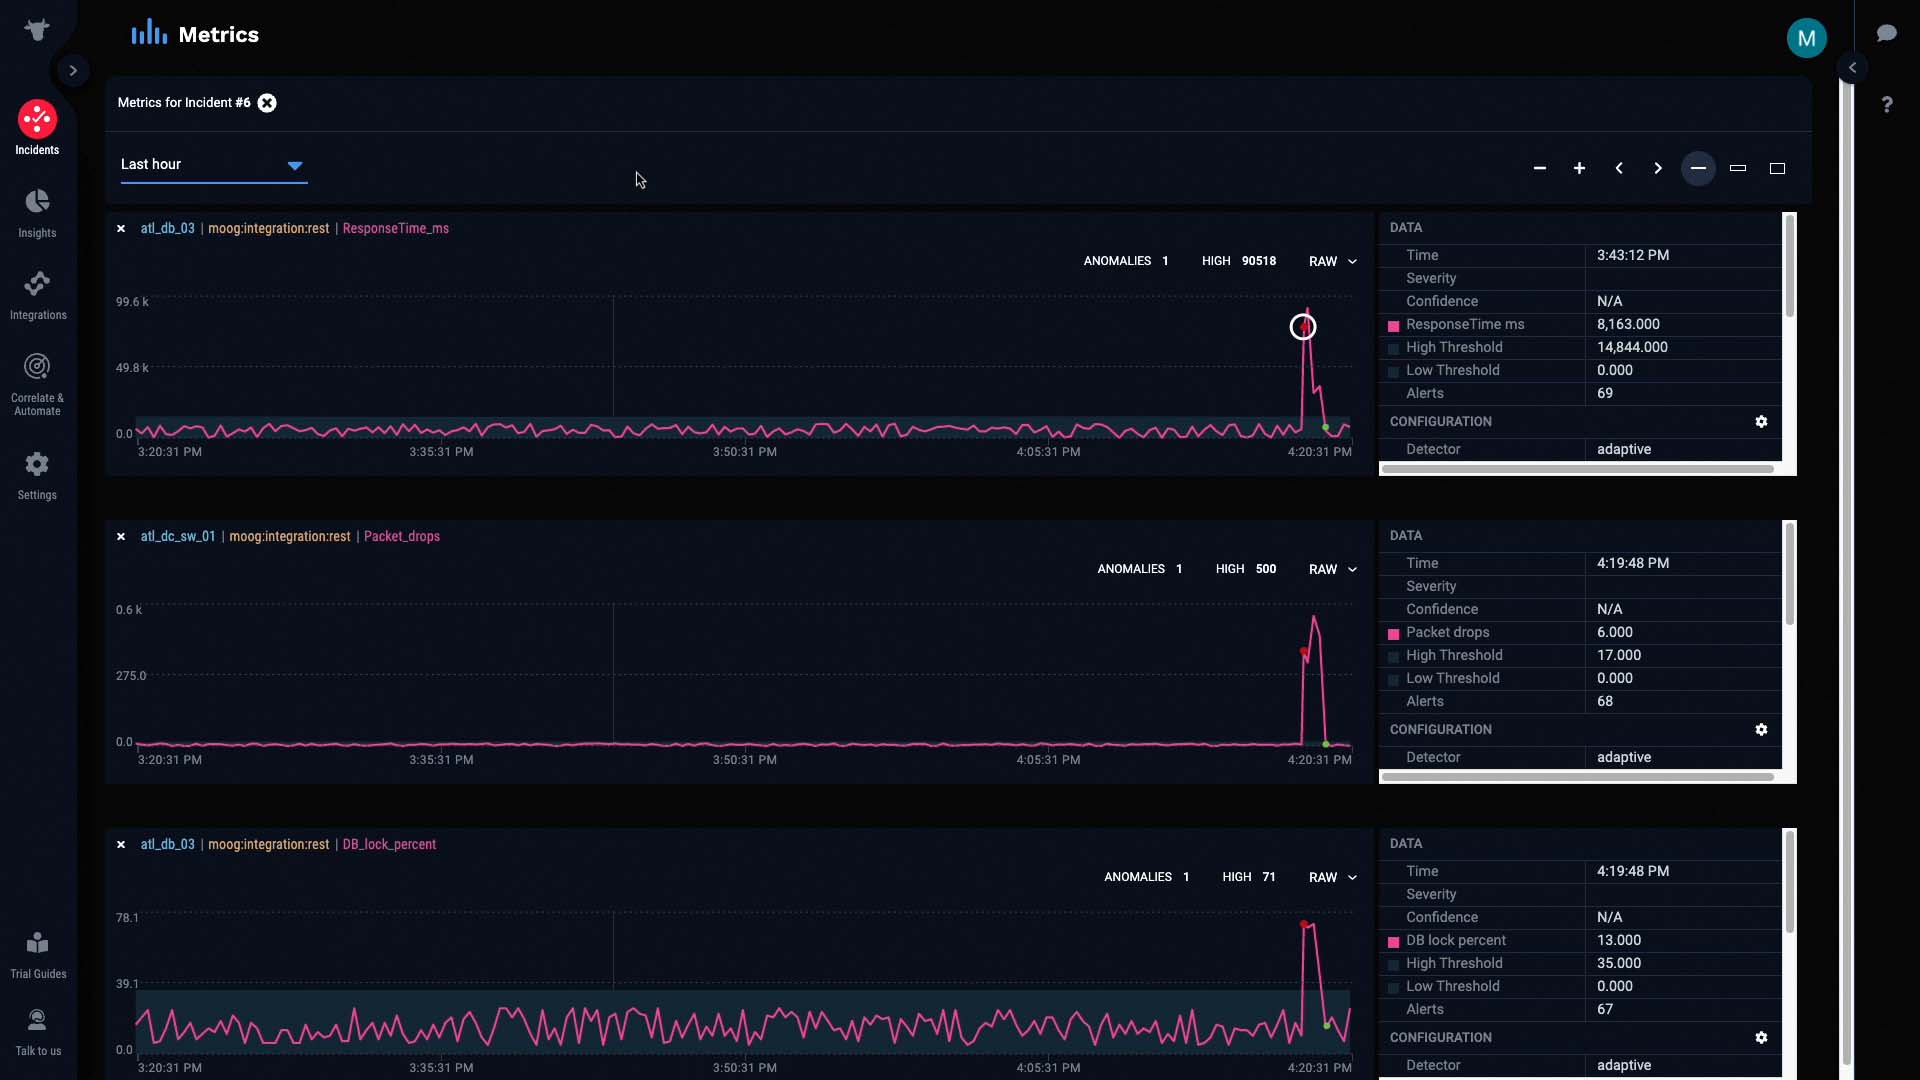
And was later cleared when the metric went back in bounds.
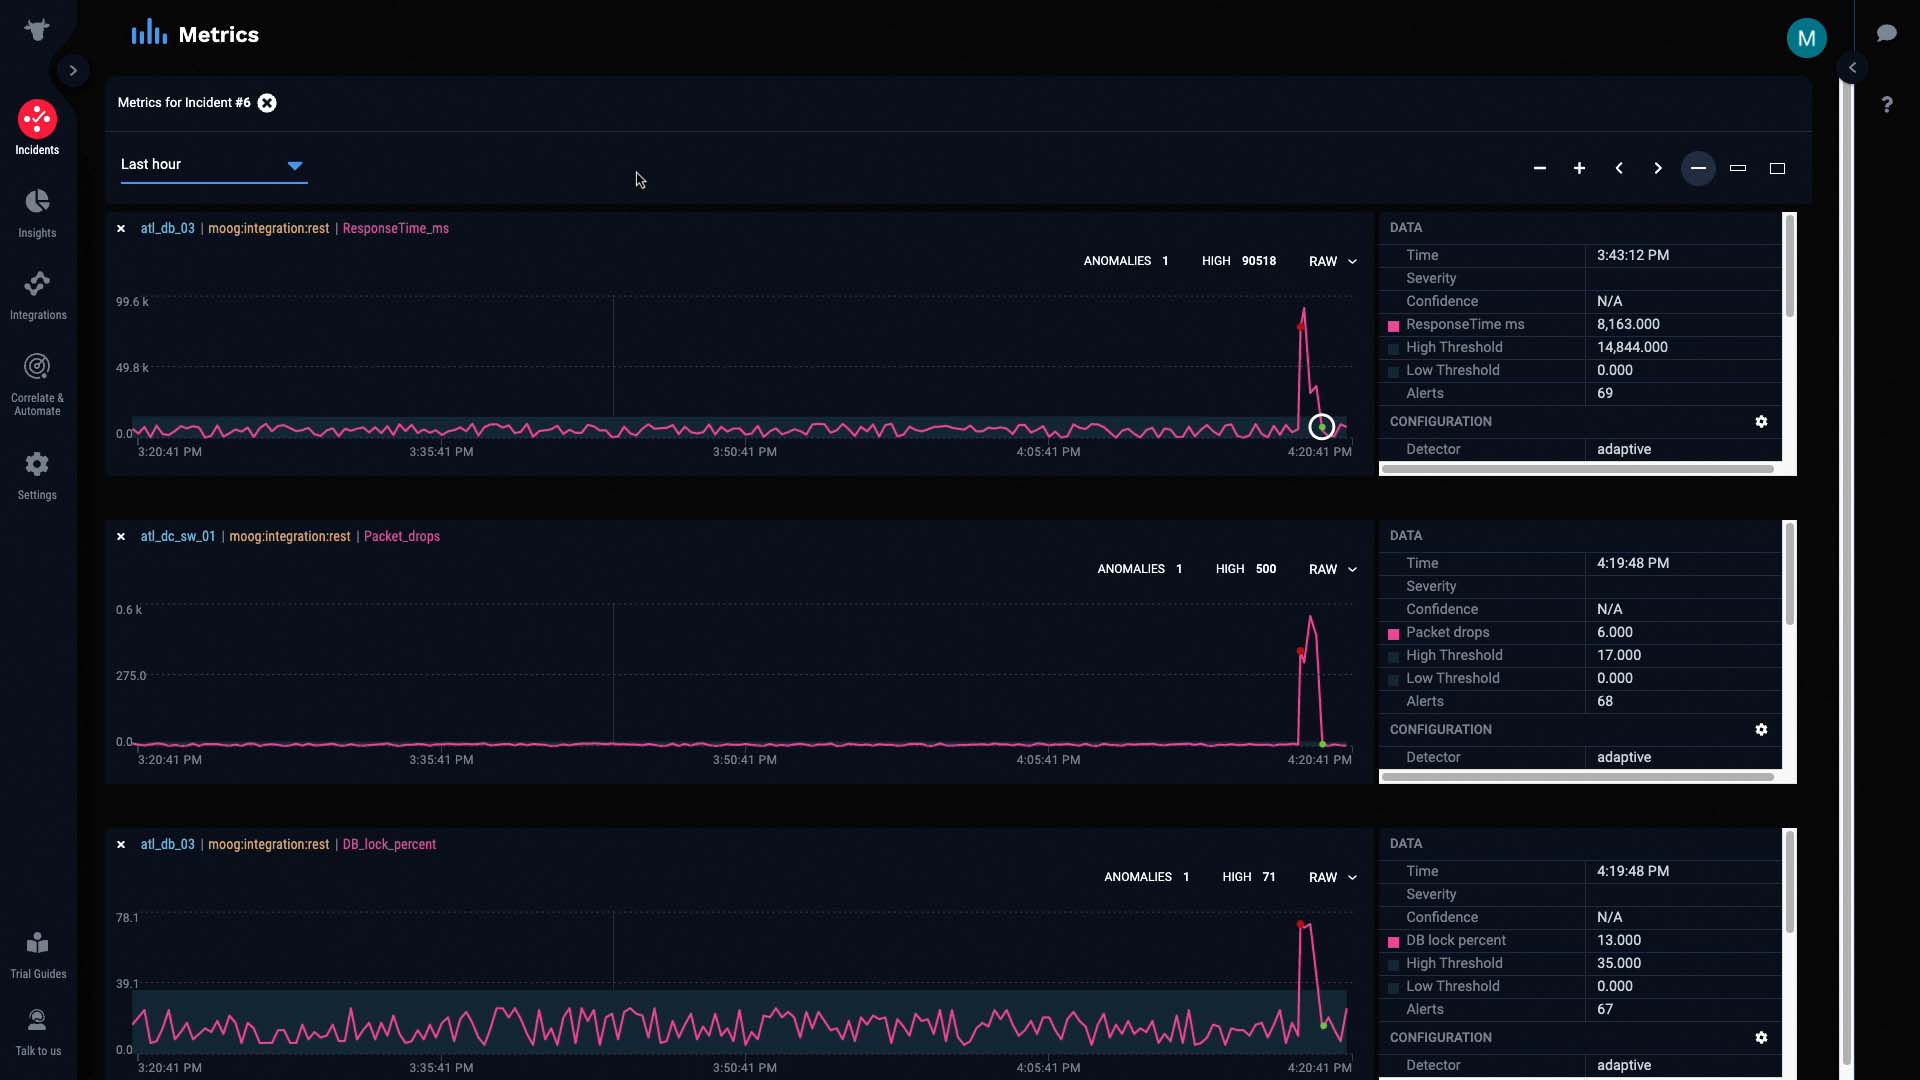
This metric is the packet drops alert we talked about earlier. Let’s see if it’s really the underlying cause of this incident.
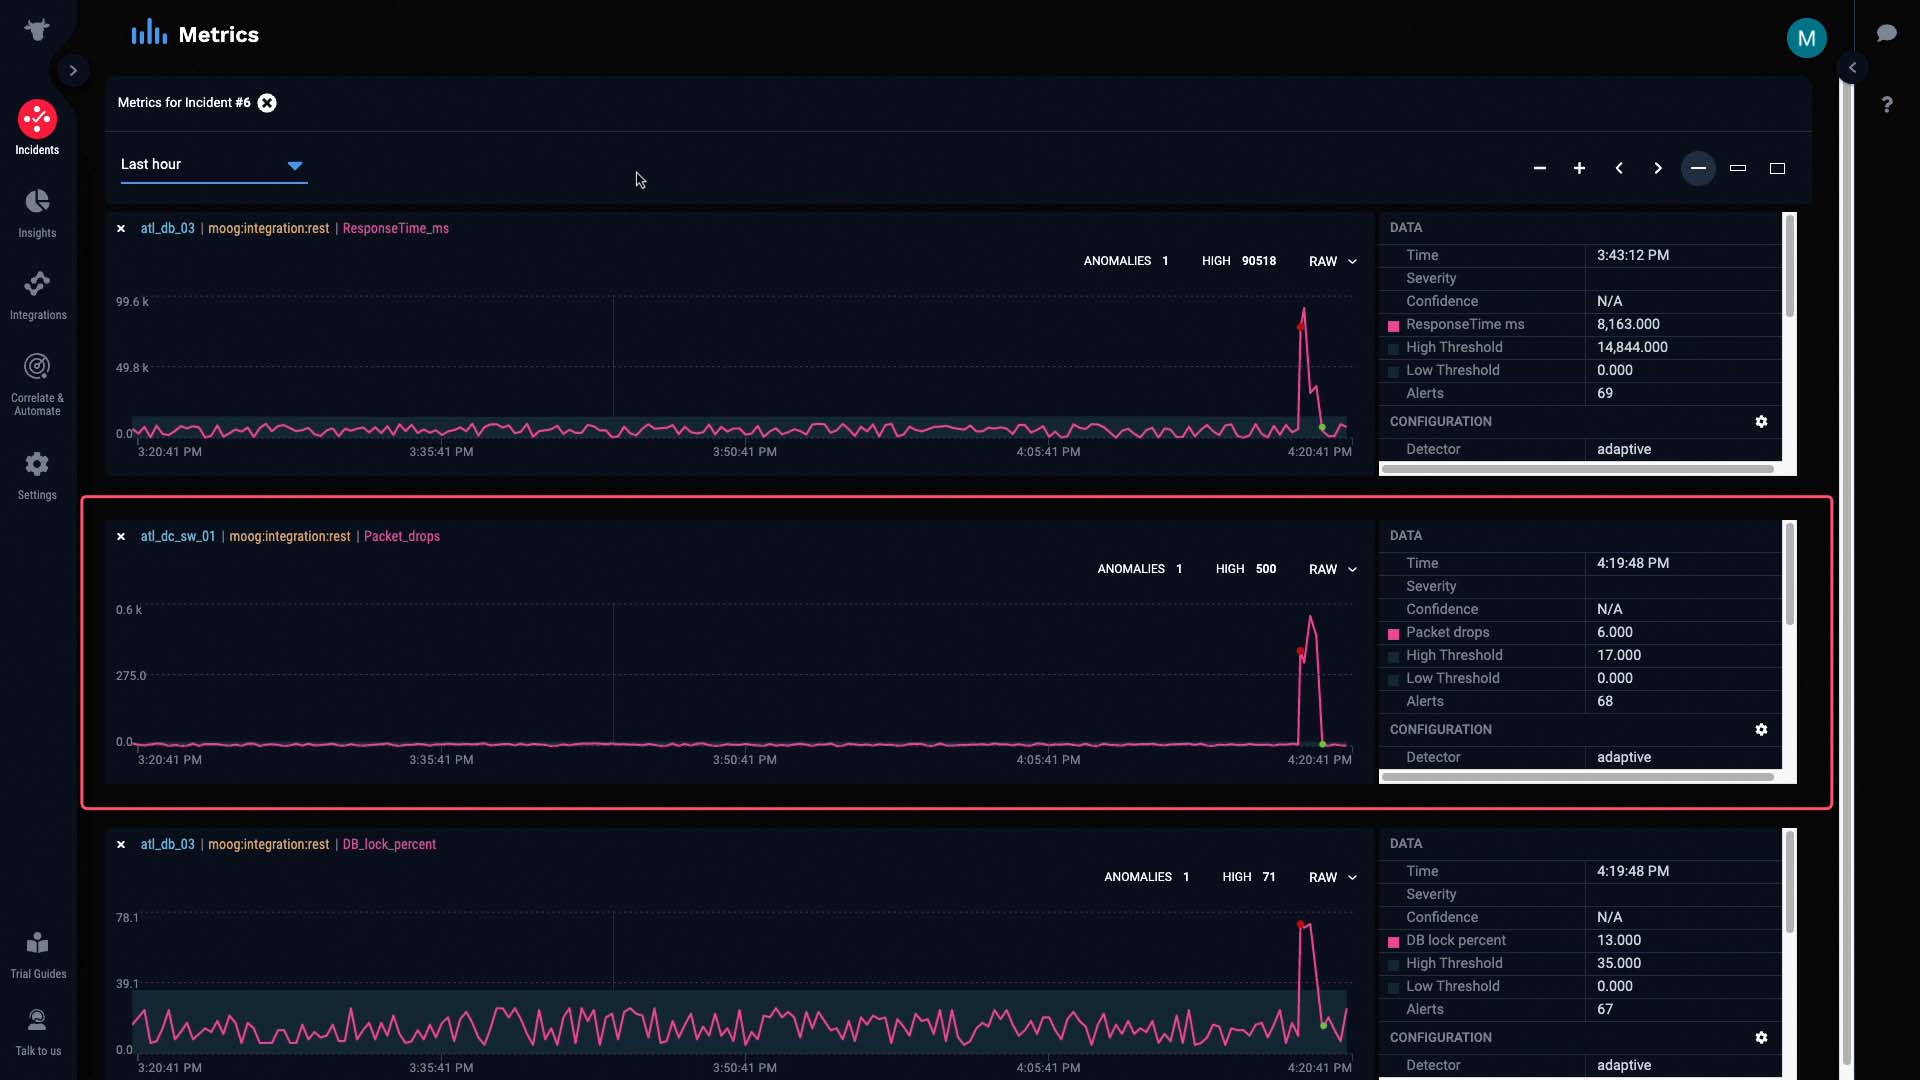
If we compare this graph to the graphs of the other alerts, we can see that all the anomalies started as soon as packet drops were detected...
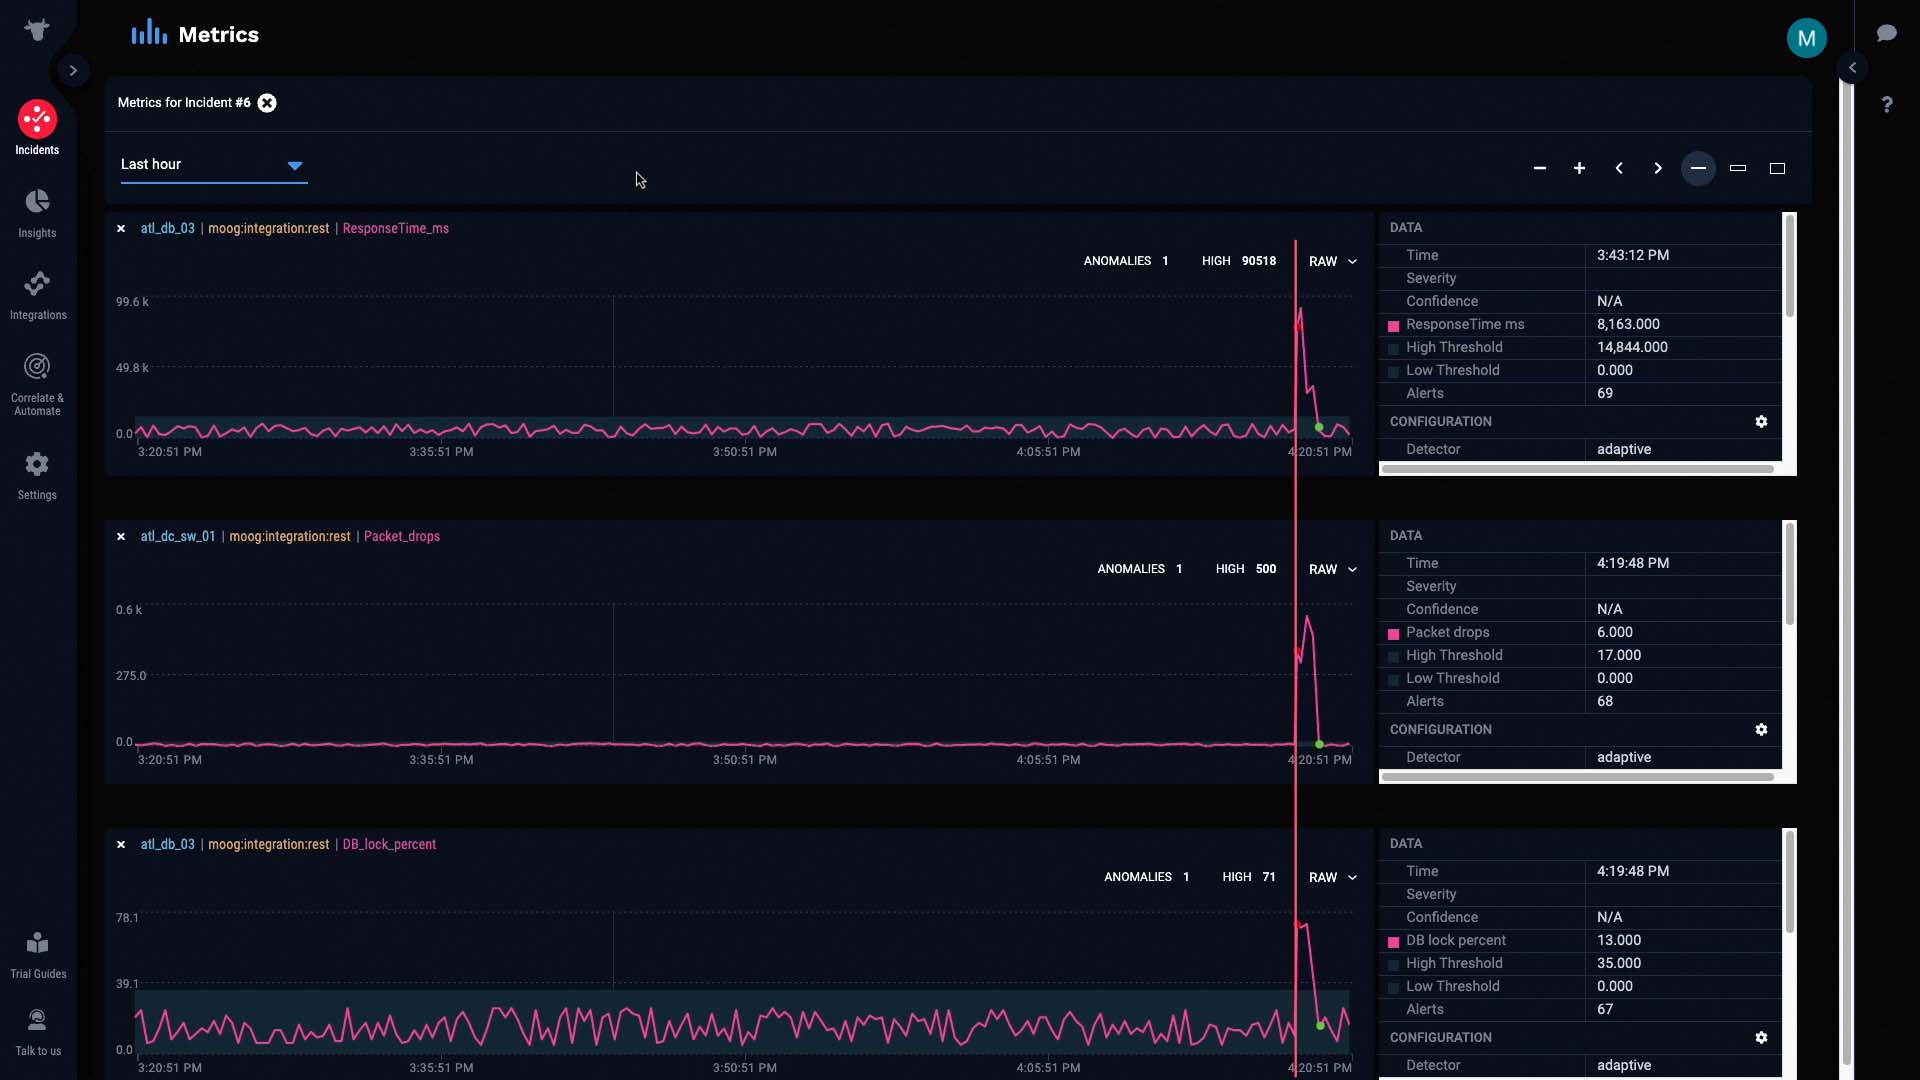
And more importantly, all the anomalies were cleared as soon as packet drops were cleared.
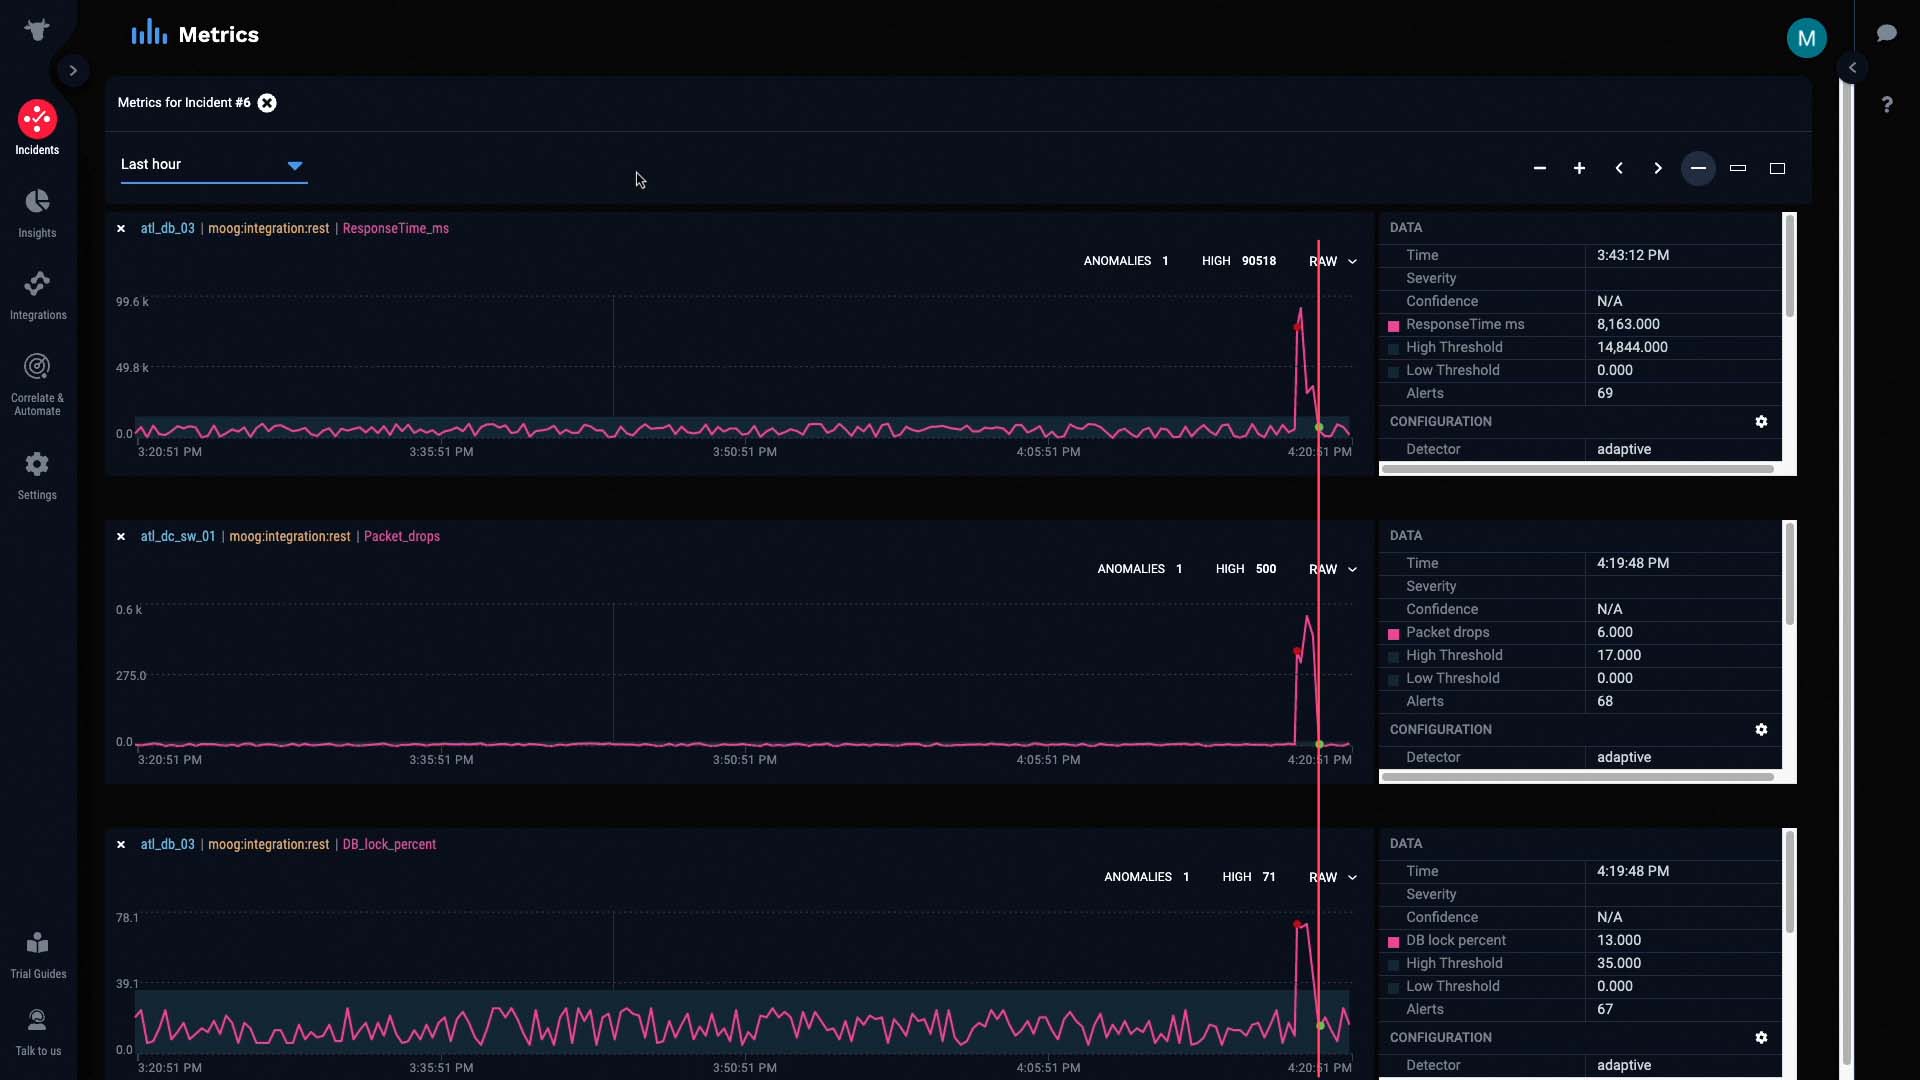
This is a pretty good indication that our hypothesis is correct. The packet drop issue seems to be causing all the other alerts.
With this figured out, we know exactly who we should talk to about next steps. We’ll notify the team responsible for maintaining our network, and ask them to check on the faulty switch in the Atlanta data center.
Imagine how much time we’ve saved just now by having all the info from separate source systems in one place, and having them grouped together based on their relatedness for you. Now you know how you can have Incident Management correlate alerts for you for a faster mean time to recover.
Thanks for watching!