Module 3: Alert correlation
Module contents:
BASIC | 4 MIN
Alerts are correlated into incidents in Moogsoft. Learn how the default correlation works, with emphasis on the correlation time window.
Documentation on this topic is available.
Concept explainer: Alert correlation - how it works ►
This video explains how alerts are correlated into incidents in APEX AIOps Incident Management, as well as the behavior of the correlation time window.
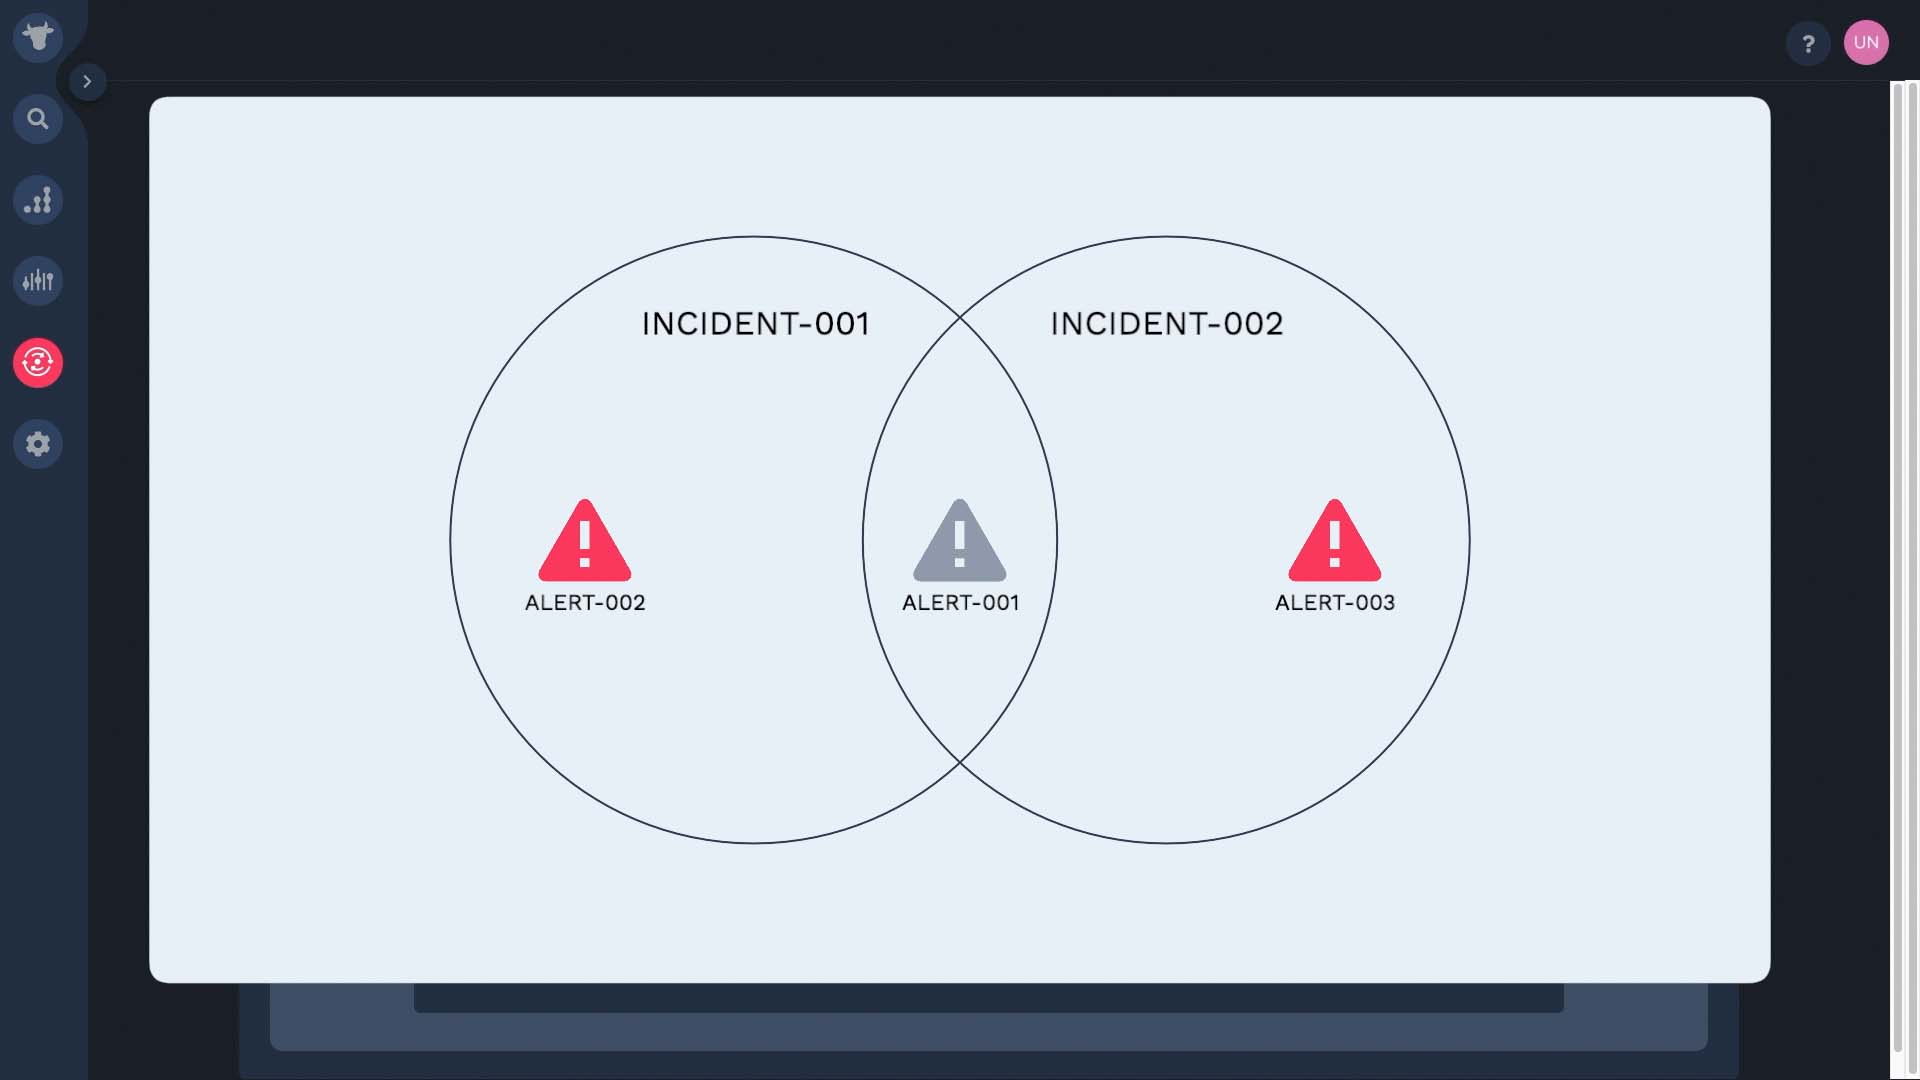
In Incident Management, related alerts are grouped into an incident.
In this video, you will learn how to correlate your alerts into incidents in Incident Management.
Specifically, you will be able to explain the default correlation settings and how alerts are correlated into incidents. Also, you will be able to configure new clustering settings in the correlation engine.
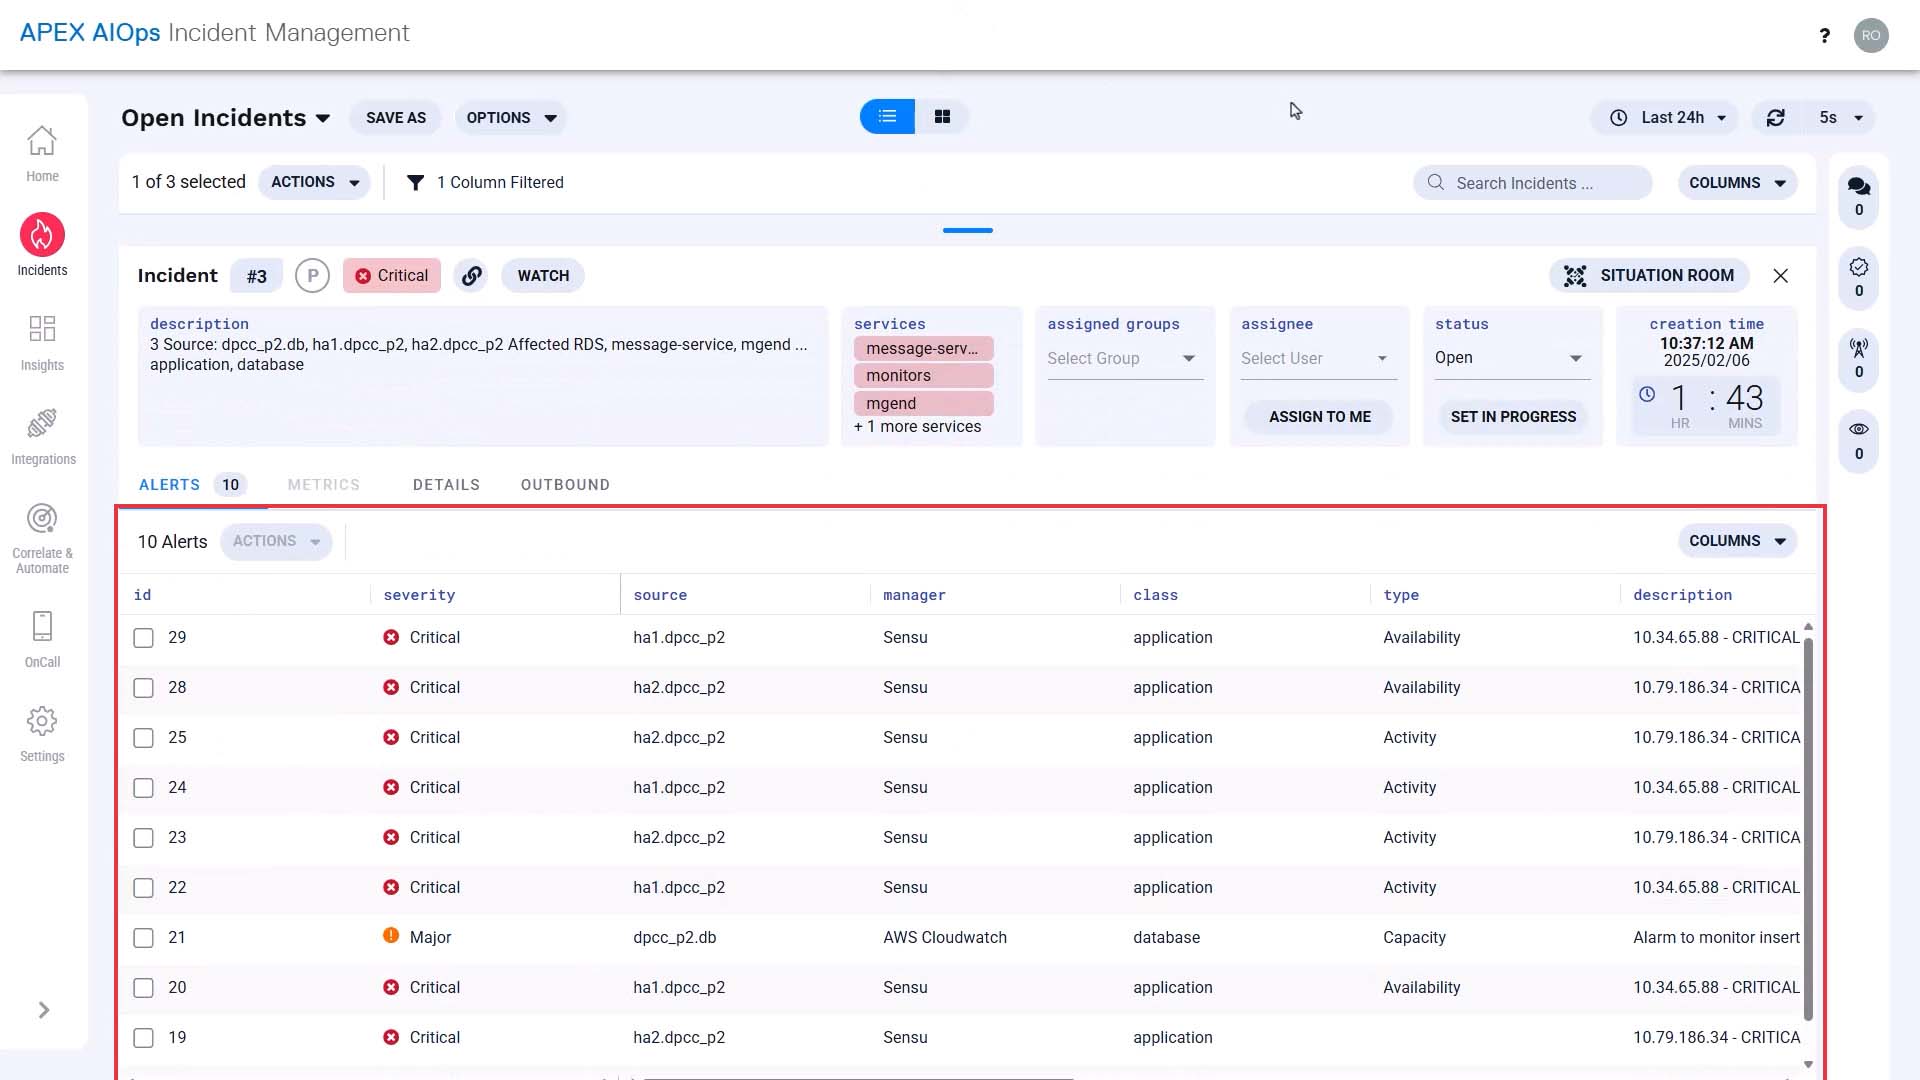
Correlation engine is where you manage all alert clustering configurations.
You start out with one out-of-the-box clustering setting, so your alerts will be grouped into incidents without any configuration on your end.
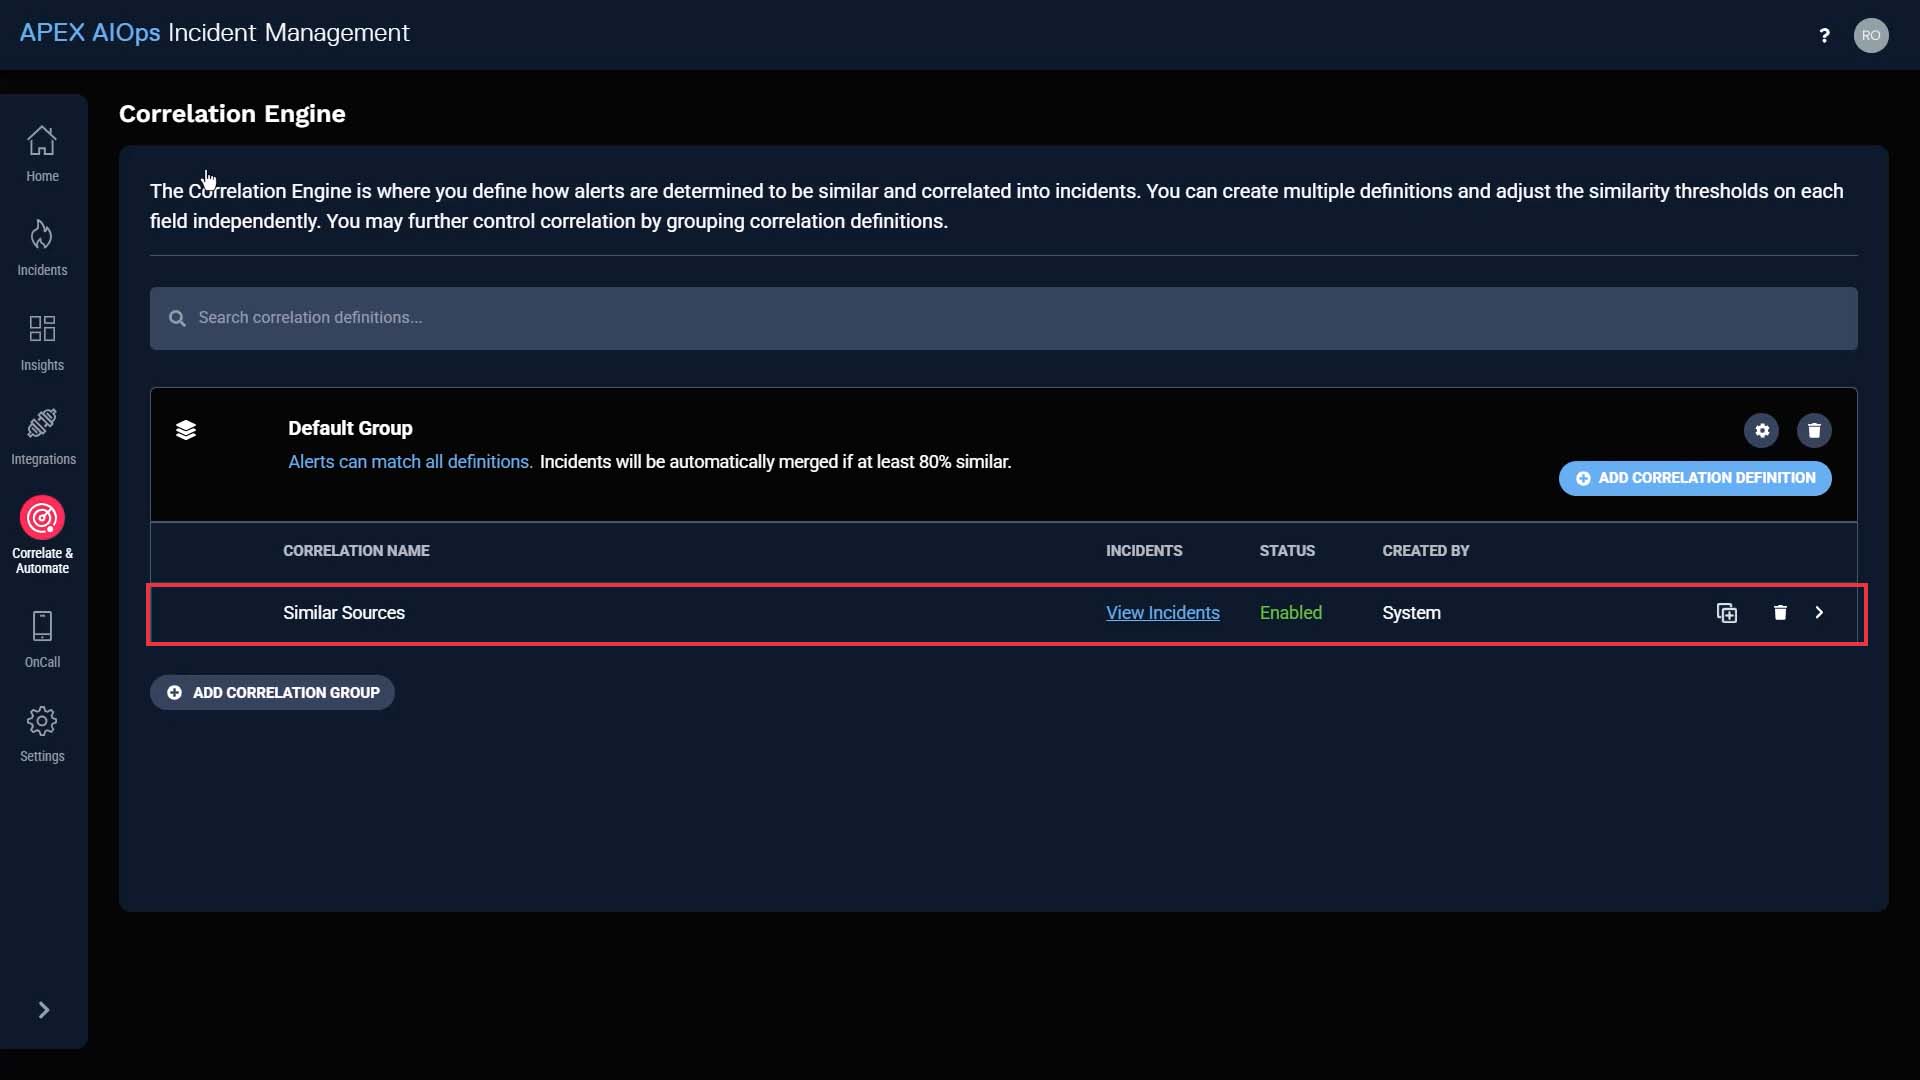
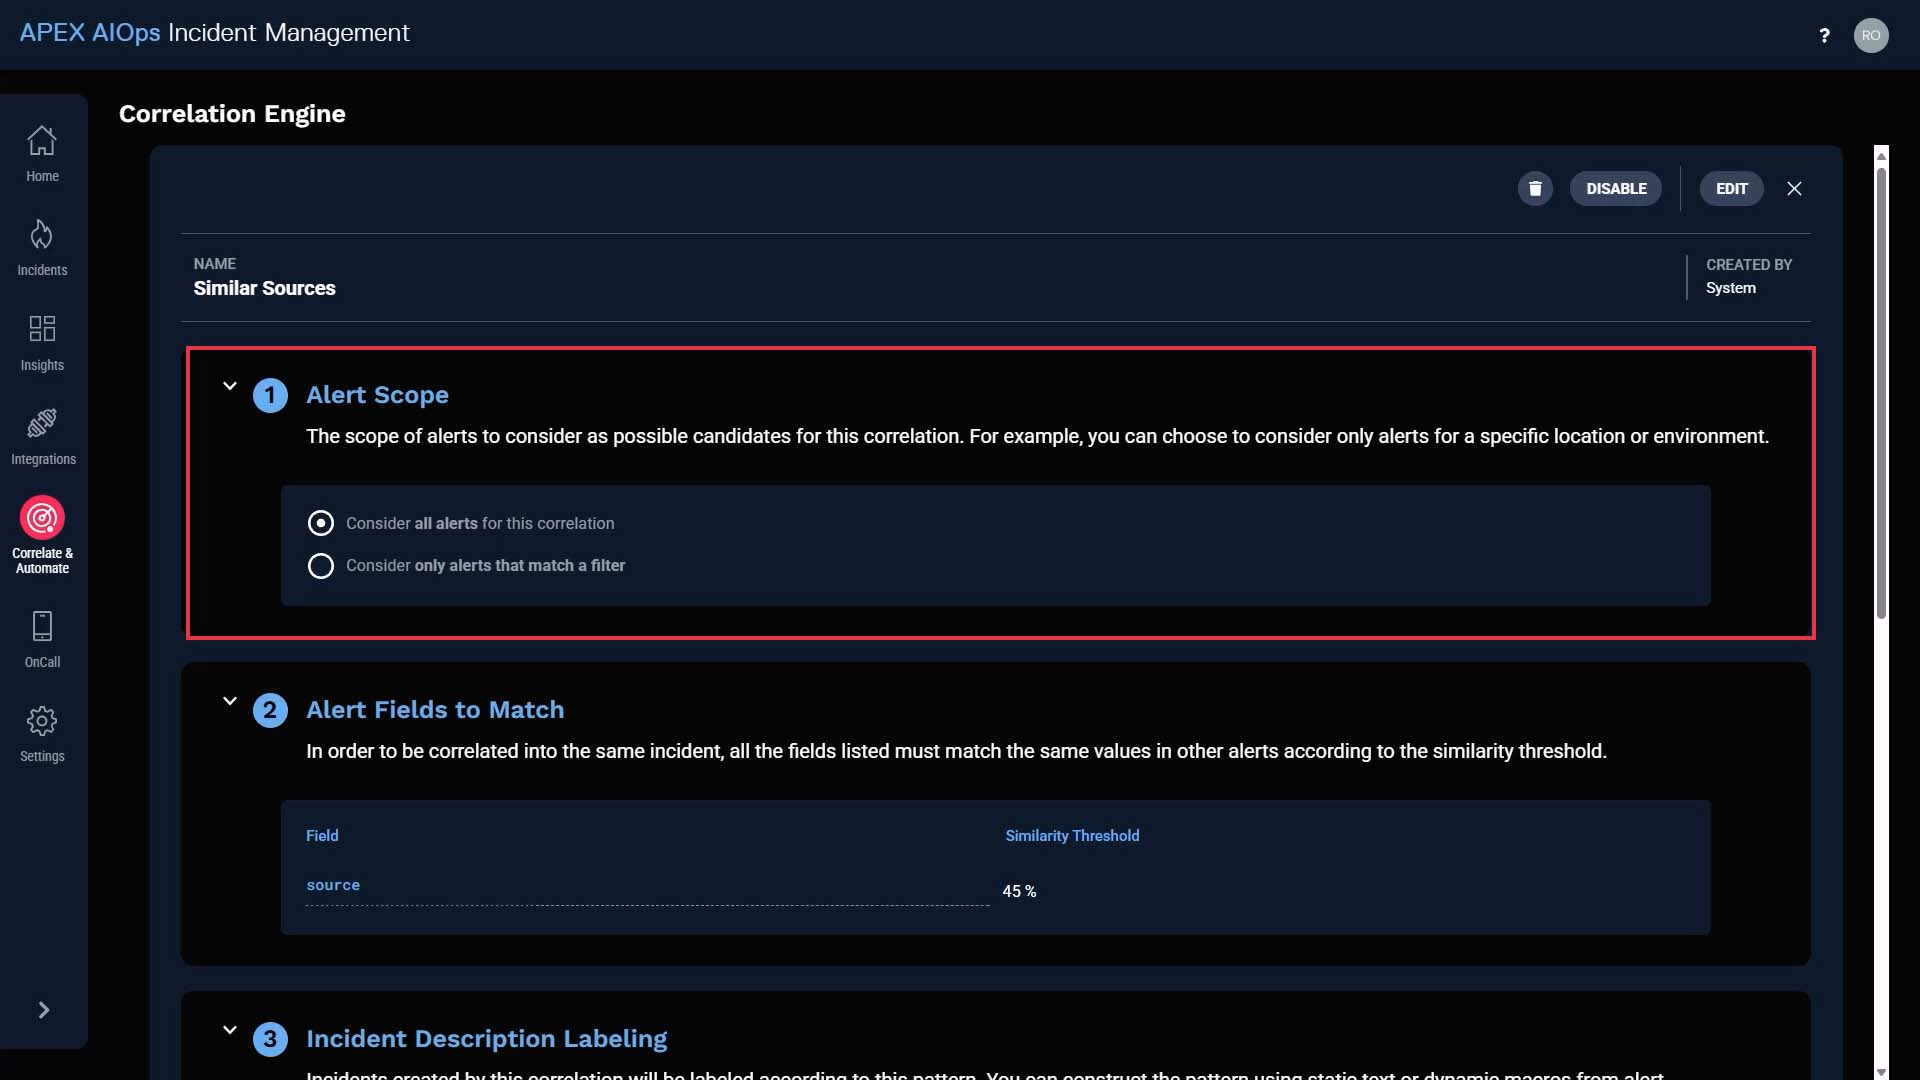
This is the default correlation setting. Scope defines which alerts are going to be evaluated by this correlation definition. Consider it like an entry filter. Since right now there’s only one correlation, it will evaluate ALL alerts. It will evaluate the source field values, and the alerts whose source field values match more than 45% will be clustered into an incident.
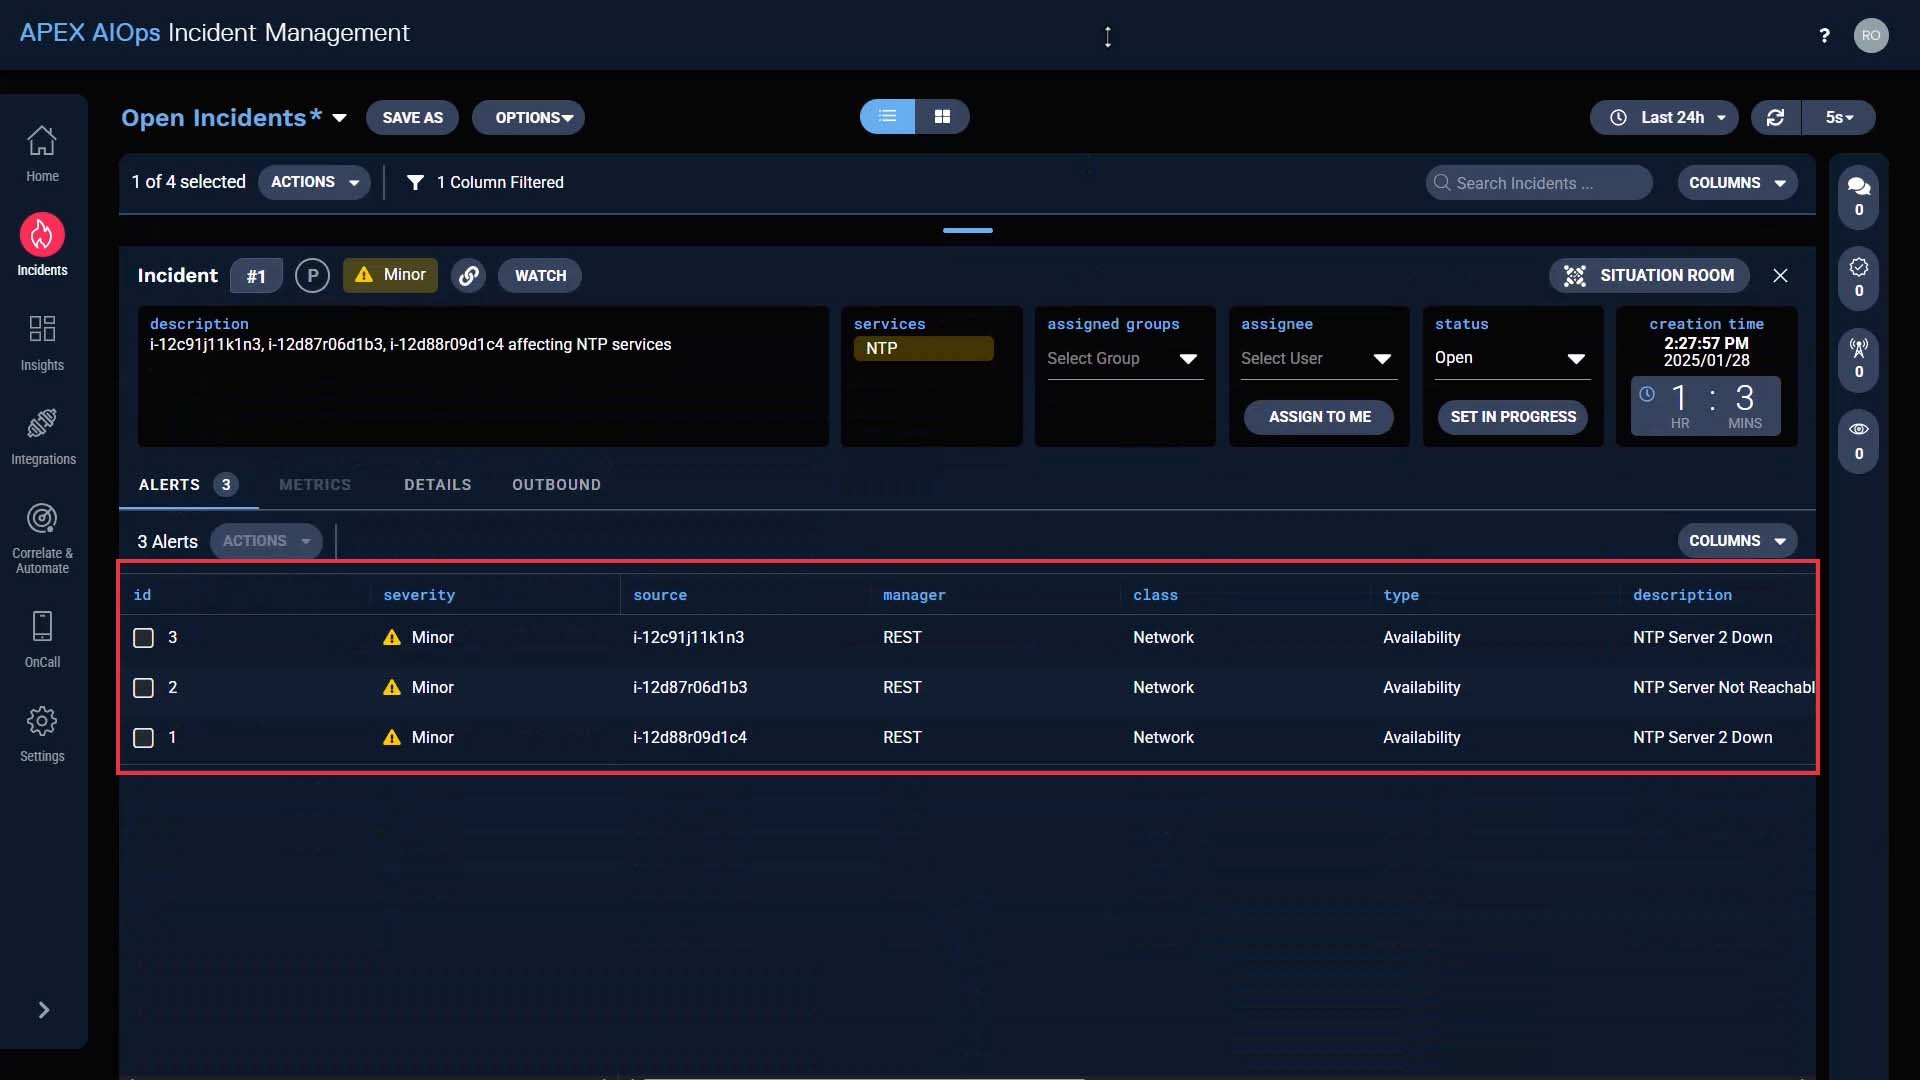
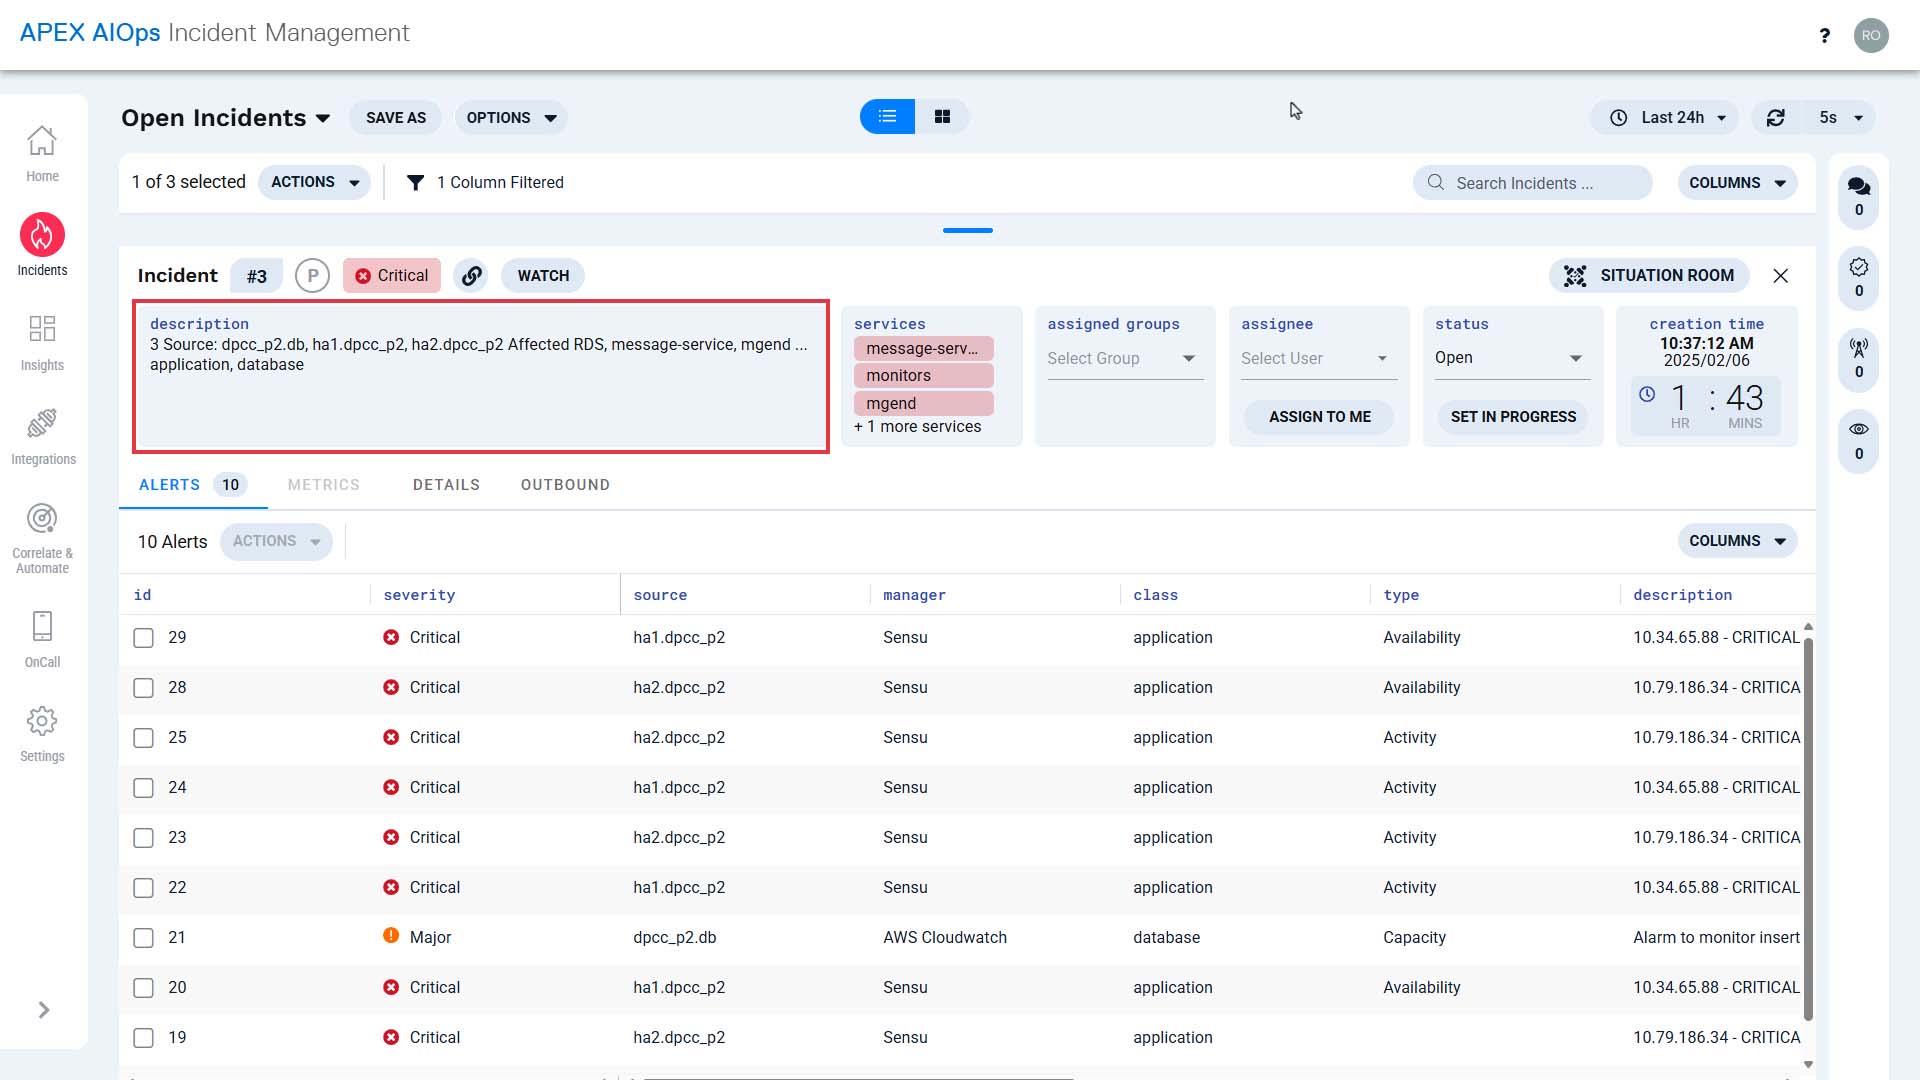
The incident created by this correlation will have a dynamically composed description. The default description shows how many sources are affected, and the top three sources, services, and event classes involved in the incident.
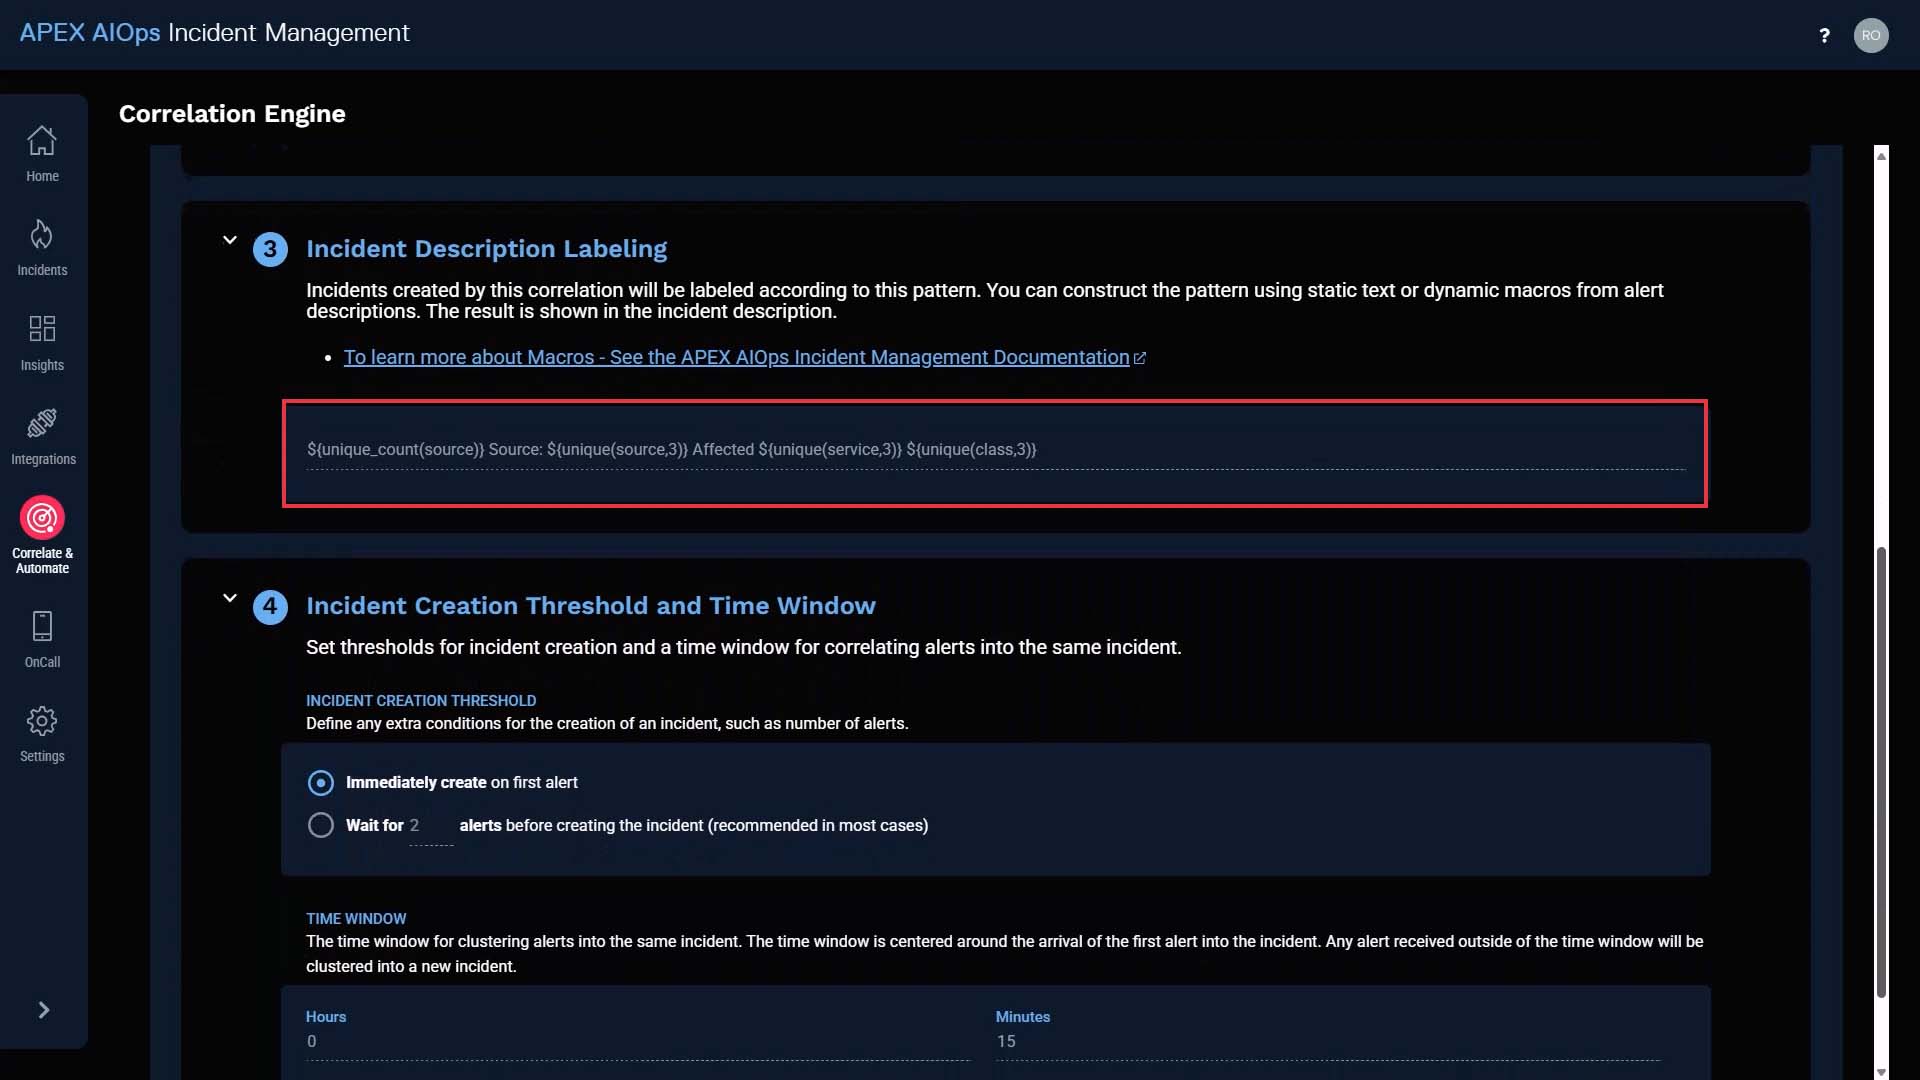
You can choose how many similar alerts are needed to create an incident. The default is one alert, so every alert that arrives will either form a new incident or be added to an existing incident.
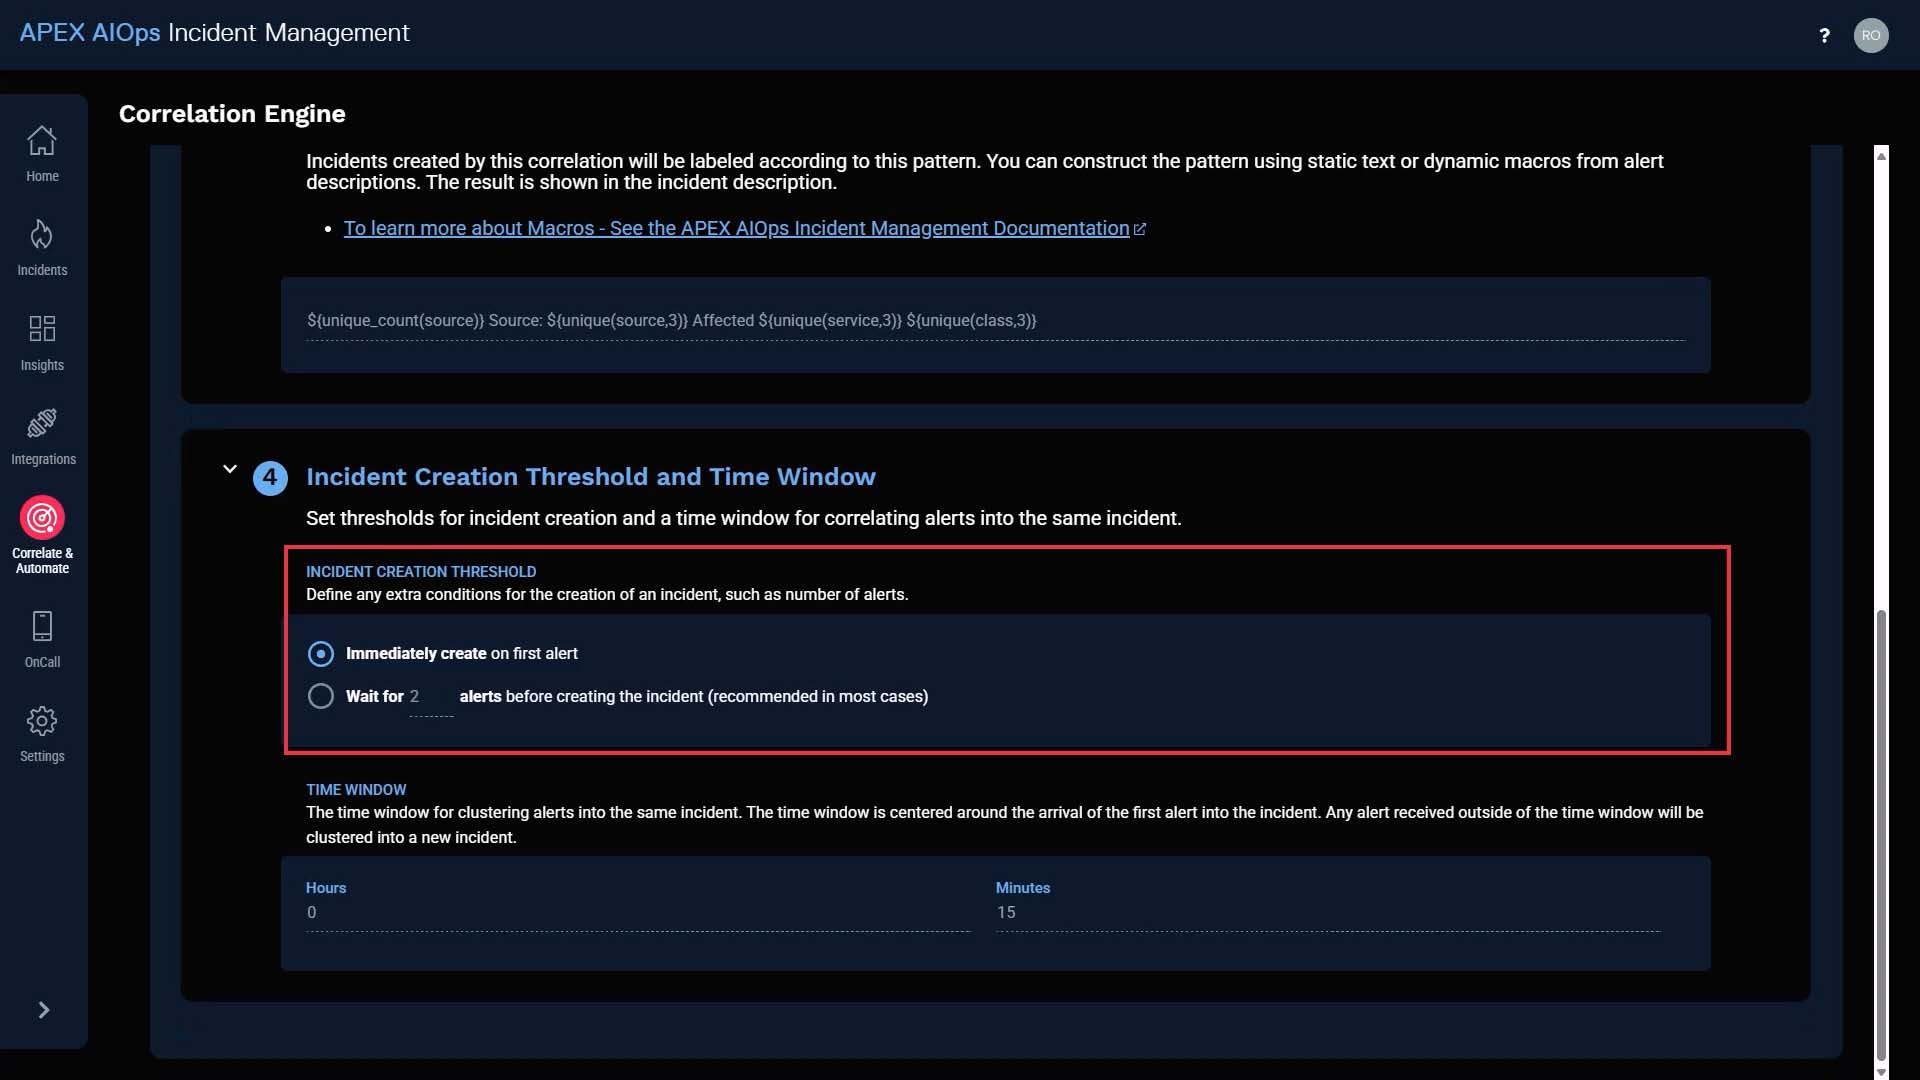
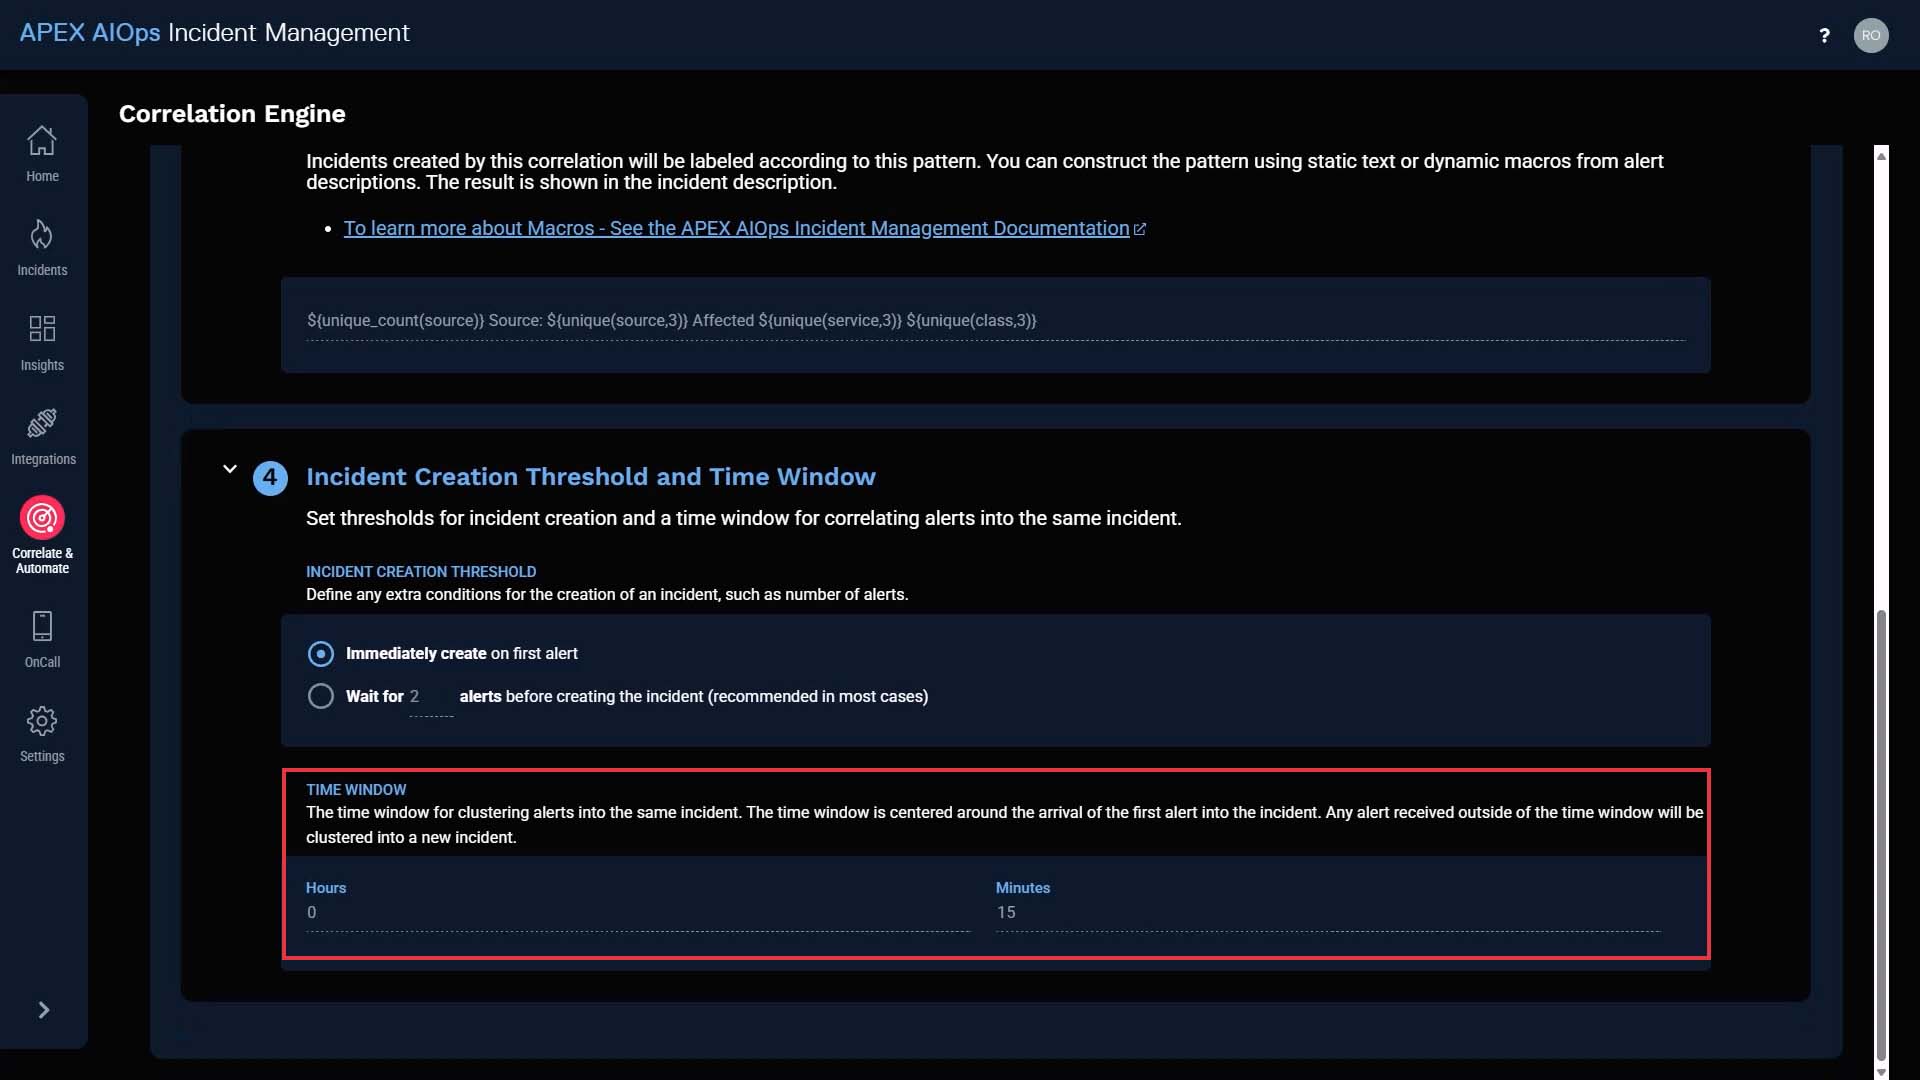
The time window for correlation is automatically set.
You can set the correlation time window up to 24 hours. Let me show you how it works.
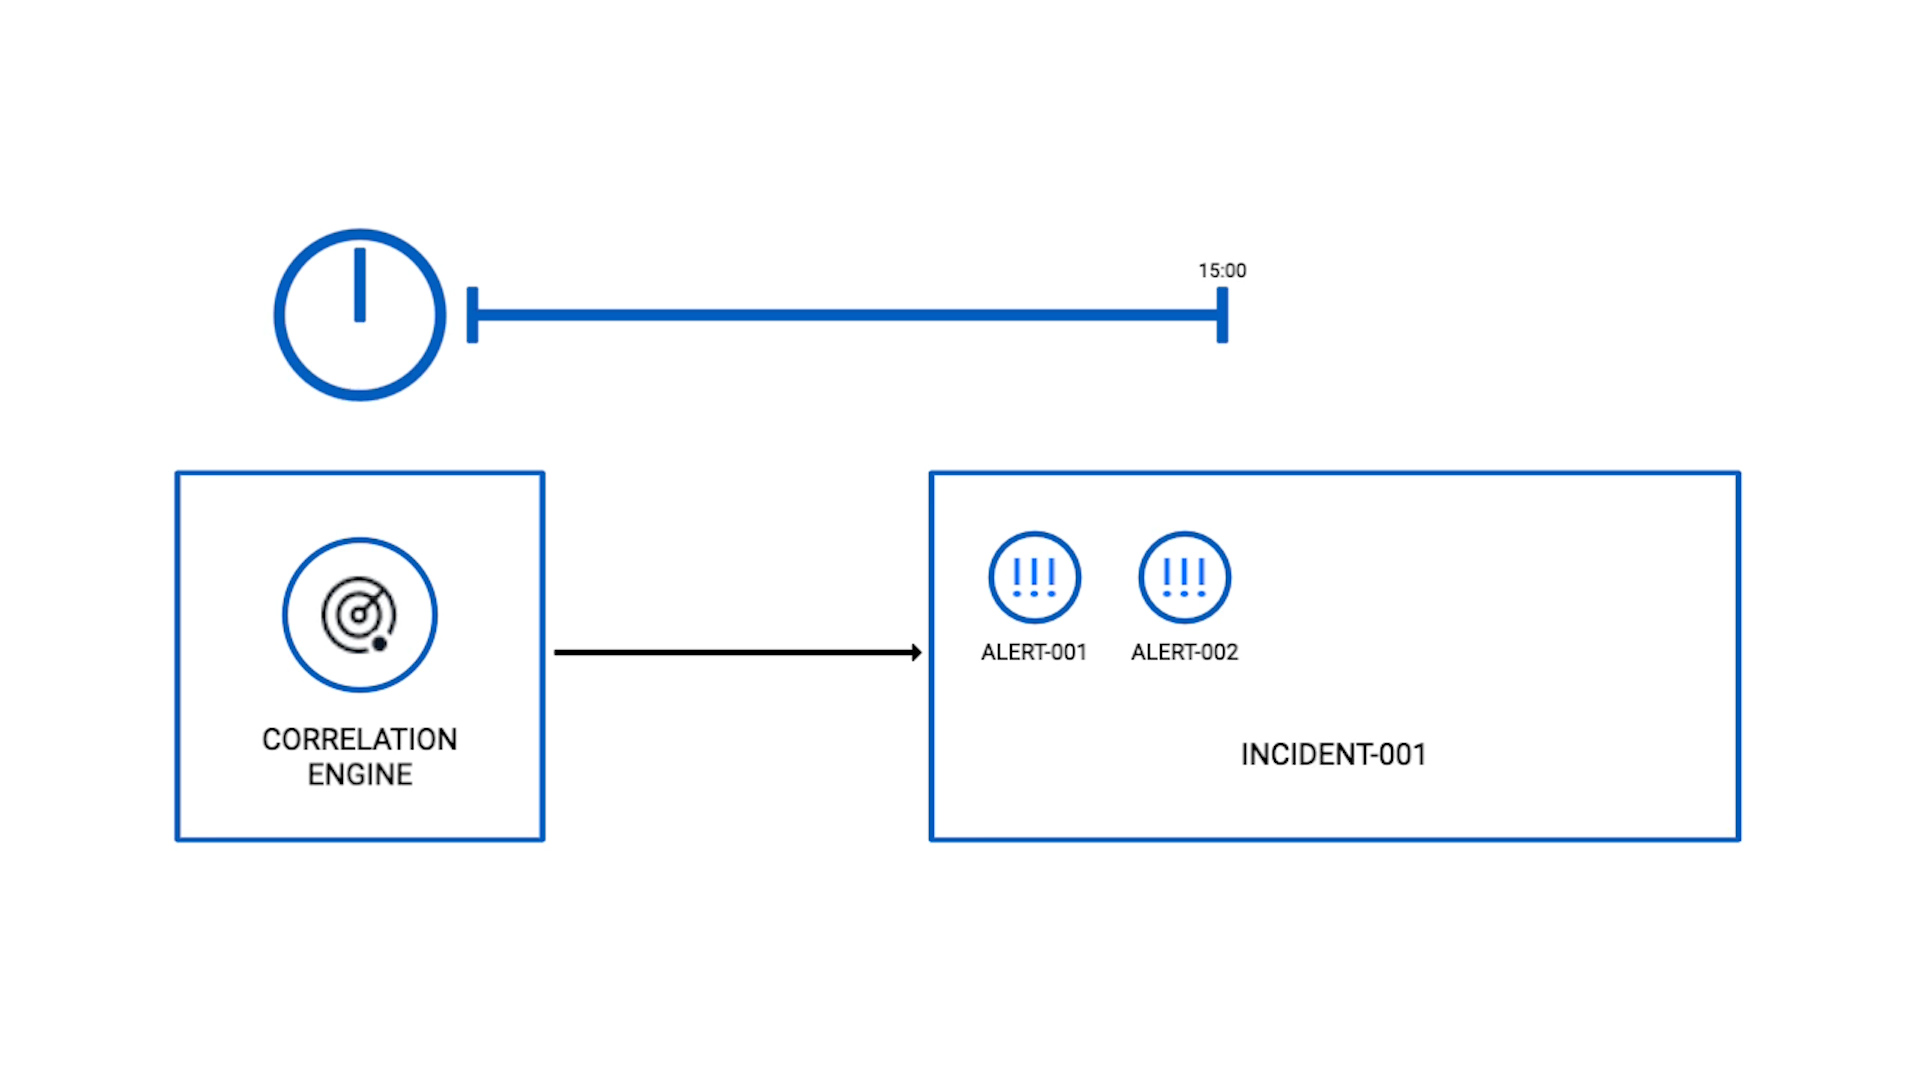
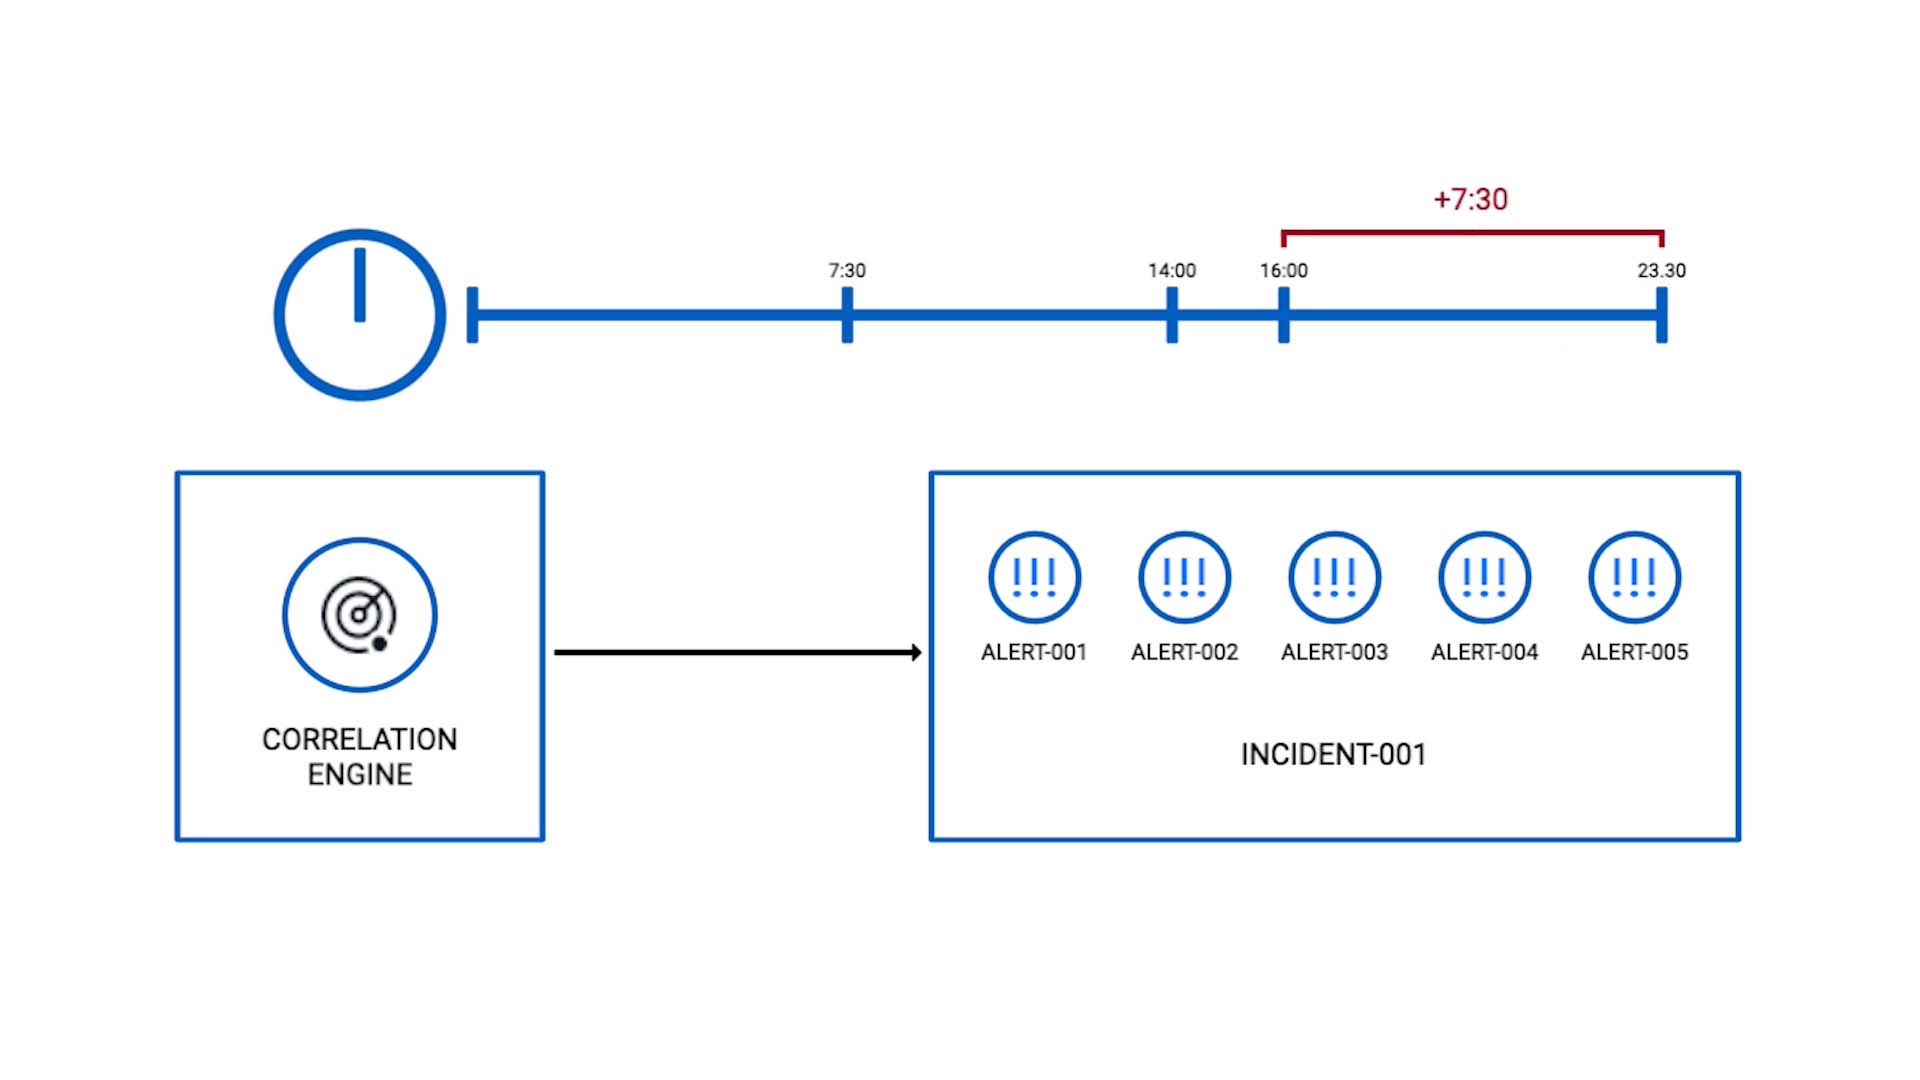
When an incident is created, the correlation engine starts a timer. Let’s say we keep the time window to 15 minutes.
If more qualifying alerts come in, they are added to the incident.
But we don’t want to keep adding alerts to the same incidents forever. If you keep the incident open for new alert membership for an indefinite amount of time, you’ll end up mixing multiple separate issues.
So, here’s how Incident Management handles the time window.
The key concept here is 50%. 50% of the default time window of 15 minutes is 7 minutes 30 seconds.
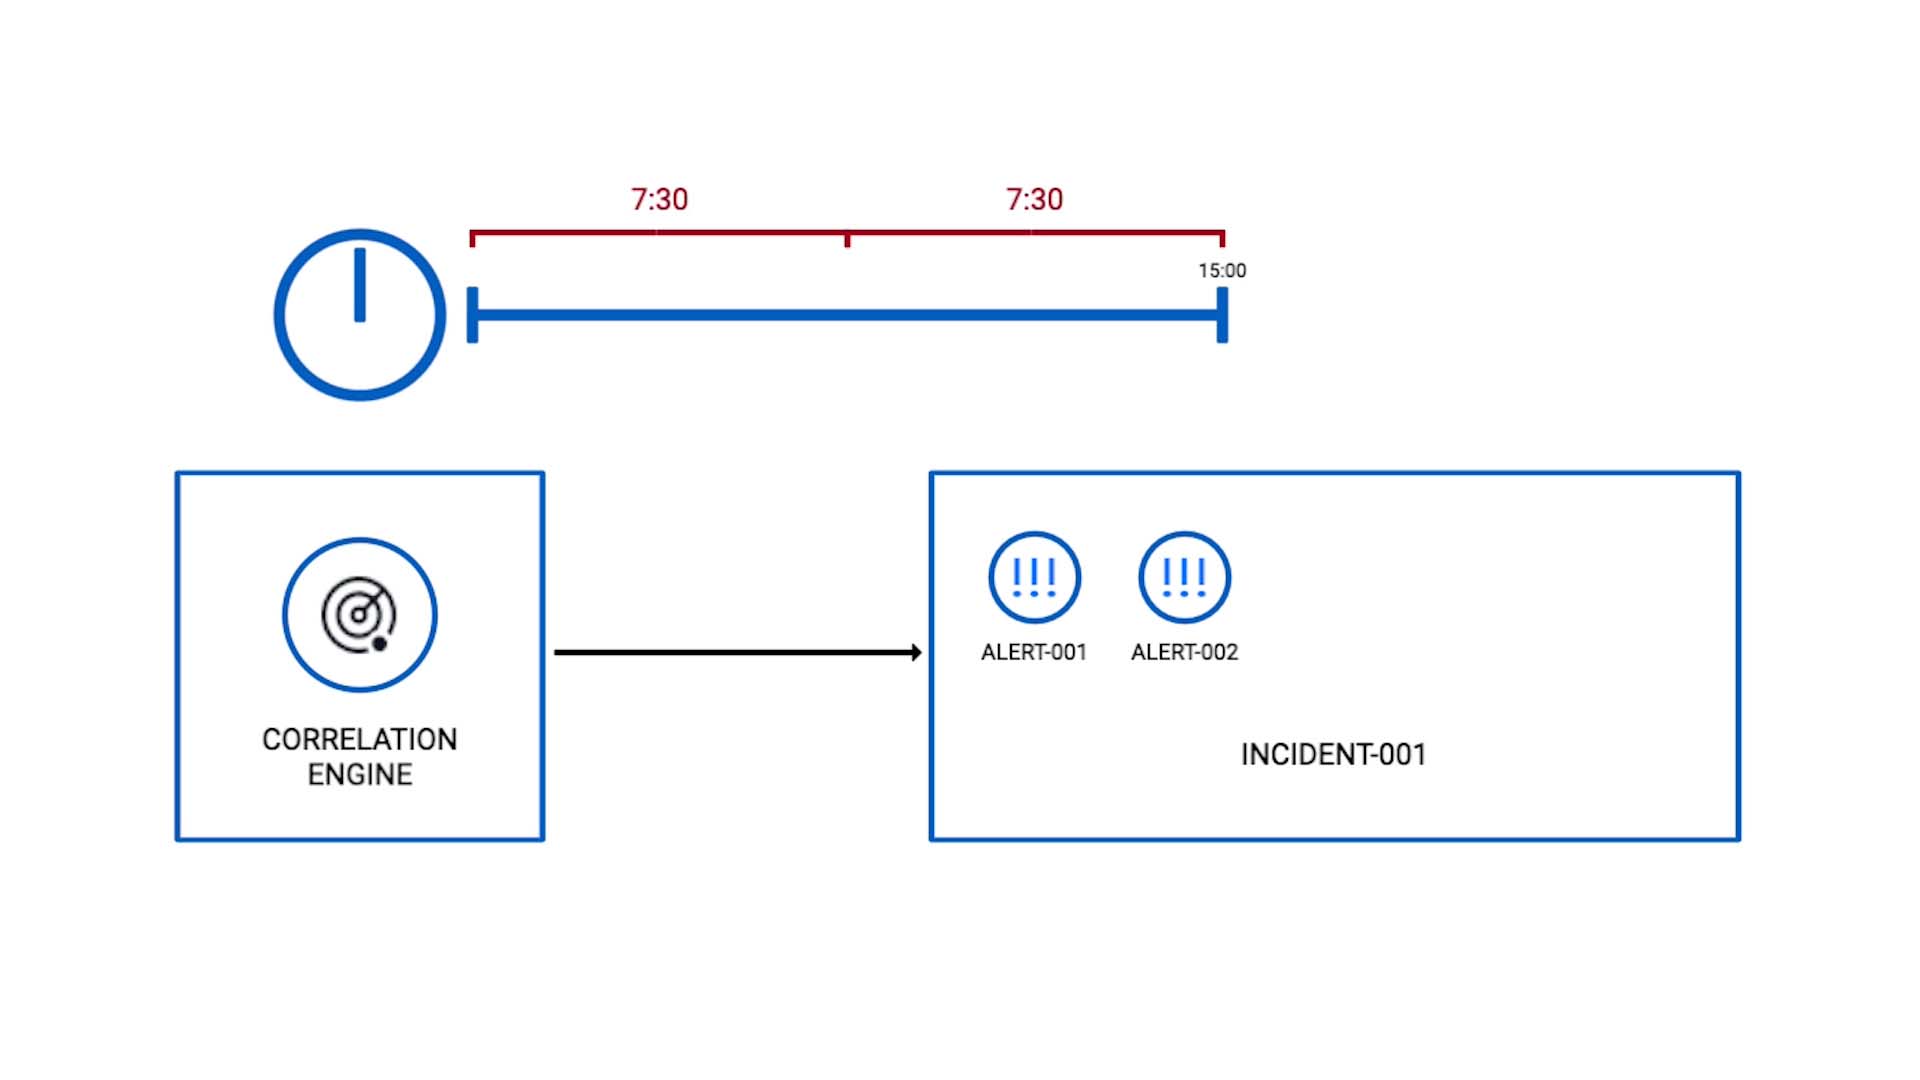
From the moment the incident formed, qualifying alerts keep getting added to this incident throughout the 15 minute time window.
But the last half, from 7 minutes 30 second to 15 minutes, is the key to determine when the time window for this incident actually closes.
If no qualifying alert arrives during the second half, then the window closes at the default 15 minute mark.
But if a qualifying alert comes in during the second half, say, at the 14 minute mark,
it triggers Incident Management to extend the correlation window. For how long?
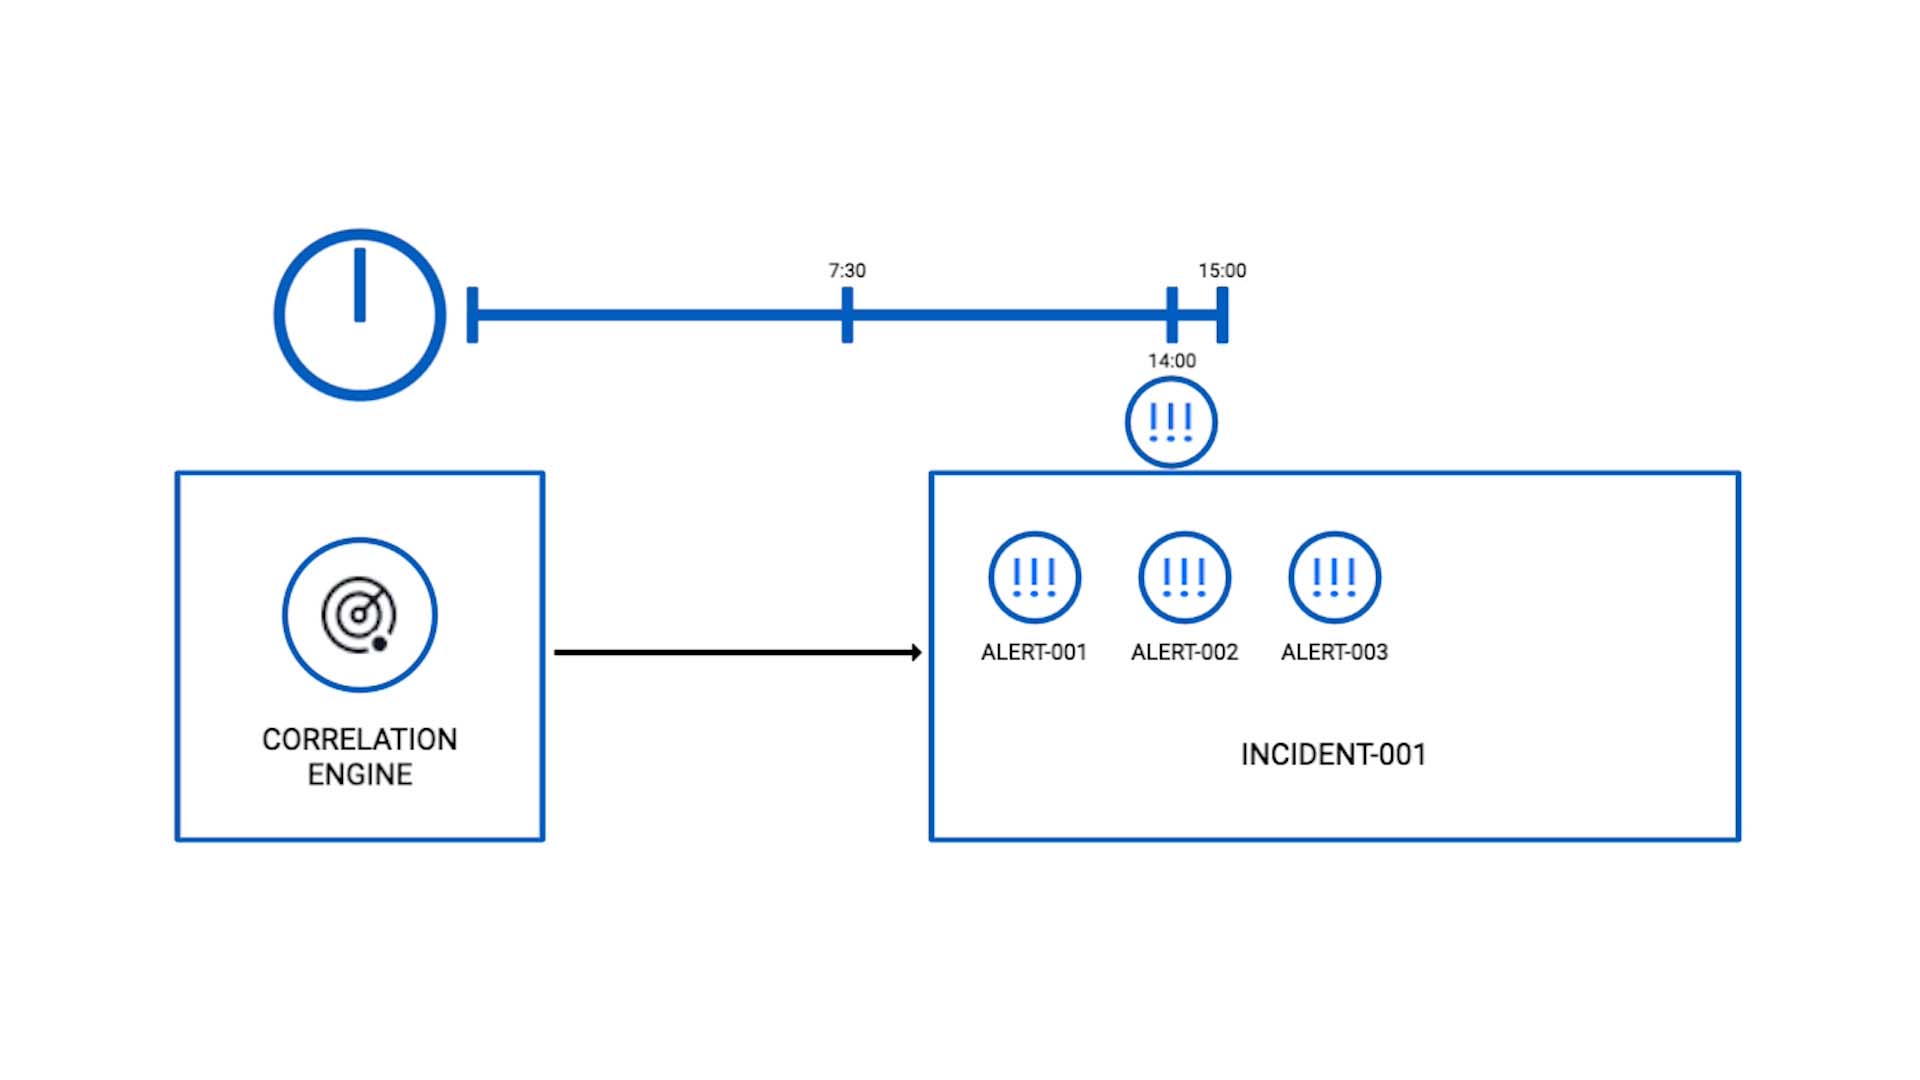
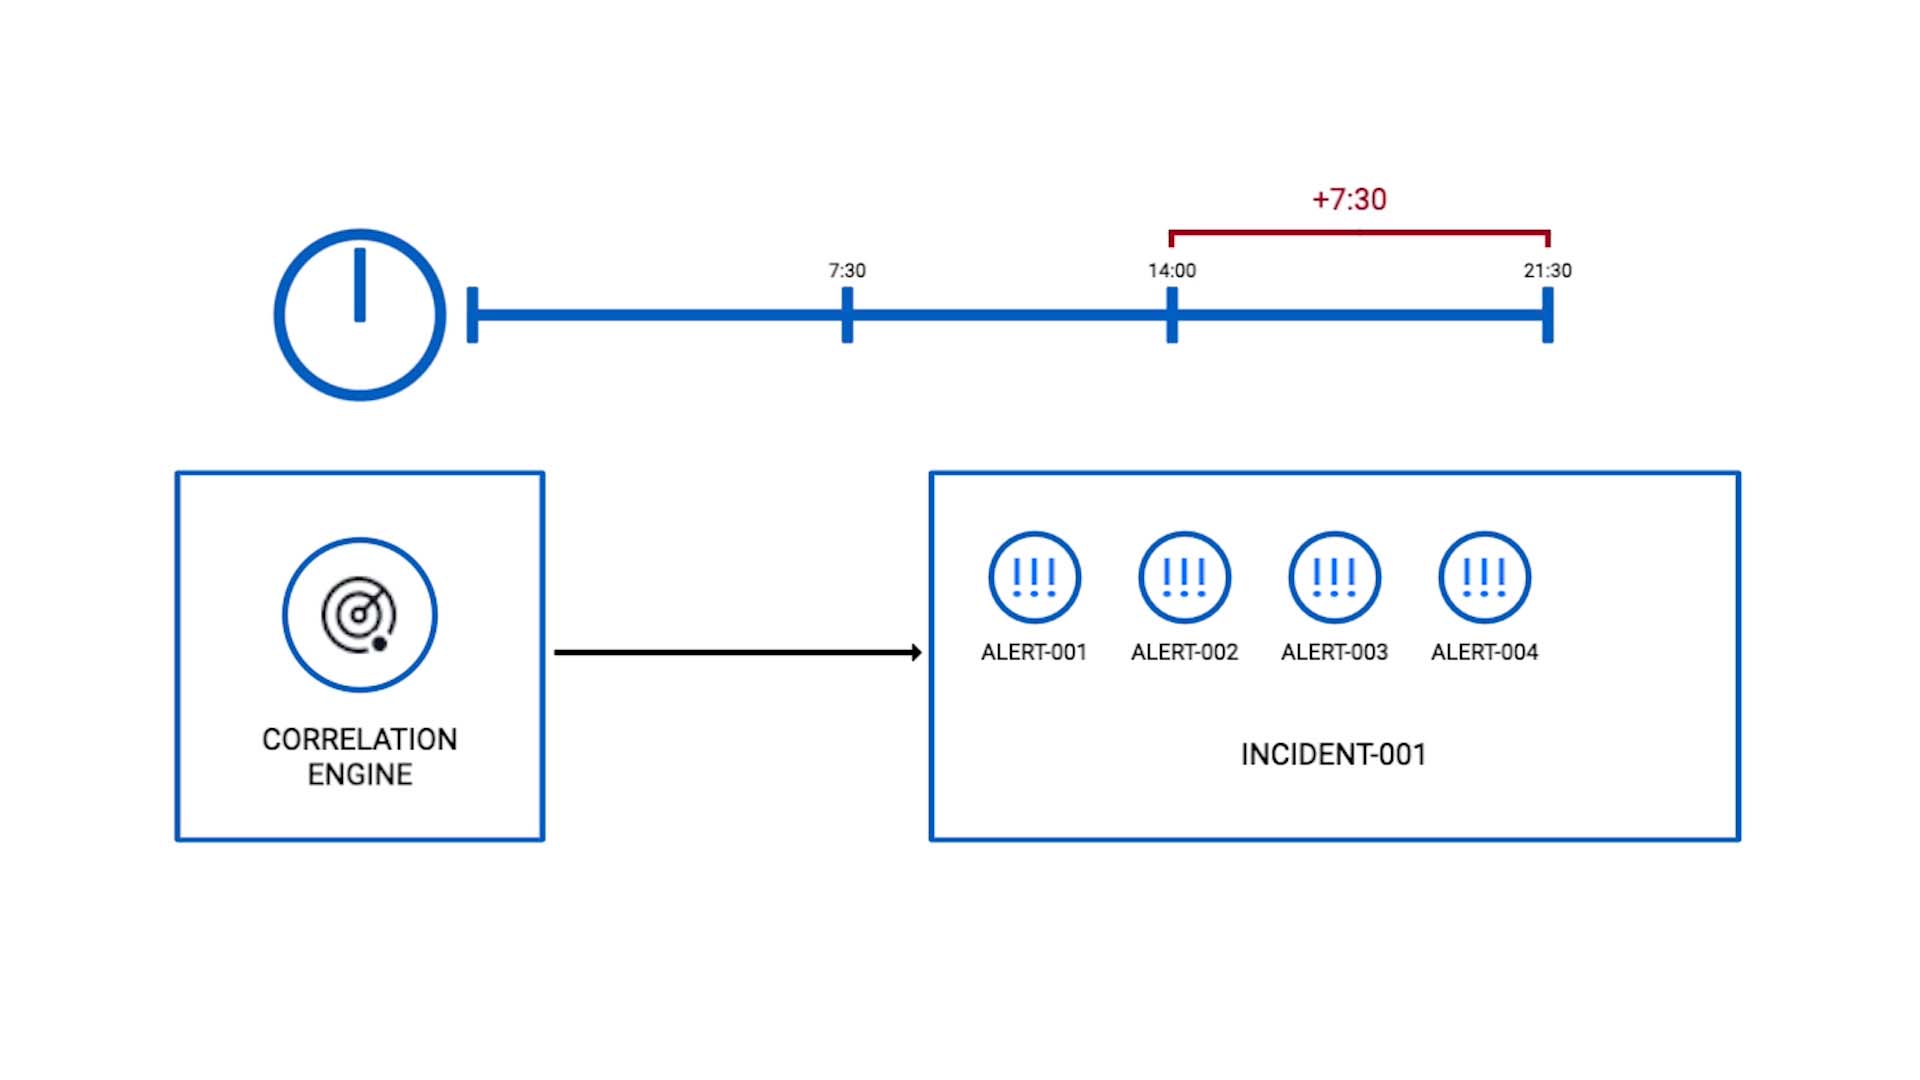
Again the key is the 50%. 50% of 15 minutes is added from the point this alert arrived. So now the time window is set to close at 21 minutes and 30 seconds.
Suppose another alert arrives within the new correlation window, at 16 minutes. The window extends again from the arrival time.
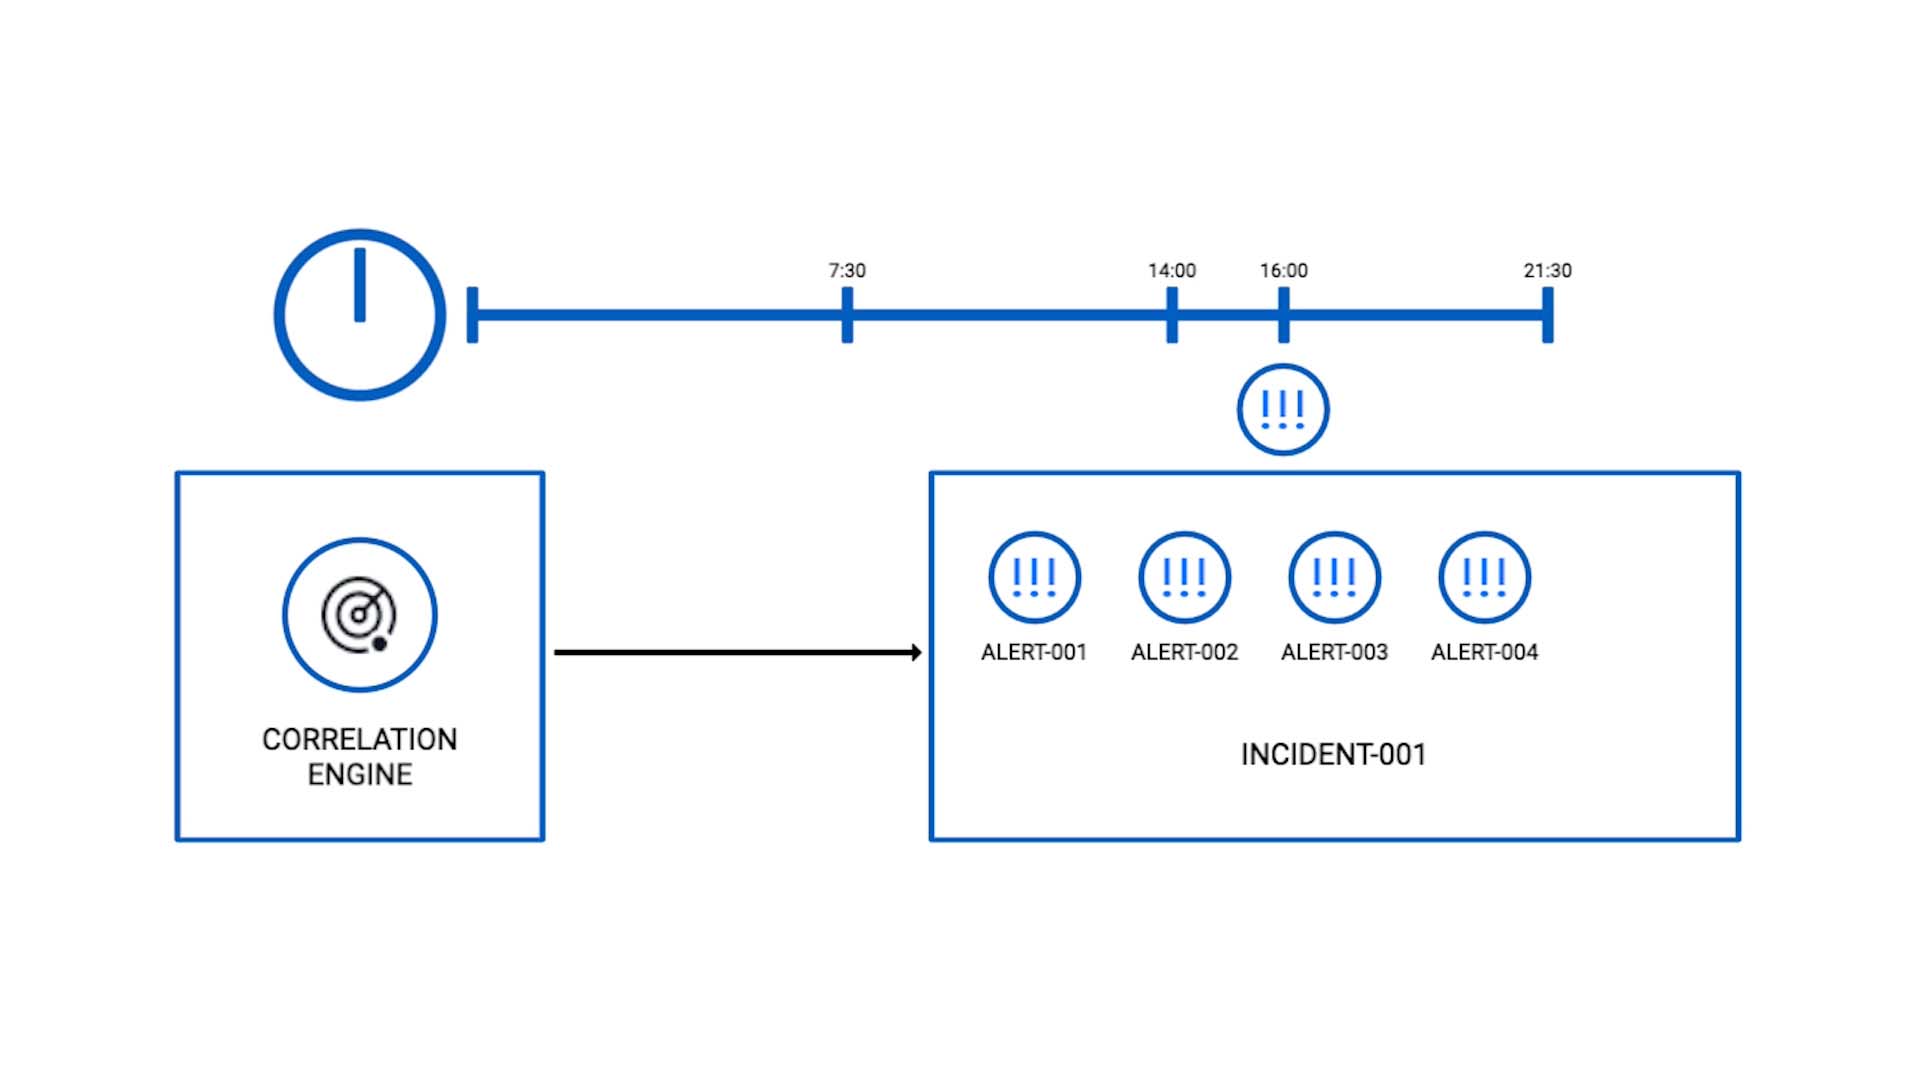
By how much? Again, 50% of the default window!
Now you know how Incident Management correlates alerts into incidents. Thanks for watching!
BASIC | 7 MIN
Moogsoft's correlation engine groups related alerts and forms incidents. This happens automatically with no configuration. But in this video, we take a sample use case and create additional correlation settings to tailor it to specific needs.
Documentation on this topic is available.
Demo video: Configure a correlation engine ►
This video explains how to configure a correlation engine in APEX AIOps Incident Management.
Incident Management’s correlation engine groups related alerts and forms incidents. This happens automatically with no configuration. But in this video, you’ll learn how to create additional correlation settings to tailor it to your specific needs.
We will use a sample use case to step through the process of surfacing the requirements and configuring the product.
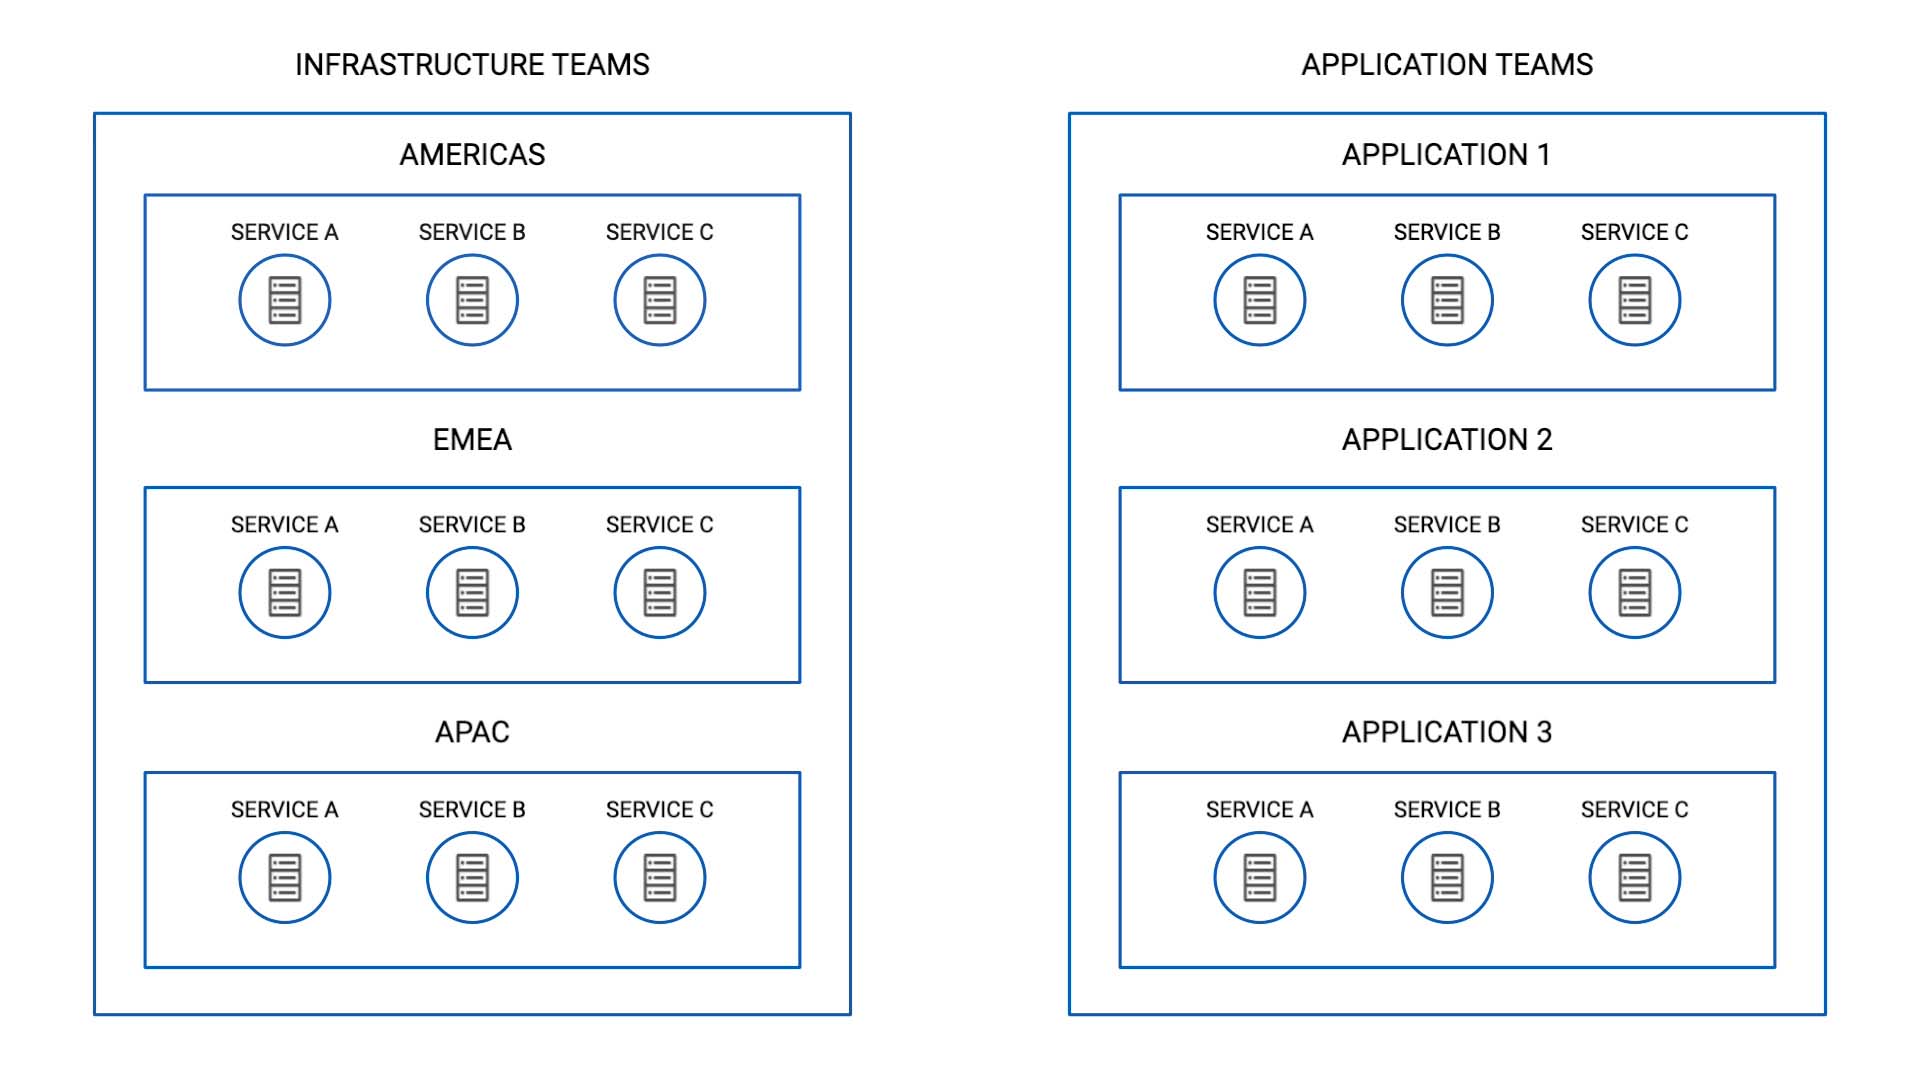
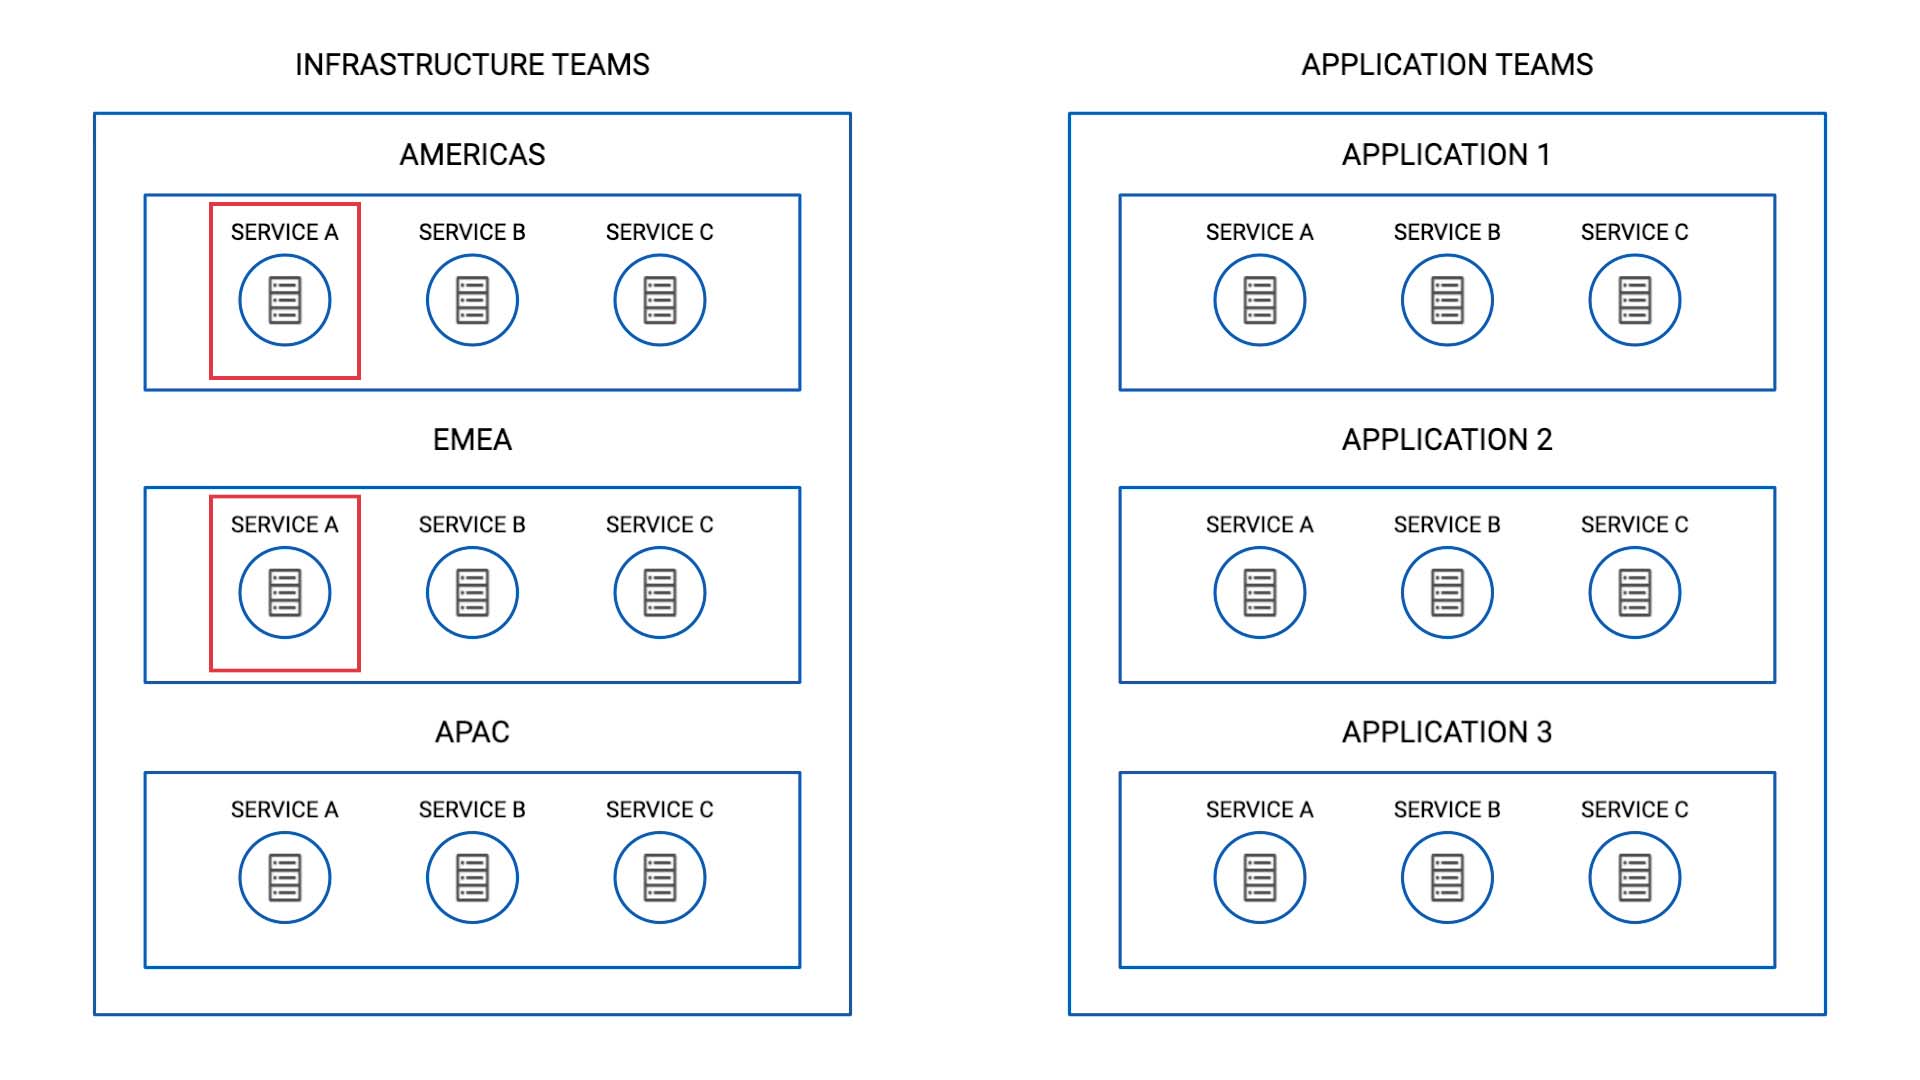
Suppose you are implementing Incident Management to facilitate collaboration between the infrastructure team and the application team.
The infrastructure team is organized by region, and each regional team breaks down into a few service categories.
So, if the server that supports service A in the US suffers, you want this team (AMERICAS - service A) and this team (Application 1 - service A) to come together and investigate.
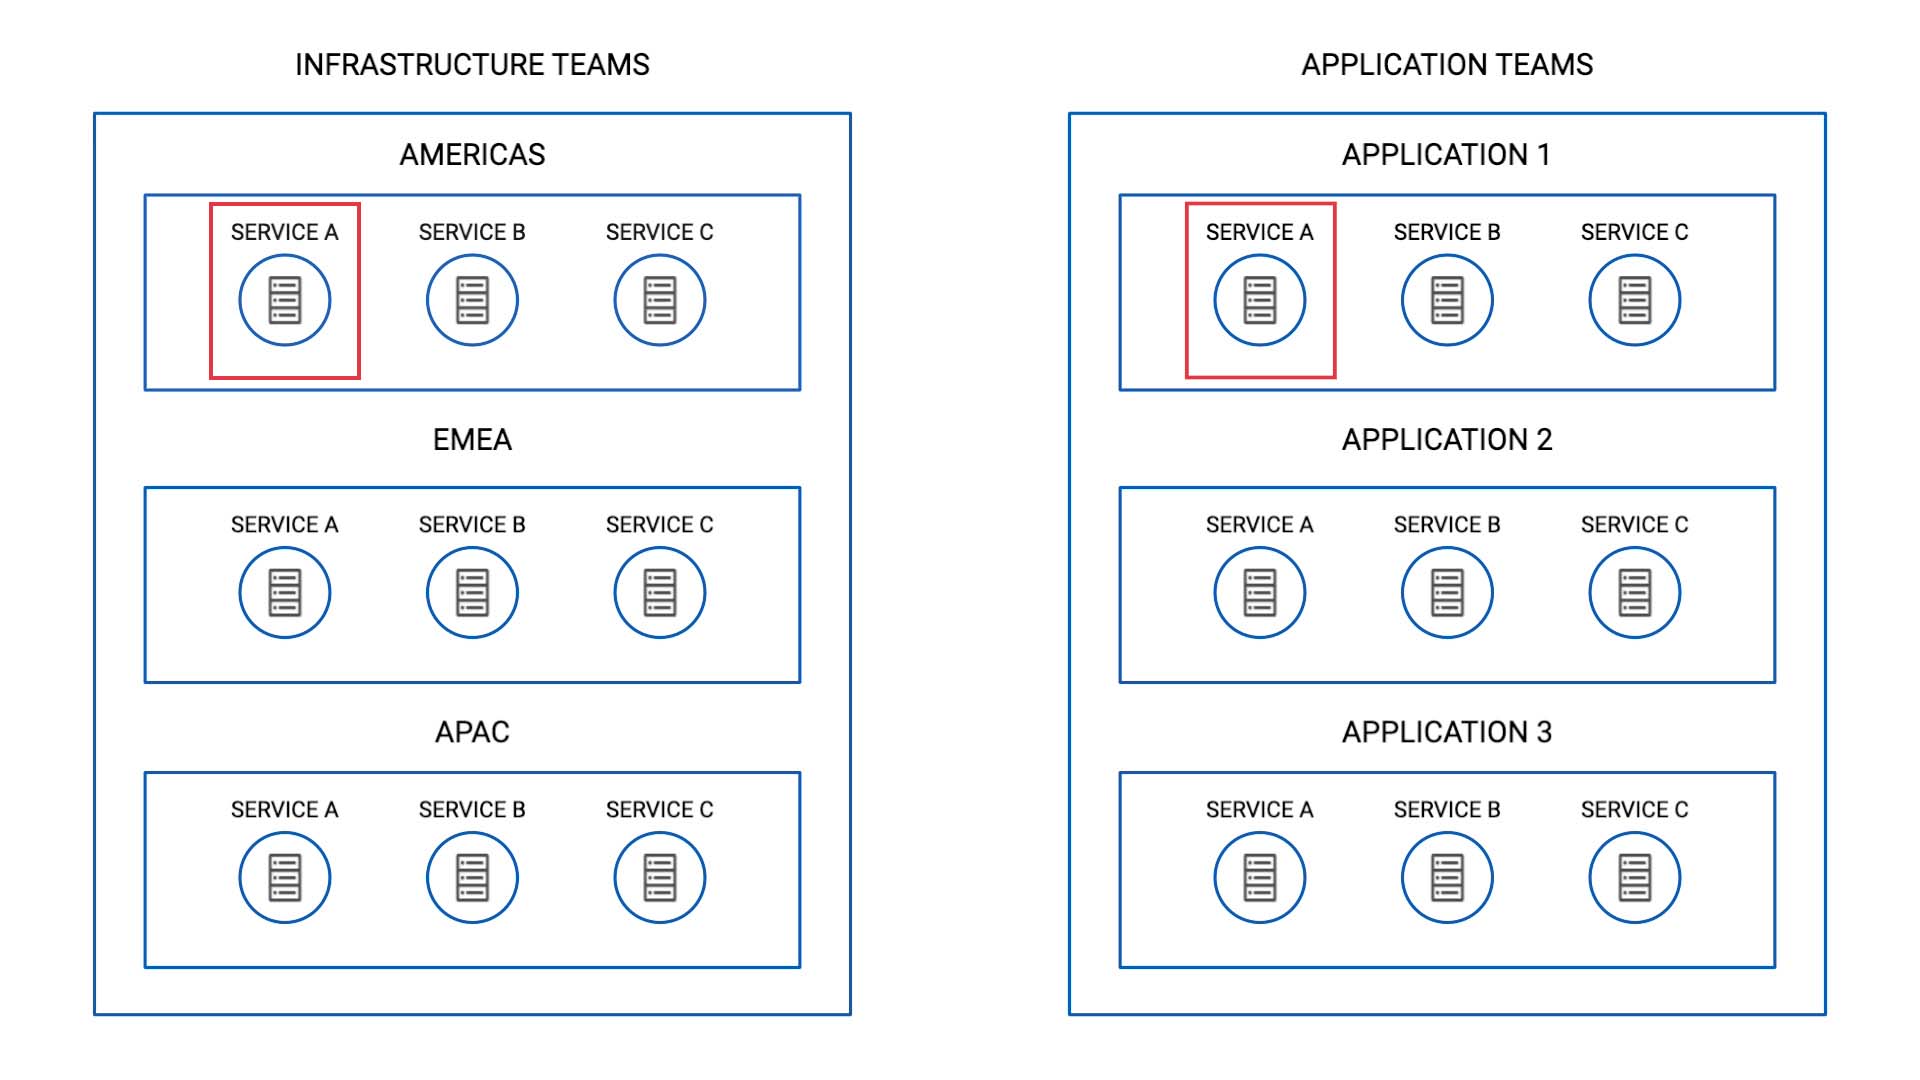
Also, since the infrastructure teams are organized by location, you need to differentiate the events originated in different regions.
So this means just because service A is impacted, you don’t want to bundle alerts from the AMERICAS and EMEA clusters together.
You also noted that in the CMDB some of the values are not spelled consistently, like this for example. But we want to treat these as the same location.

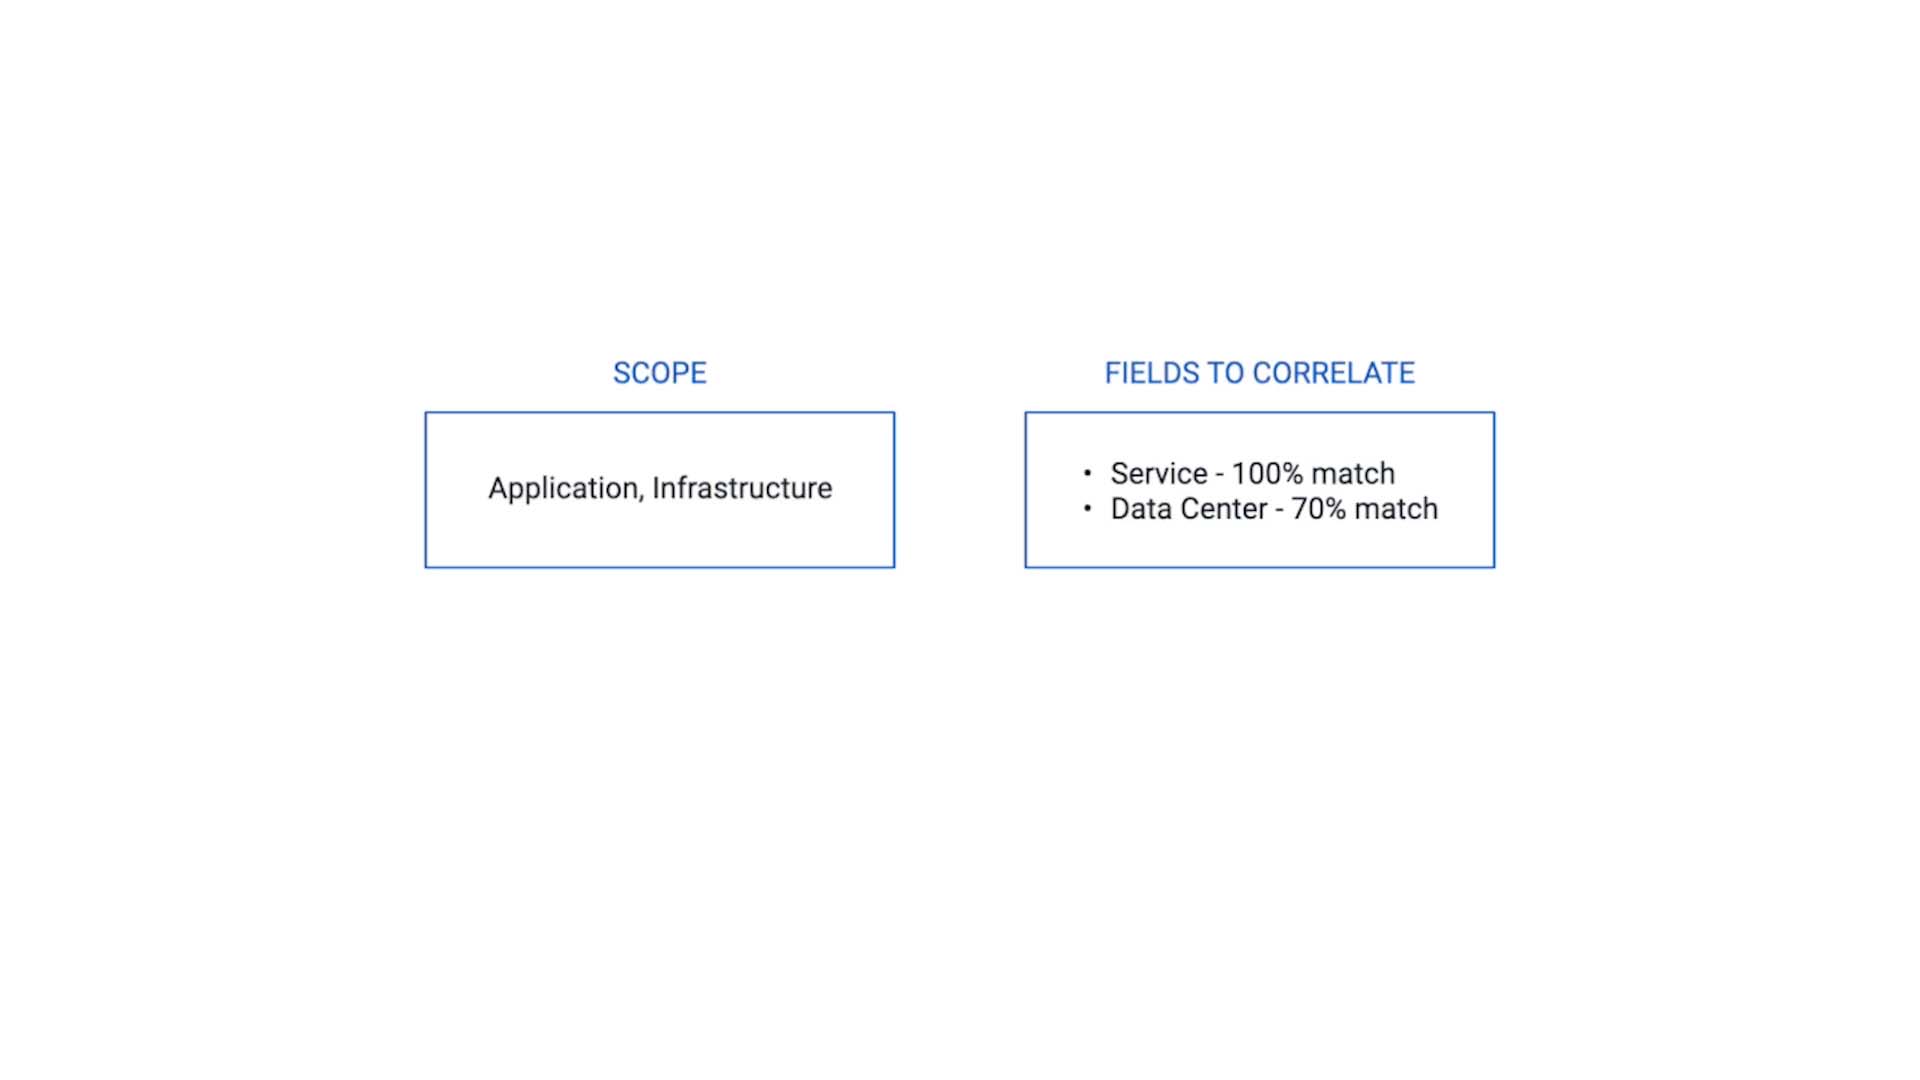
Based on the analysis so far, here’s how we want to correlate our alerts for this use case.
Evaluate only the alerts whose class are Application or Infrastructure
Service - 100% match
Data Center - 70% match to accommodate the variation in spelling.
Now let me show you how to set this up.
Provide a name that makes sense to other administrators, too.
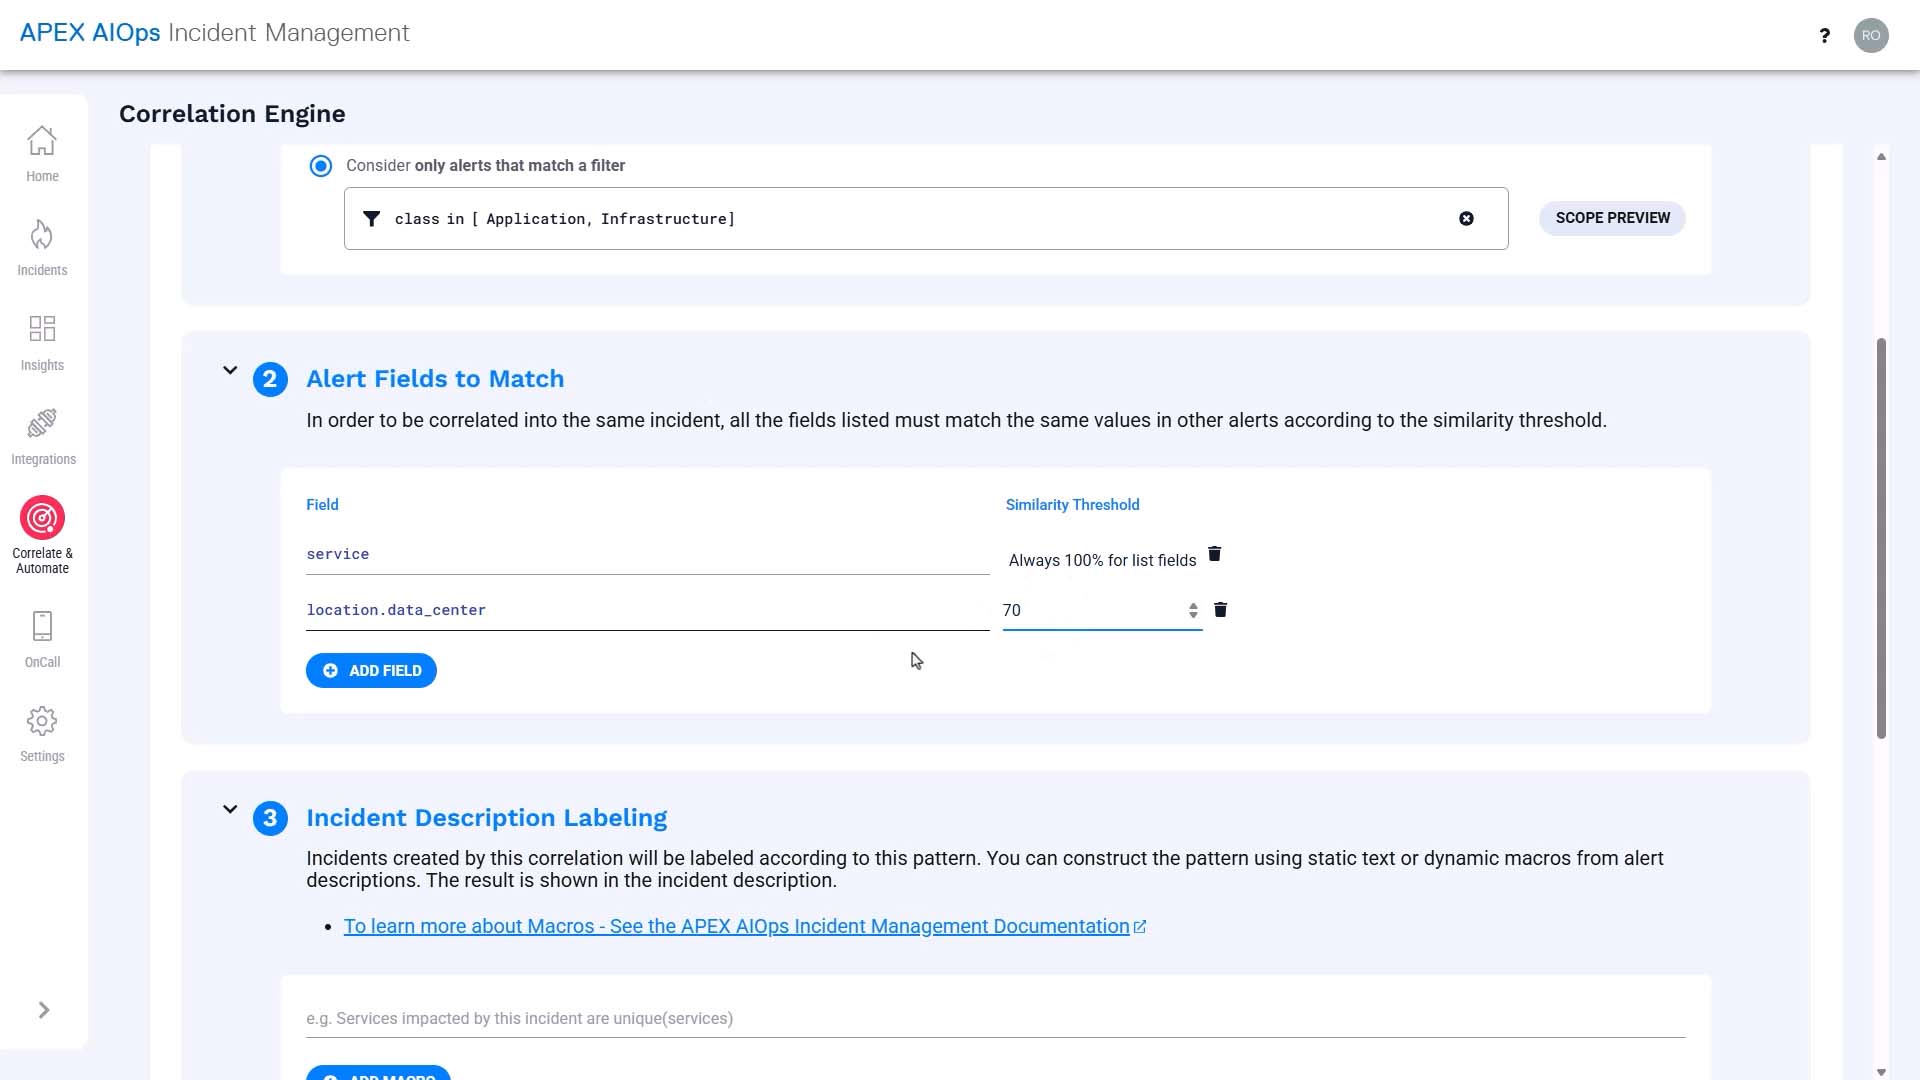
Scope is basically an entry filter.
In our use case, this correlation only applies to the alerts whose class is application or infrastructure.
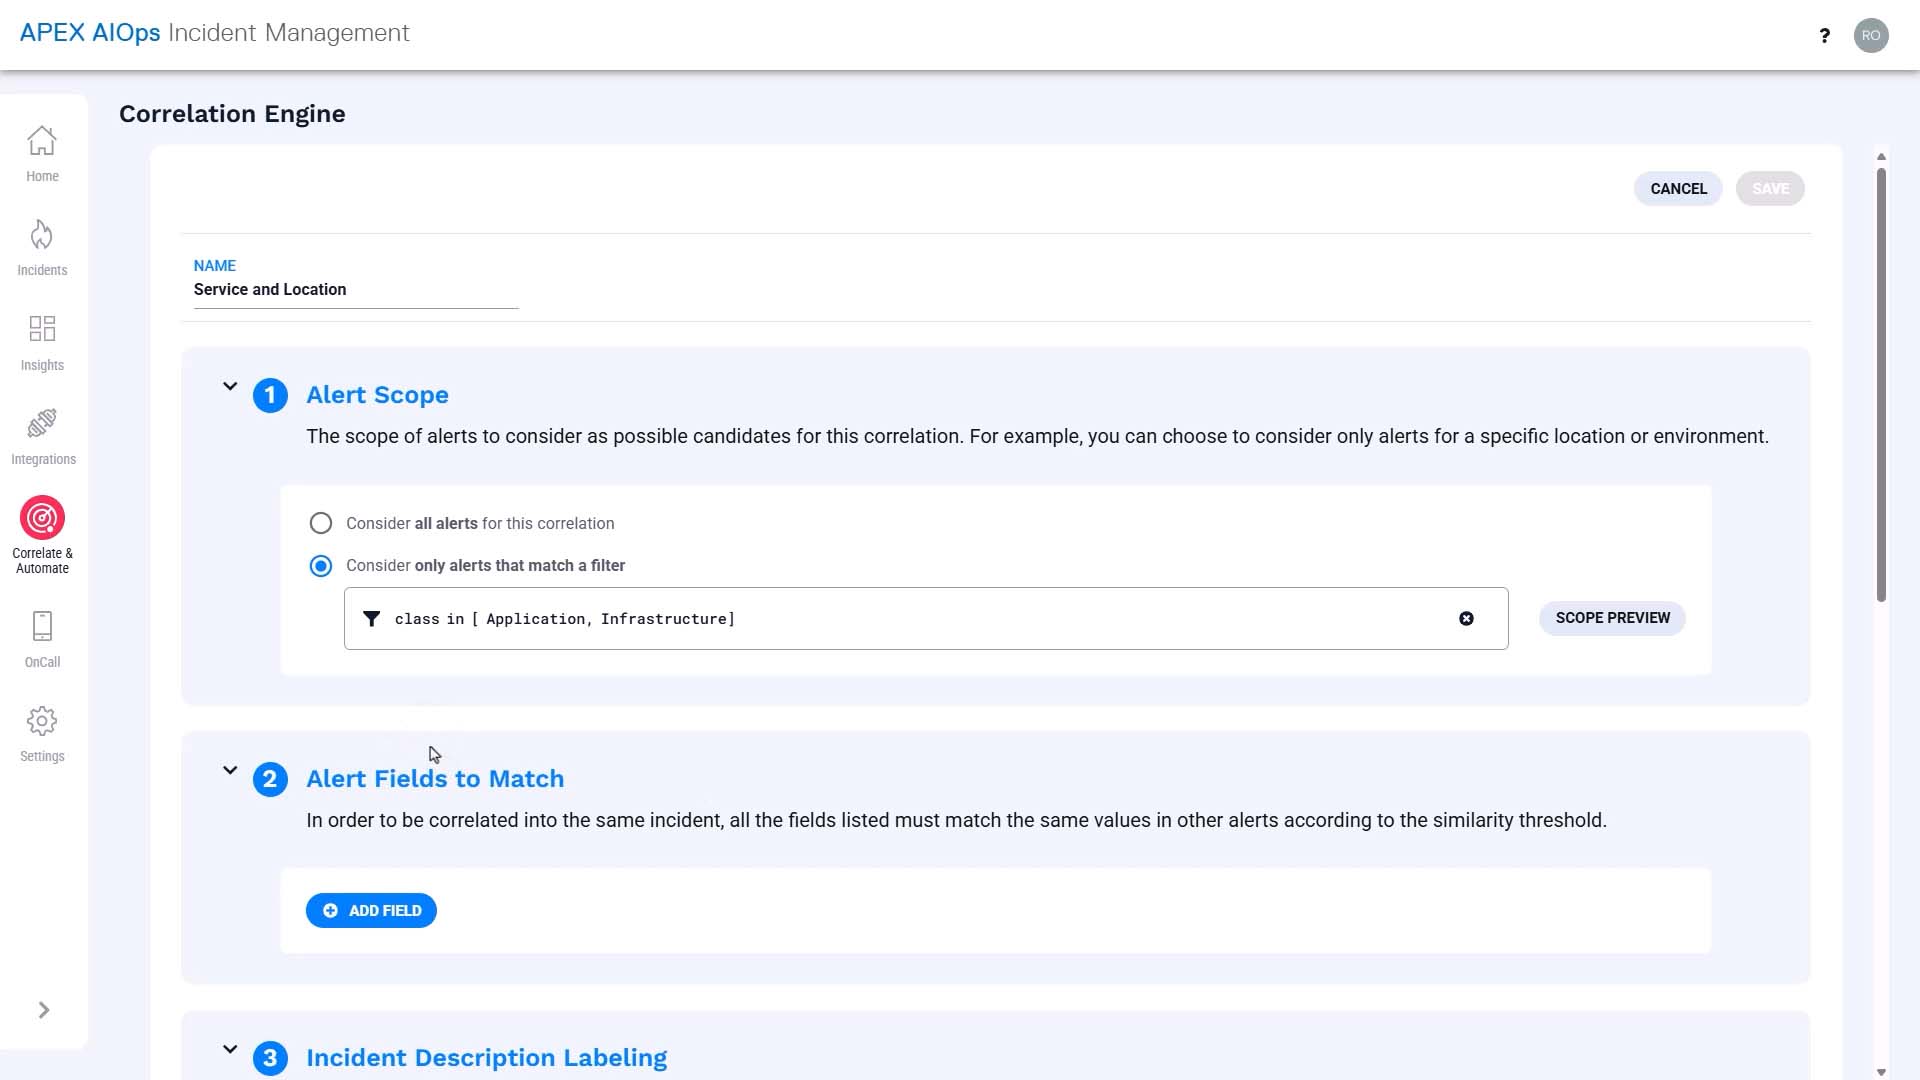
And we want to cluster alerts from the same service. Service defaults to 100% similarity because it is a list-based field.
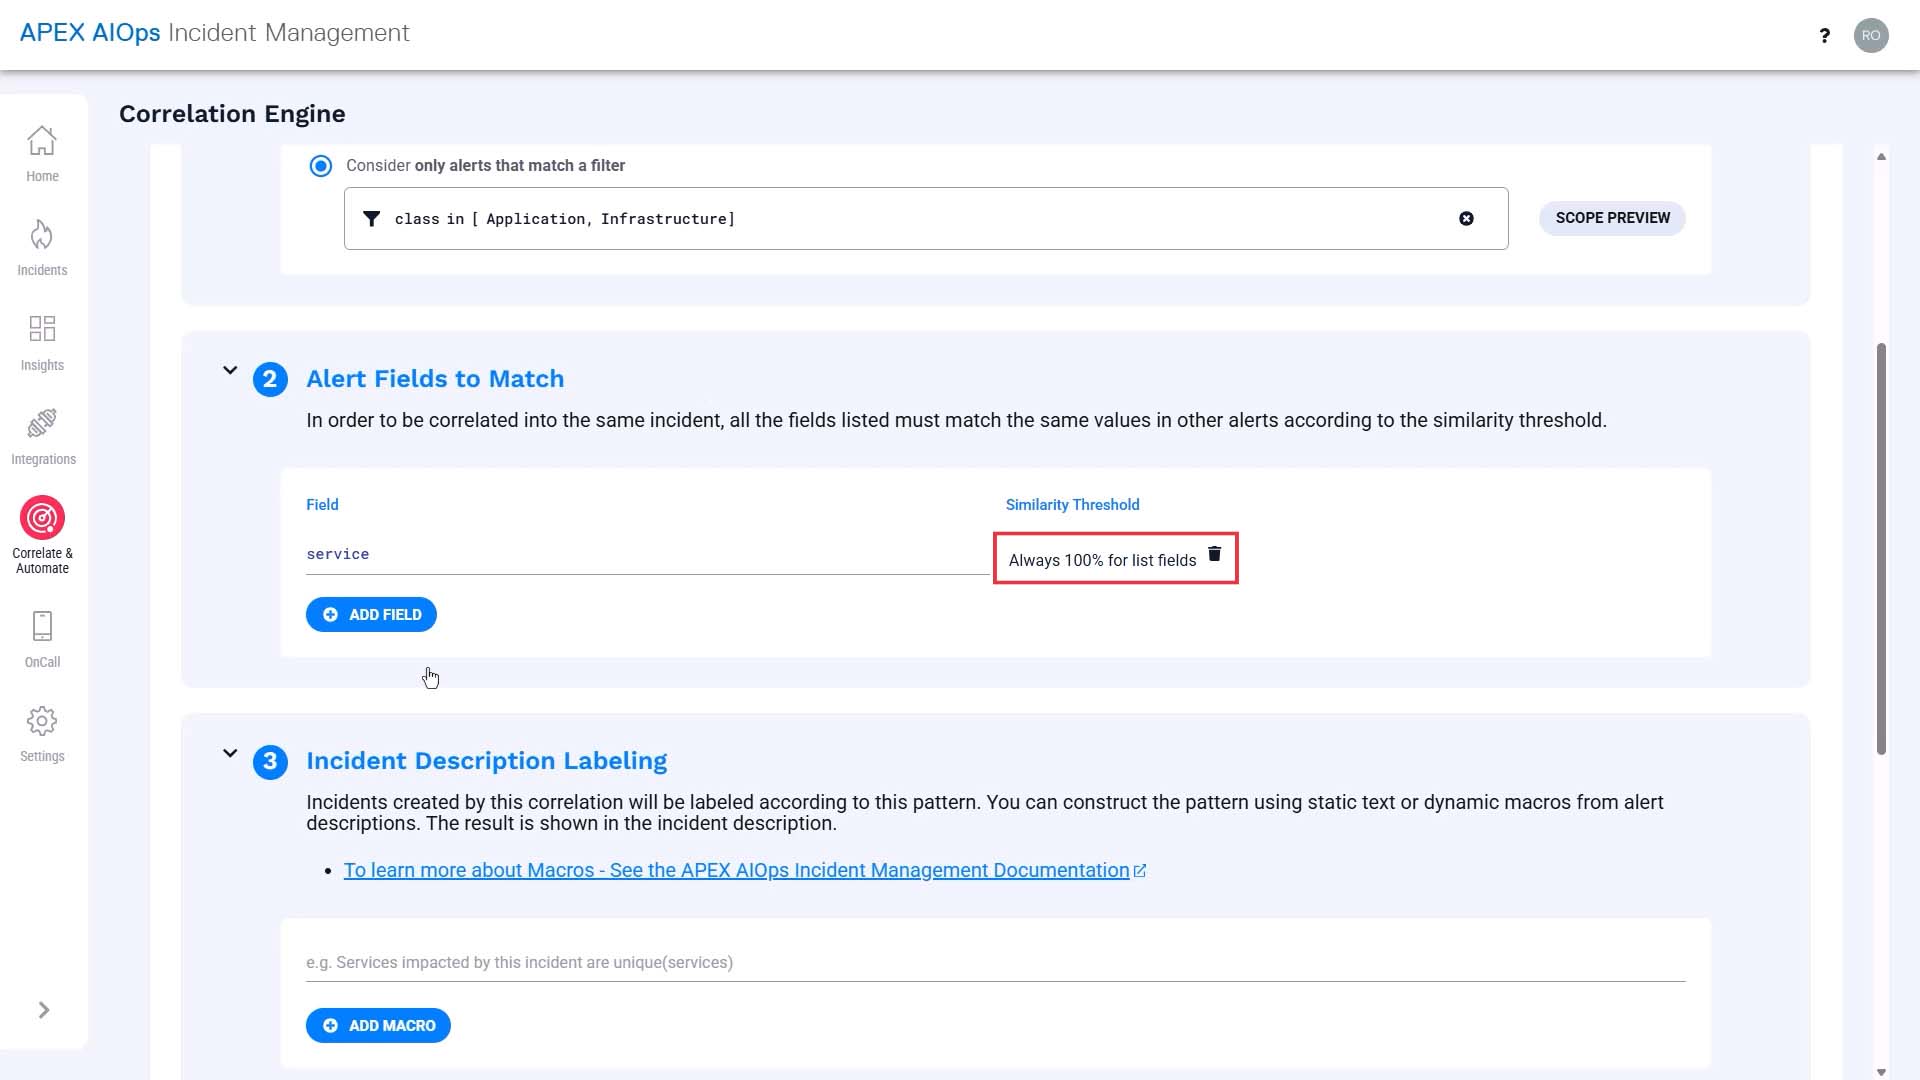
And we want to cluster alerts from the same location, but considering the variation in spelling, we’ll set the similarity value at 70%.
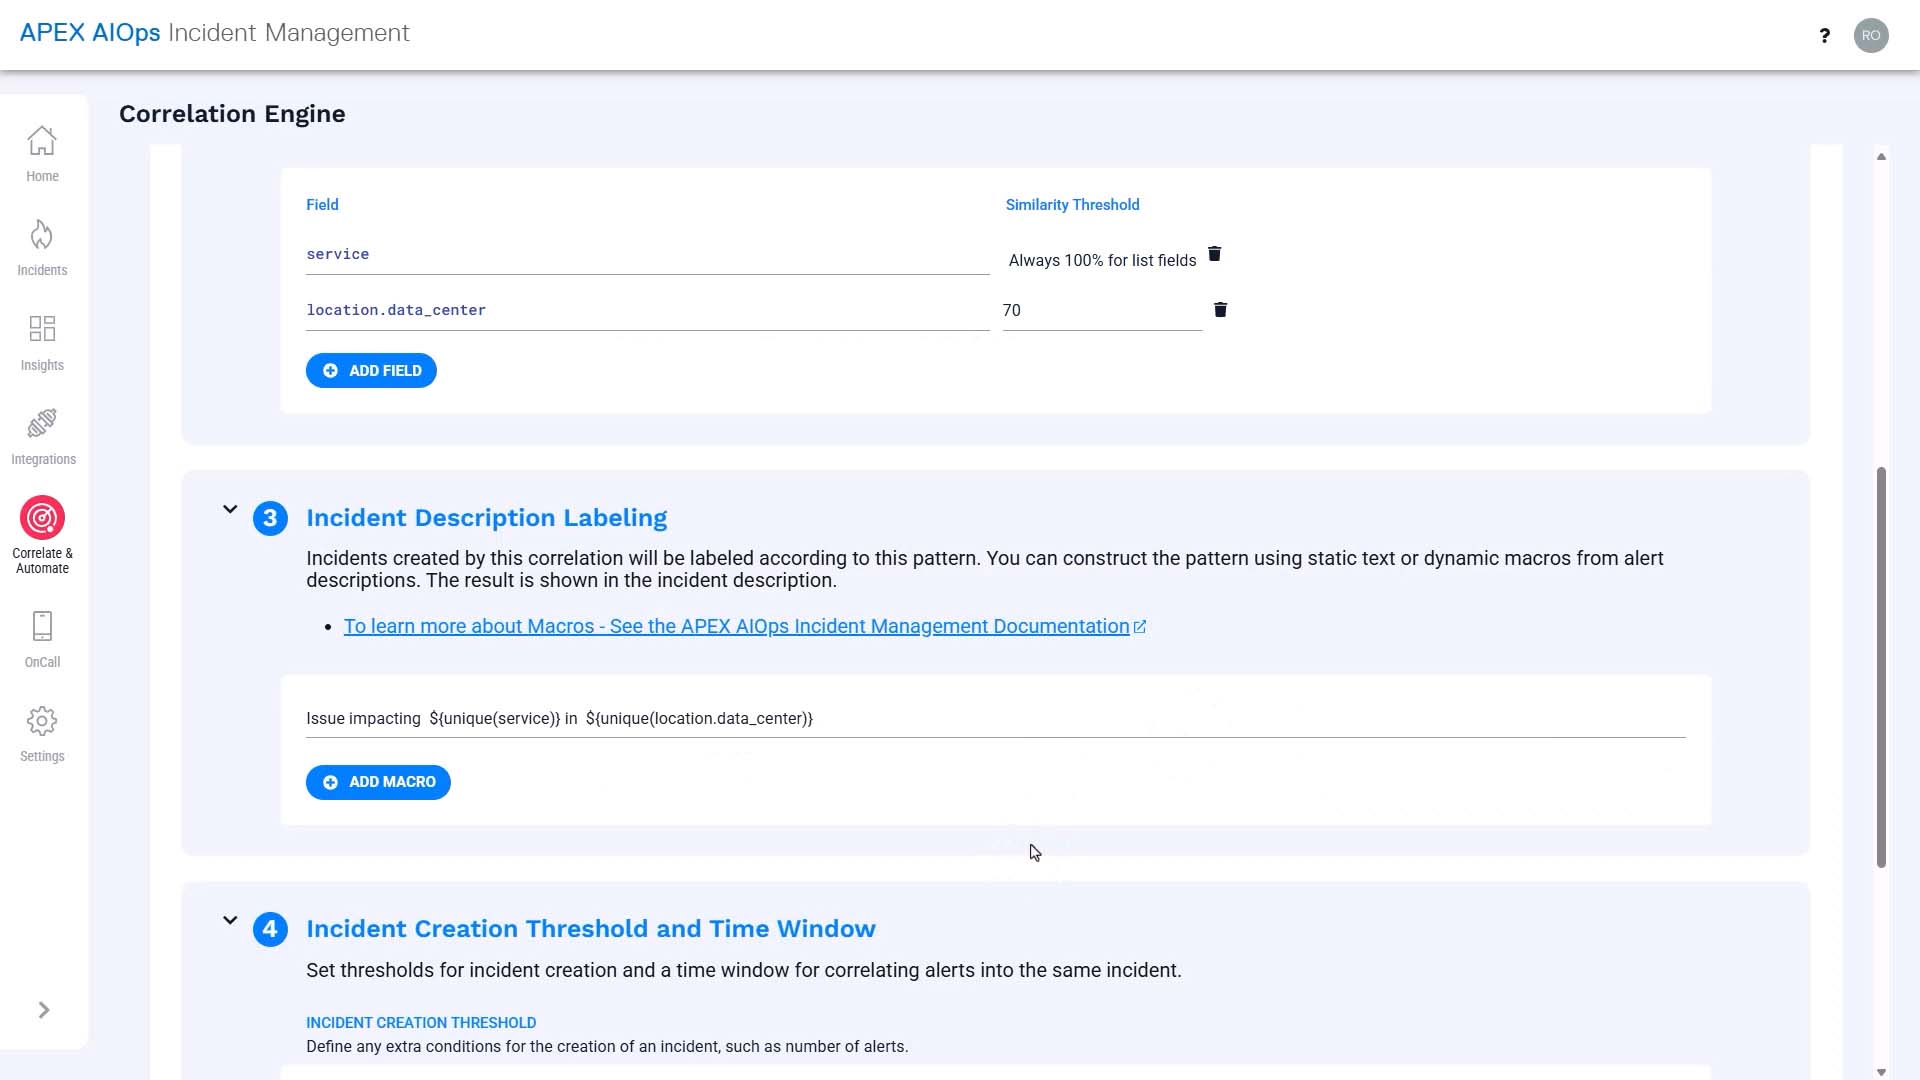
What you put into the description field will be used as the incident description, so you want to make it as helpful as possible.
We are going to use macros to insert dynamic information here.
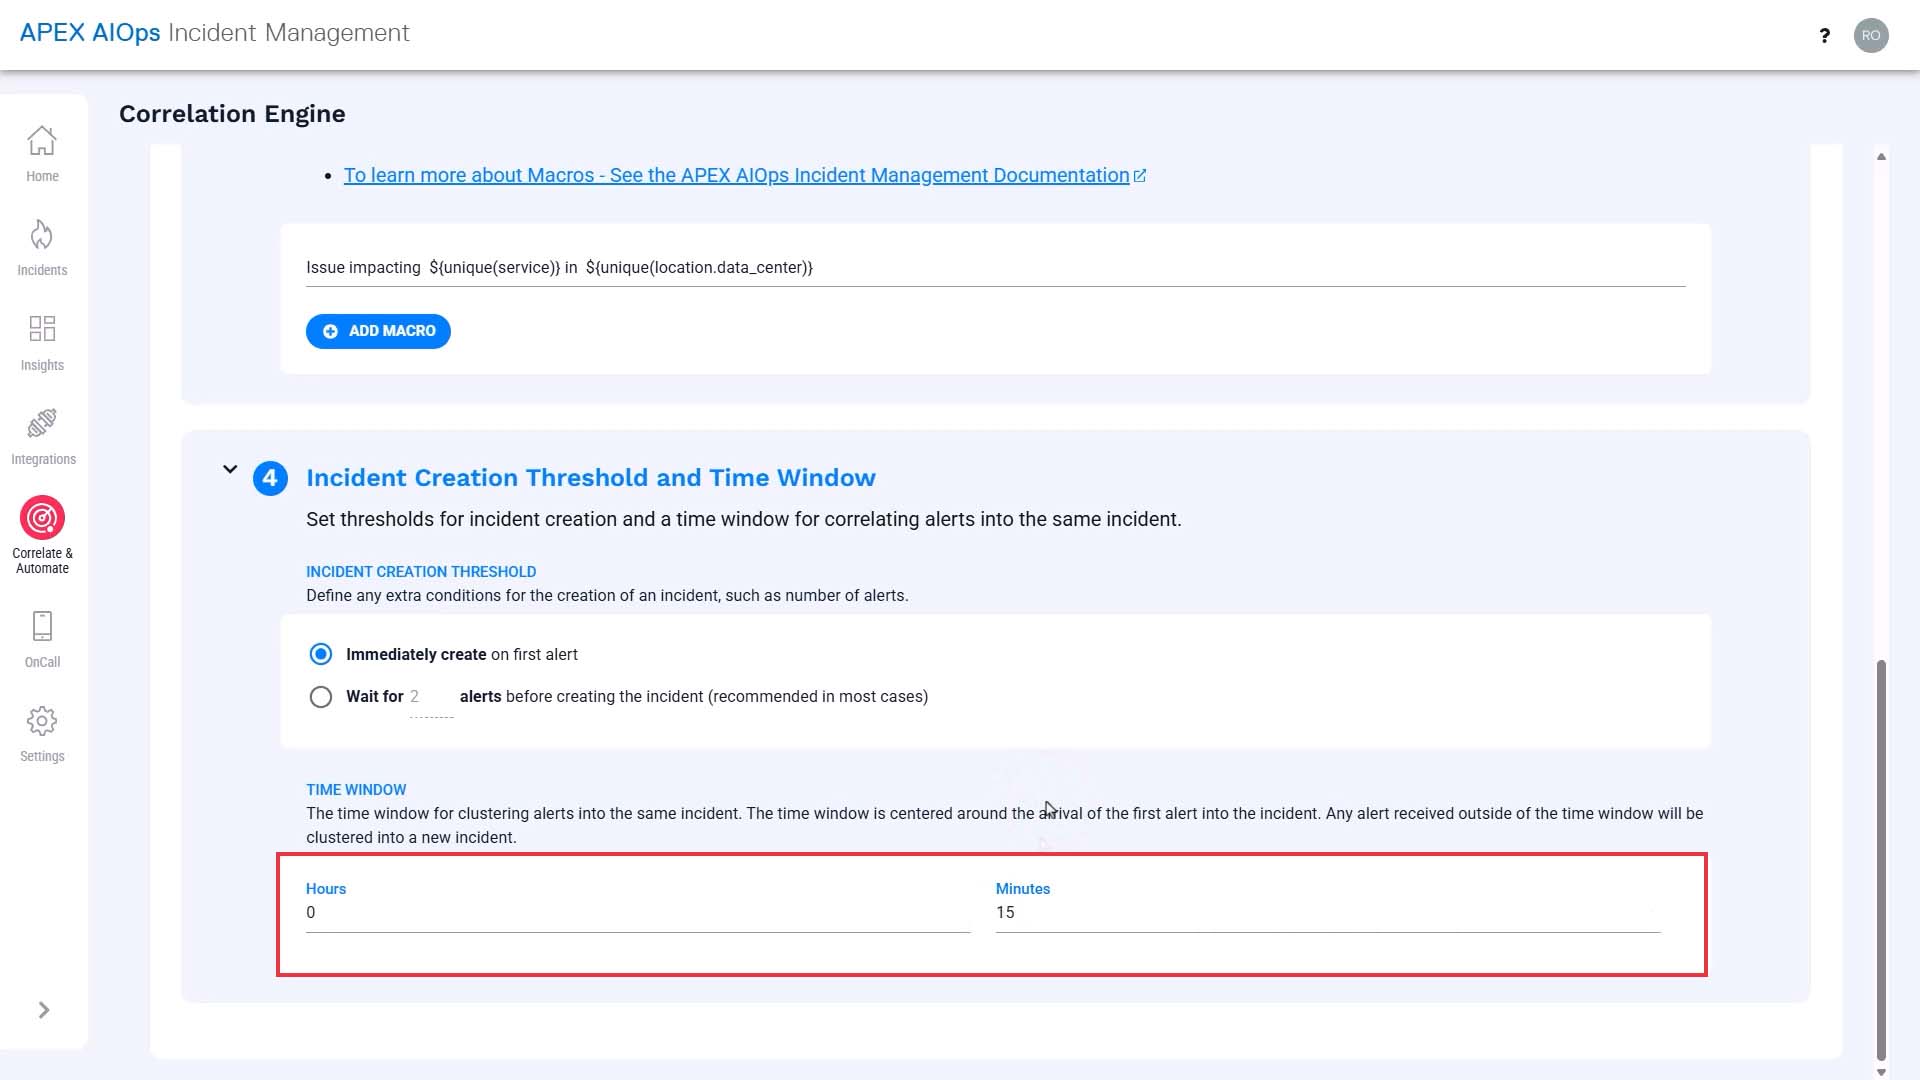
We’ll set the time window to 15 minutes. To understand the correlation time window, watch the “Alert Correlation Method in Incident Management” video.
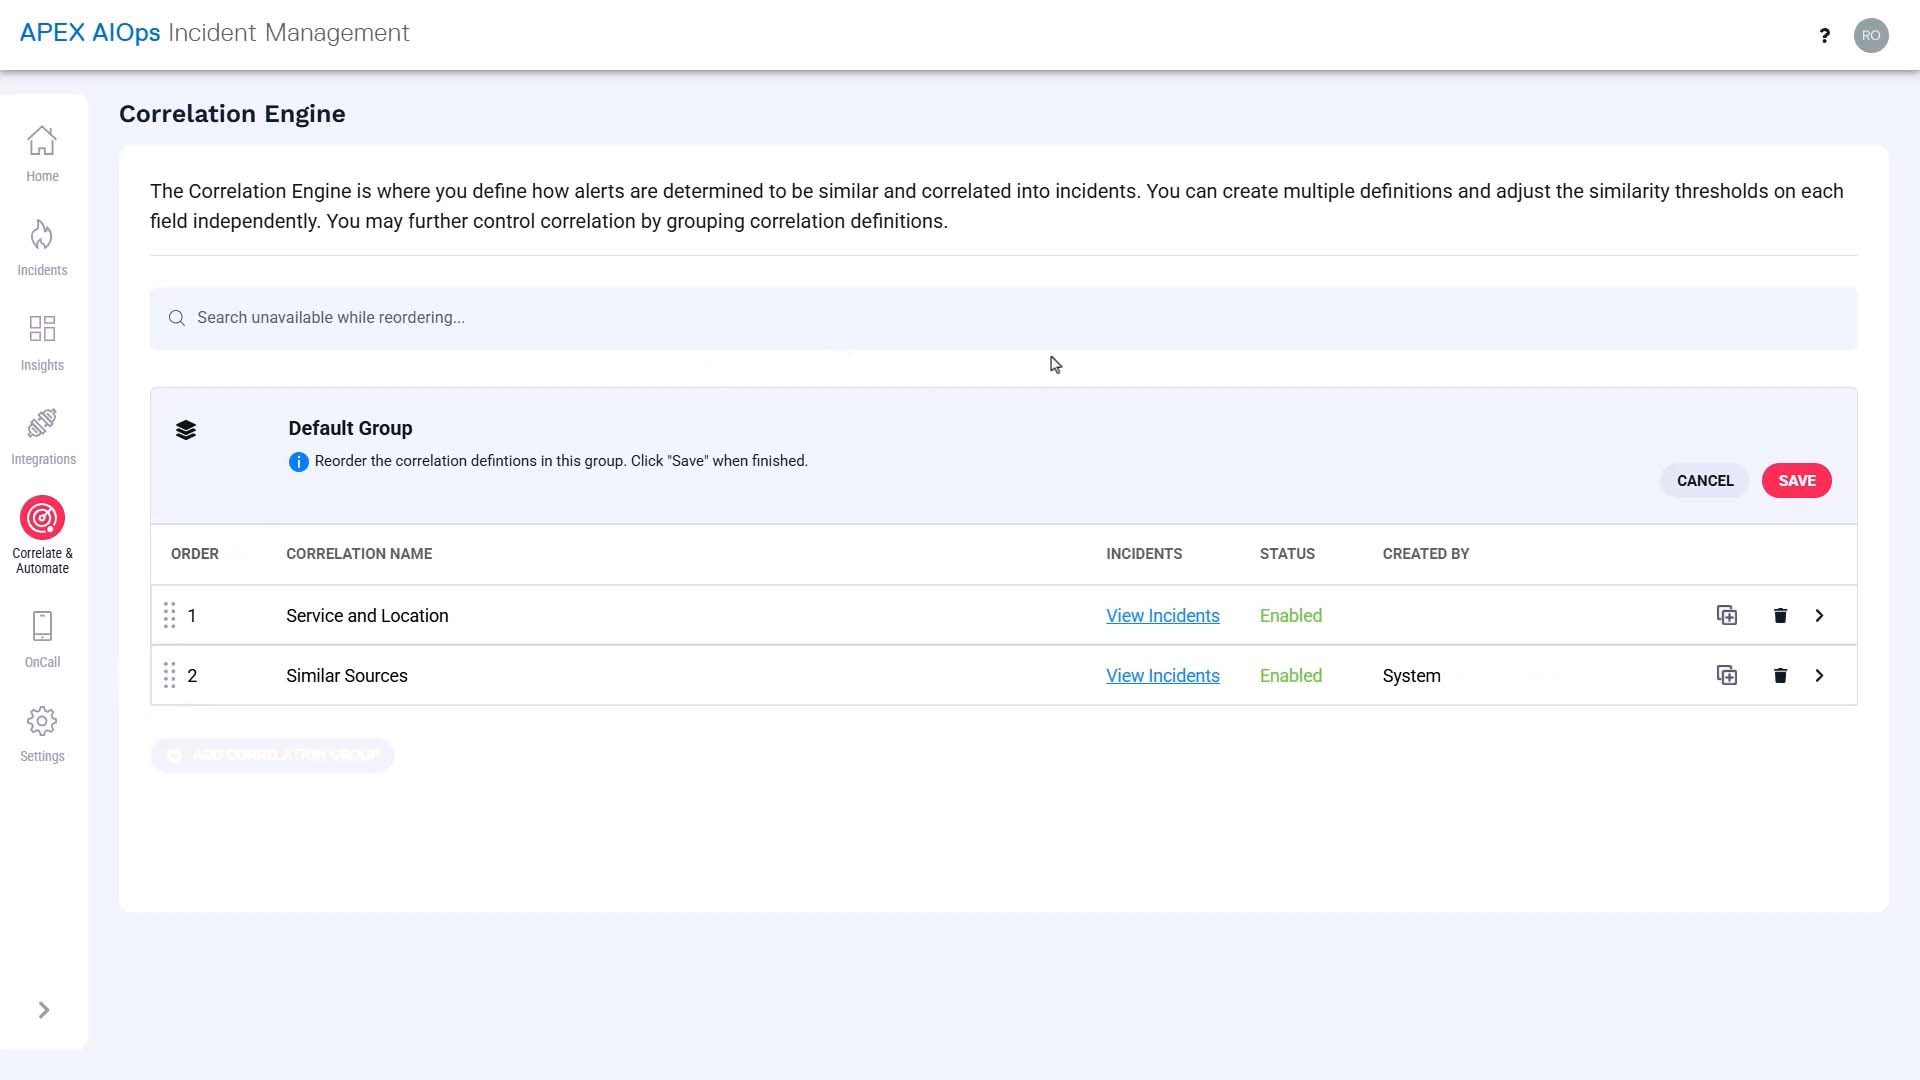
Now, let’s also modify the correlation group settings, so the alerts evaluated by the new correlation setting won’t be evaluated by the default correlation, and end up in two separate incidents.
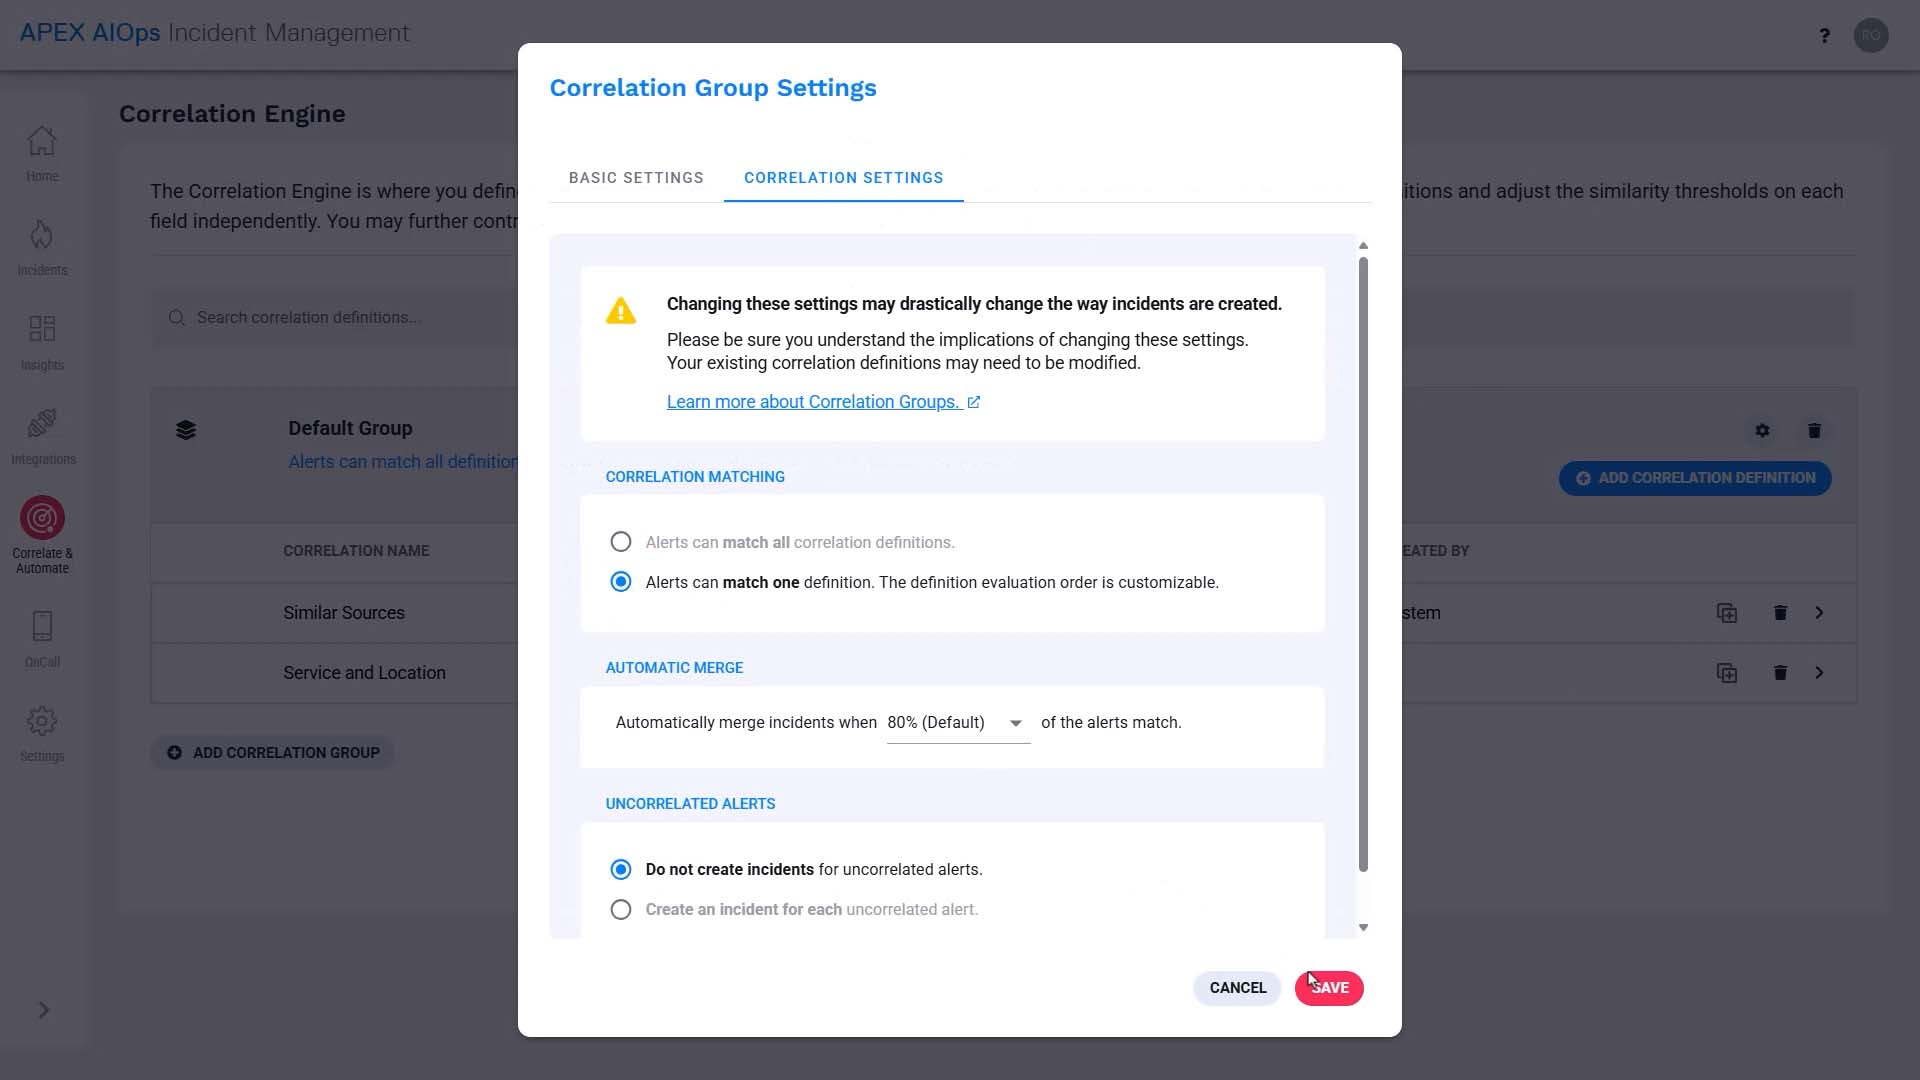
Let's change the order so our new definition is evaluated first.
Now let’s simulate what happens to the alerts with this new correlation definition.
Here’s the scenario. The server in our San Francisco data center that supports a database query service has overheated and started to fail. Of course, no one knows that yet.
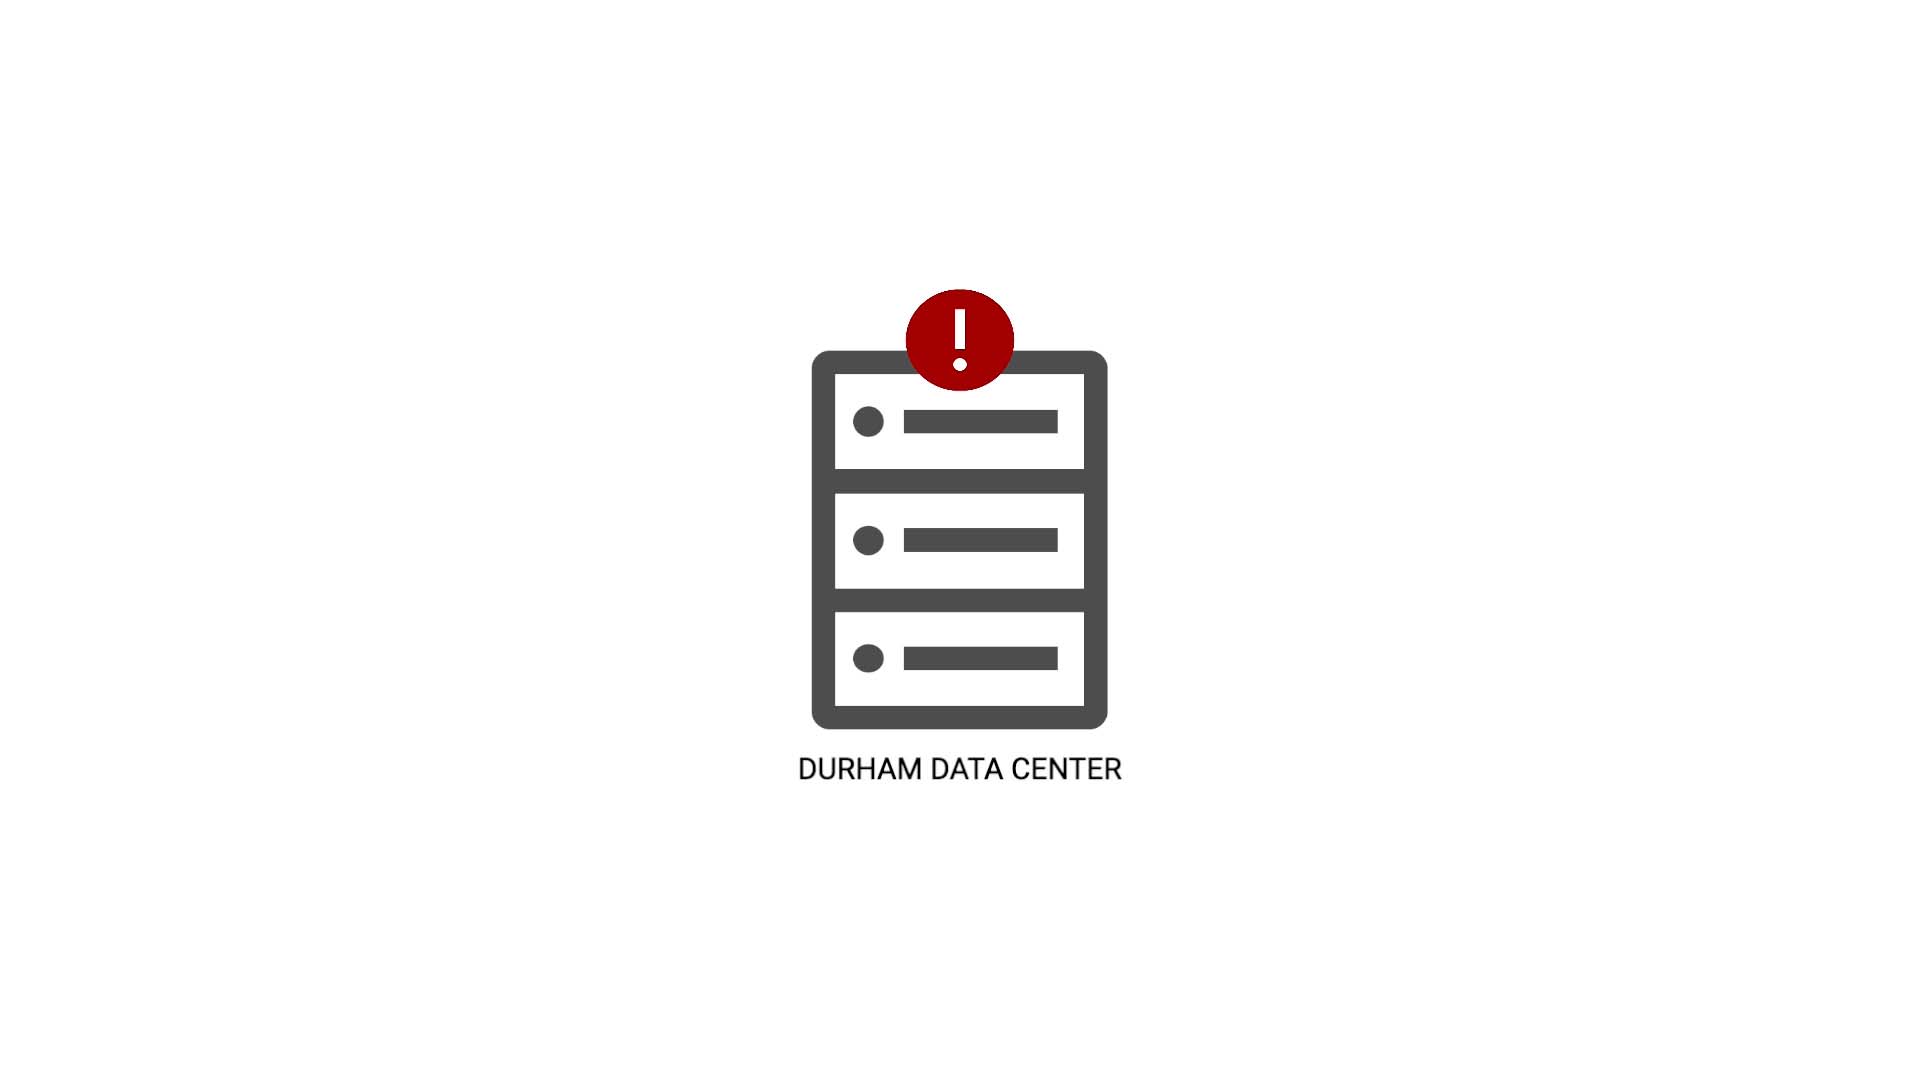
The first event comes in…
The event goes through enrichment to add value to the service field and gets deduplicated into an alert.
Right now, this is the first event of its kind so it simply becomes an alert, but of course if another event with the same dedupe key value arrives, it will be deduplicated into this alert.
Now it arrives at the correlation engine.
The class field value meets the scope, so it enters the correlation we just configured.
Since this is the very first one, it becomes an incident on its own.
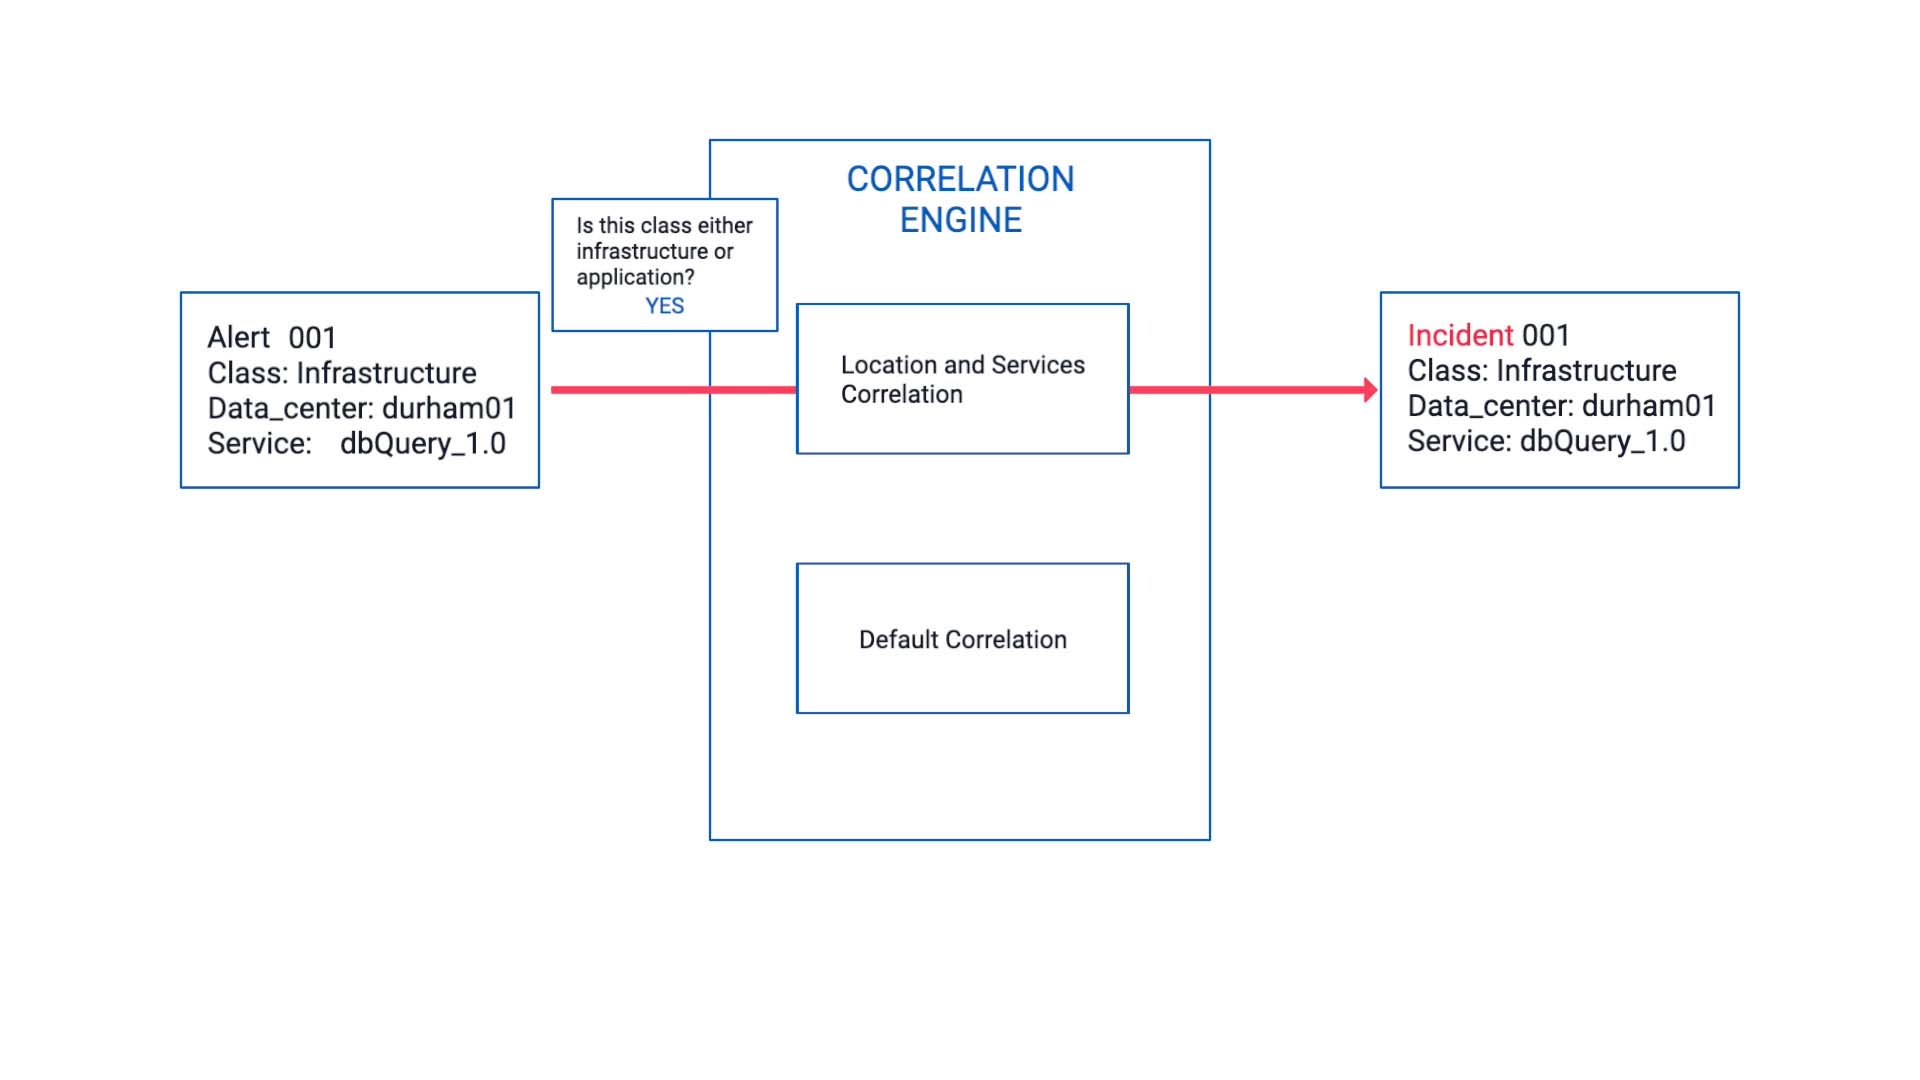
The next event arrives.
It is also impacting the same service as the last event but note that its class value is not Infrastructure or Application.
So, it is filtered by the correlation we set up. Instead, it goes into the default correlation and becomes a new and separate incident.
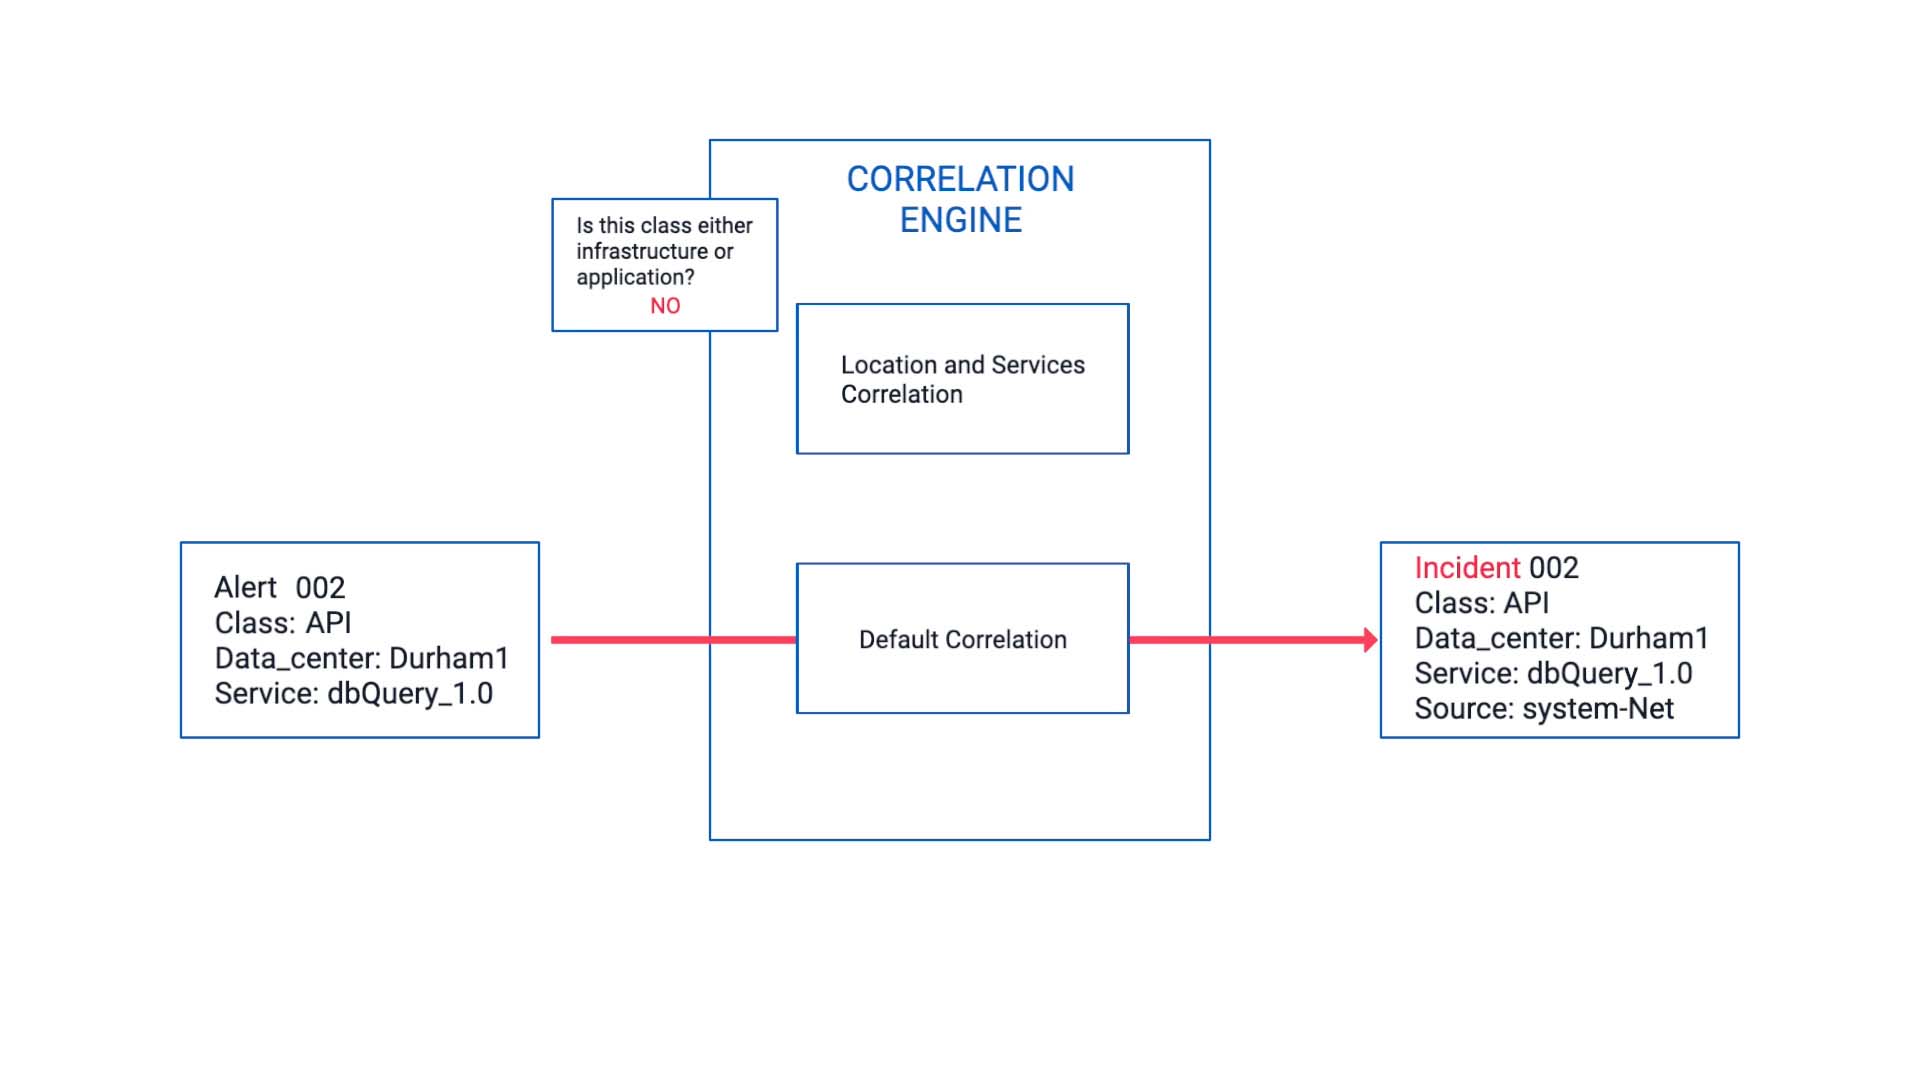
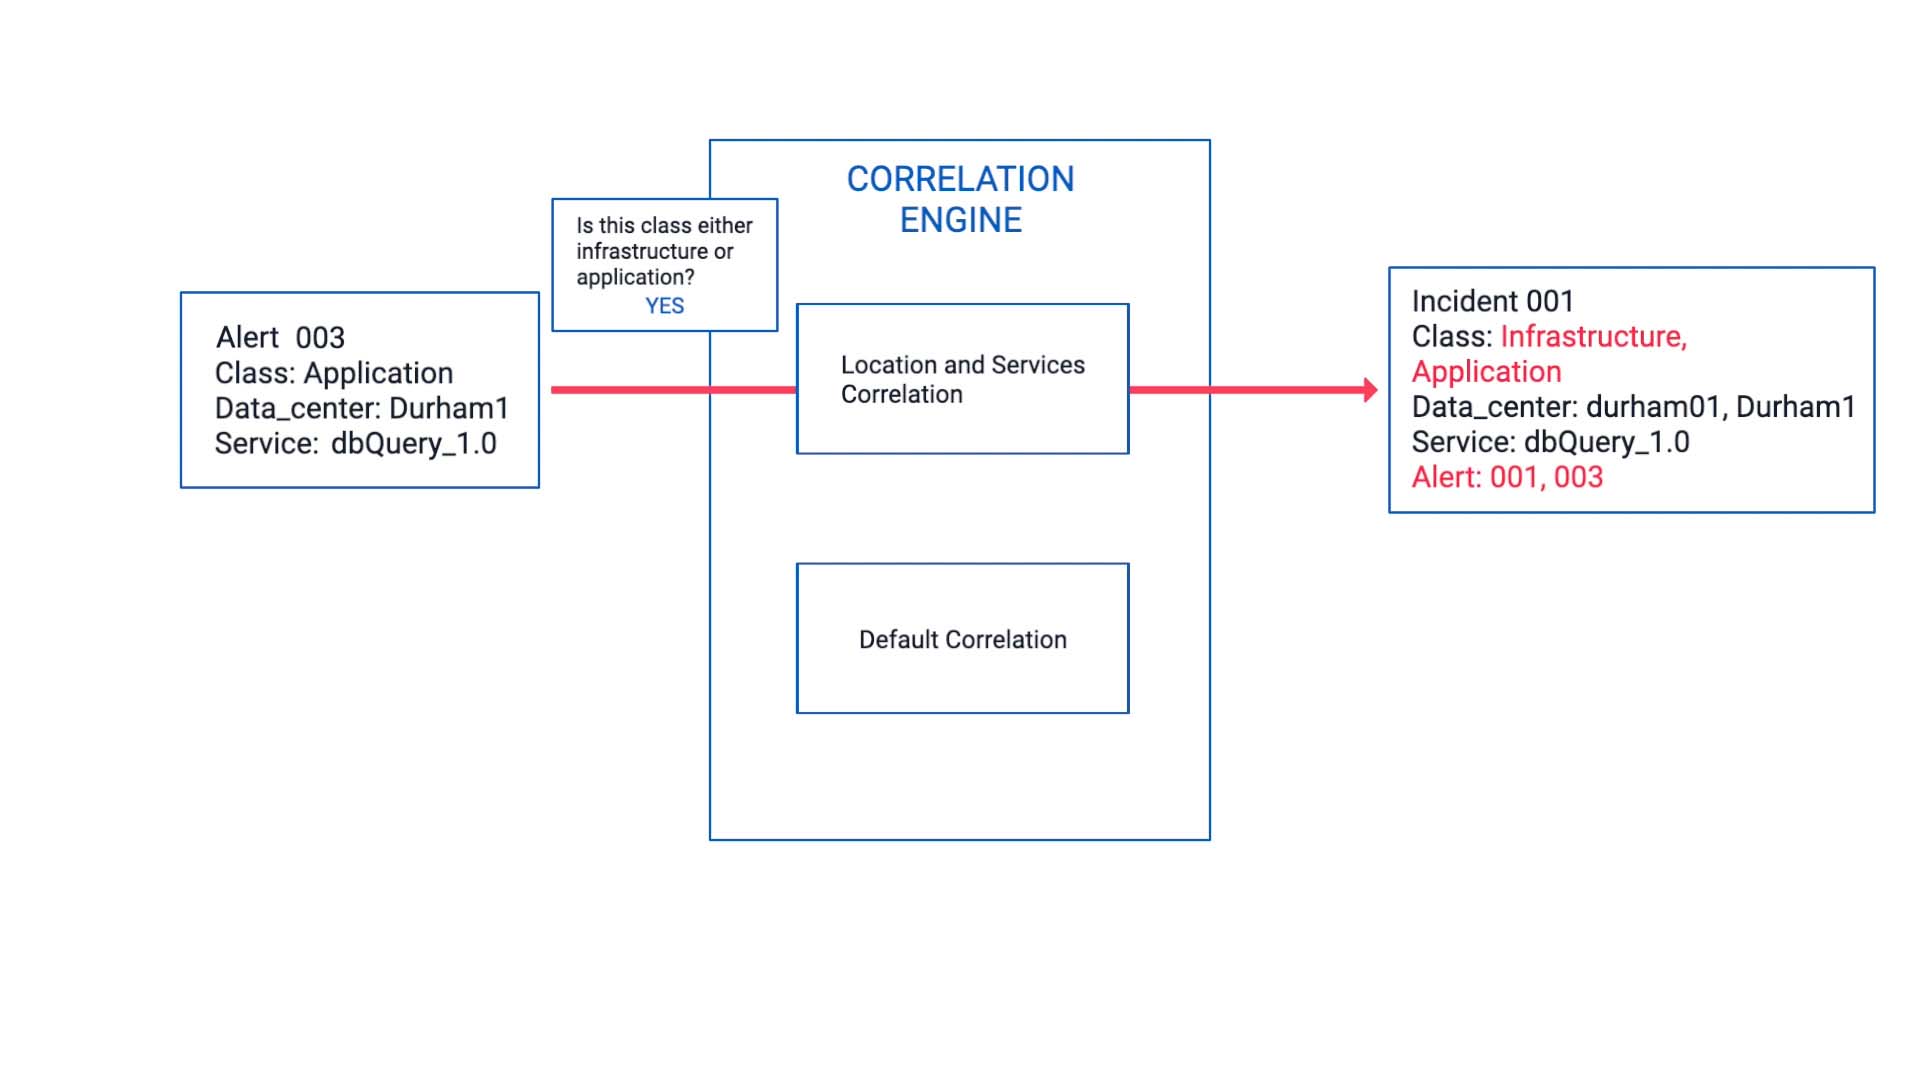
Here comes another event. It’s enriched, deduplicated, and...
Now, this meets the correlation criteria we’ve defined, so this alert is bundled together with the first alert and becomes part of the incident 001.
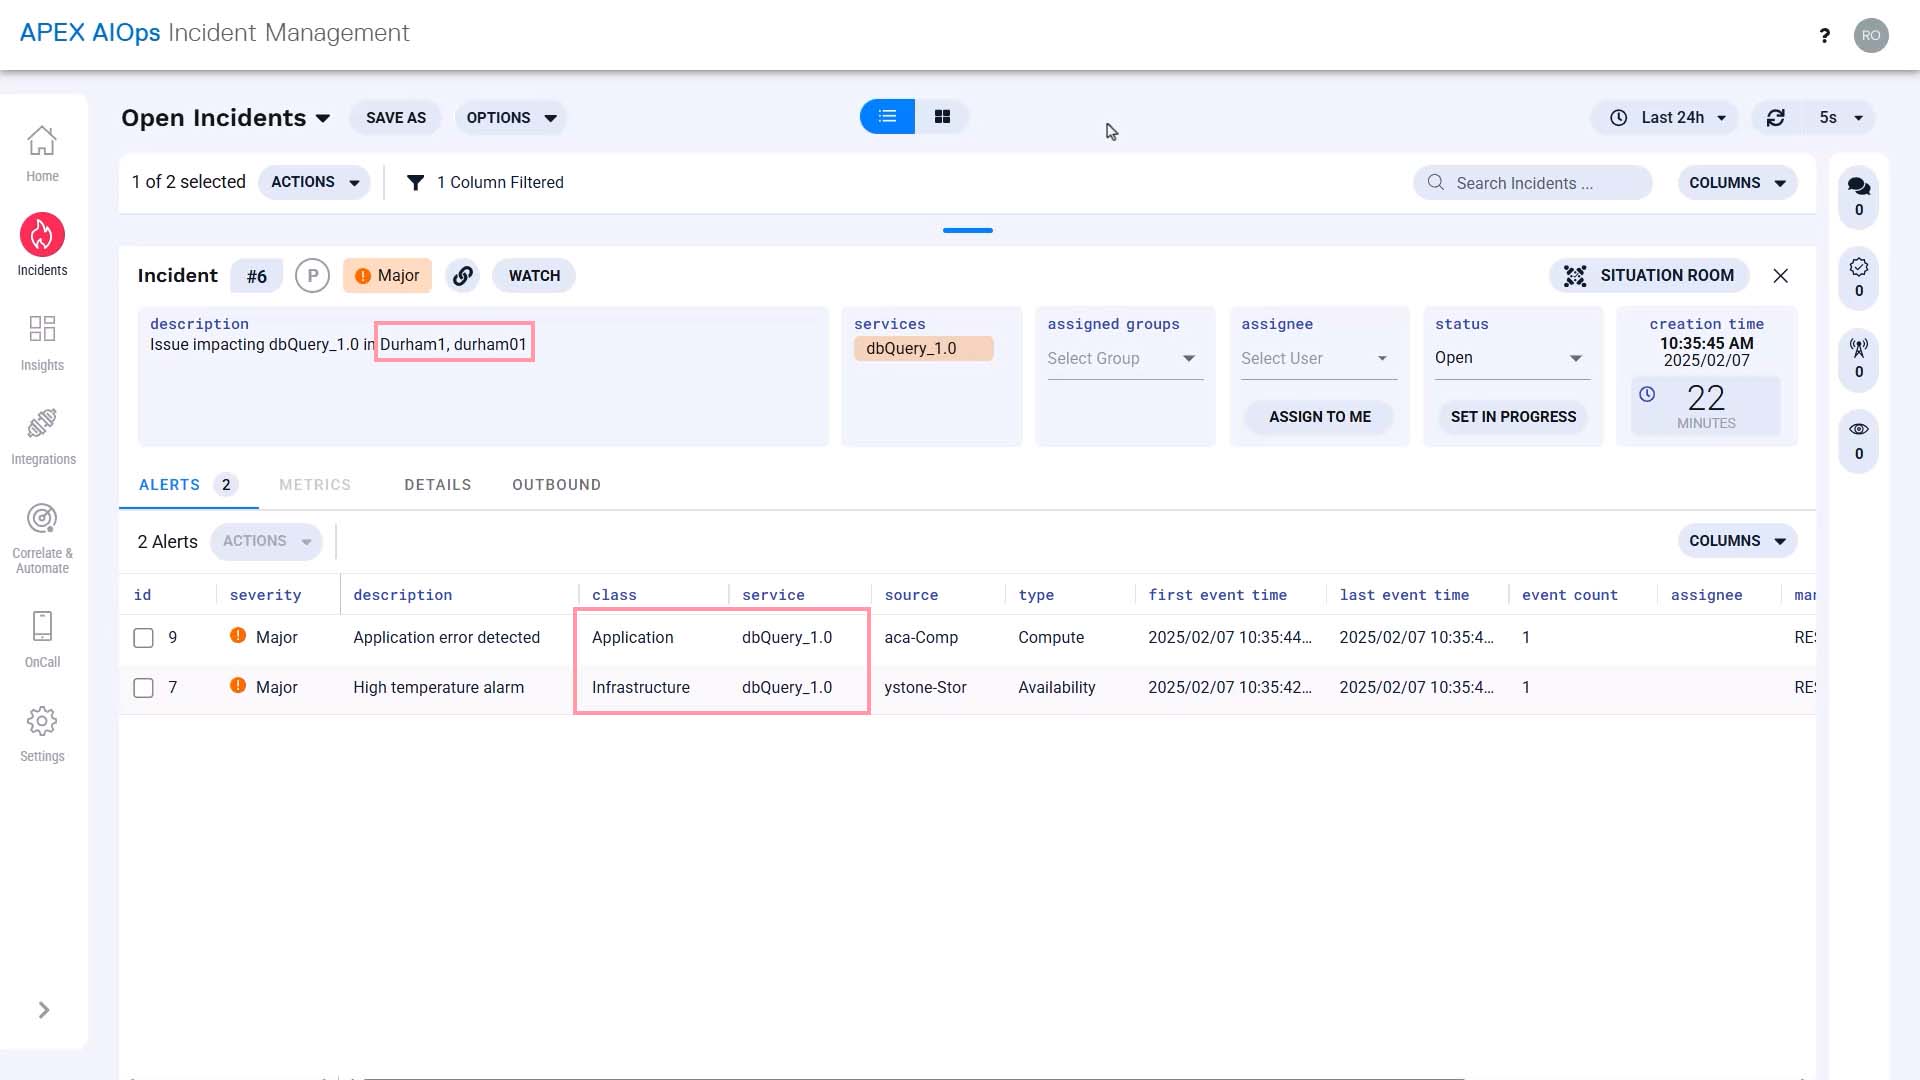
Since we set the data center match percentage to 70 rather than 100%, it accommodates the difference in capitalization.
Now, this incident contains an infrastructure alert and an application alert on the same service in one place, and the applicable infrastructure team and the application team have been notified.
Looking at the timeline together, they quickly identified the issue originated in the hardware.
Without this incident correlating the two alerts together, the application team would not have been able to rule out other potential causes.
Now you know how Incident Management correlates alerts. thanks for watching
Moogsoft has many tools for troubleshooting and collaborating. In this video learn how to use the Situation Room to investigate and resolve an incident.
Use case walkthrough: Tour of the Situation Room ►
This video provides an overview of the Incident Management Situation Room and its features, which include the comments and recommendations tabs.
*Please note Moogsoft is now part of Dell's IT Operations solution called APEX AIOps, and changed its name to APEX AIOps Incident Management. The UI in this video may differ slightly but the content covered is still relevant.
In this video we’ll showcase the power of the Situation Room in Incident Management.
Here’s a critical incident happening…let’s take ownership of it and investigate.
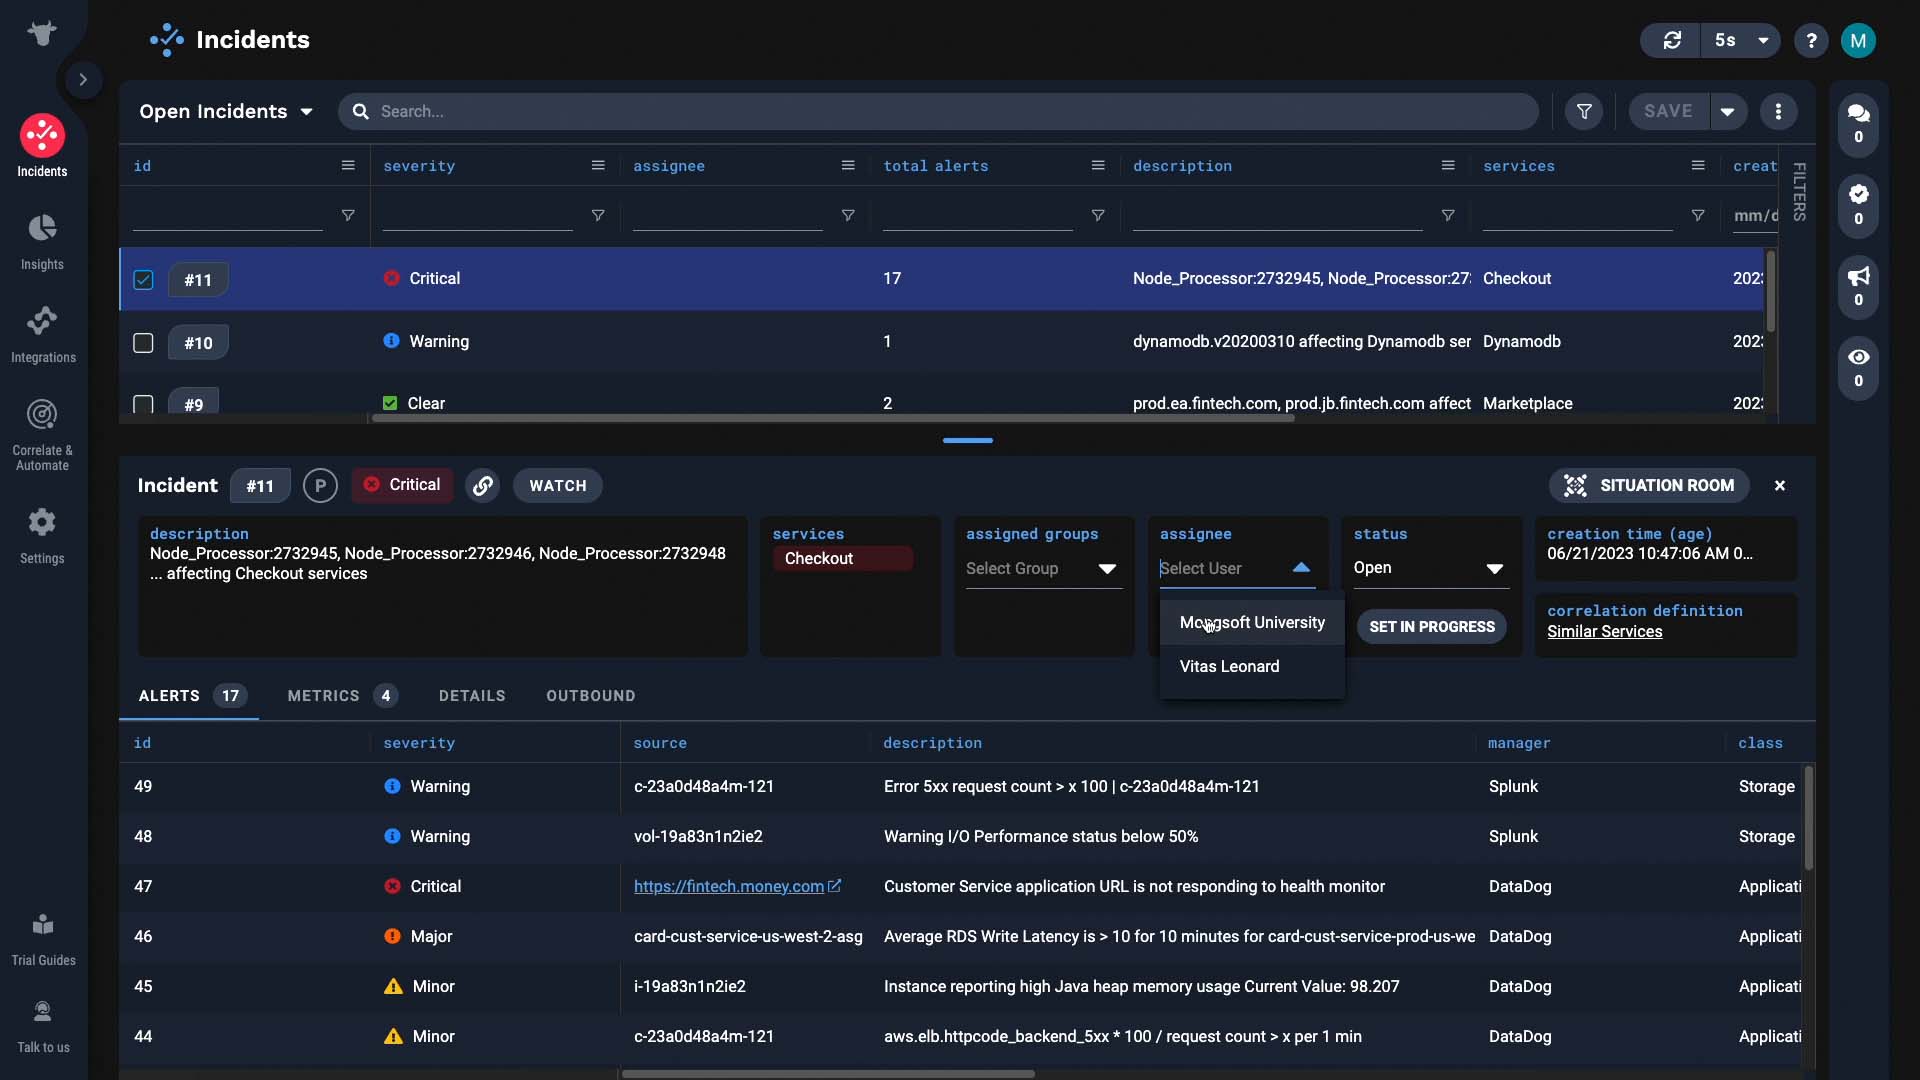
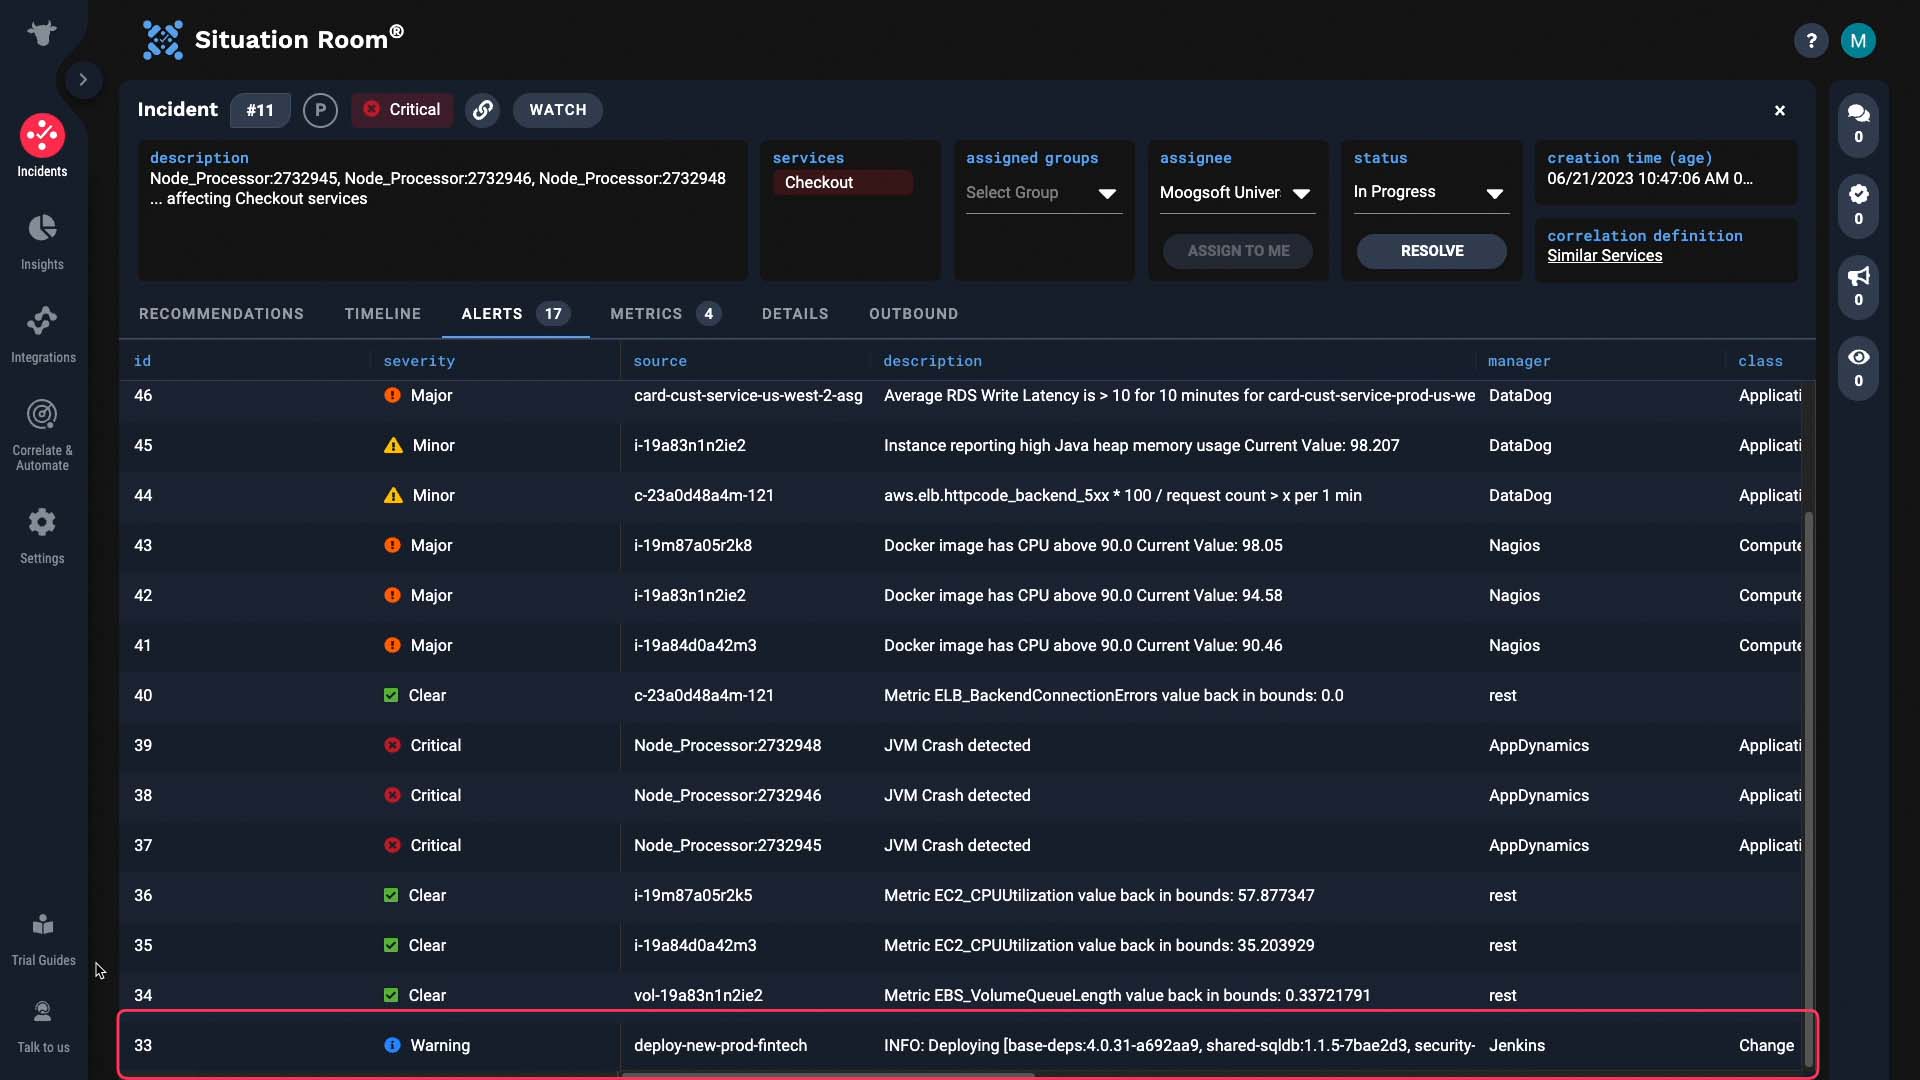
There is a lot going on–several Java Virtual Machines have crashed, and we’re seeing I/O and database problems.
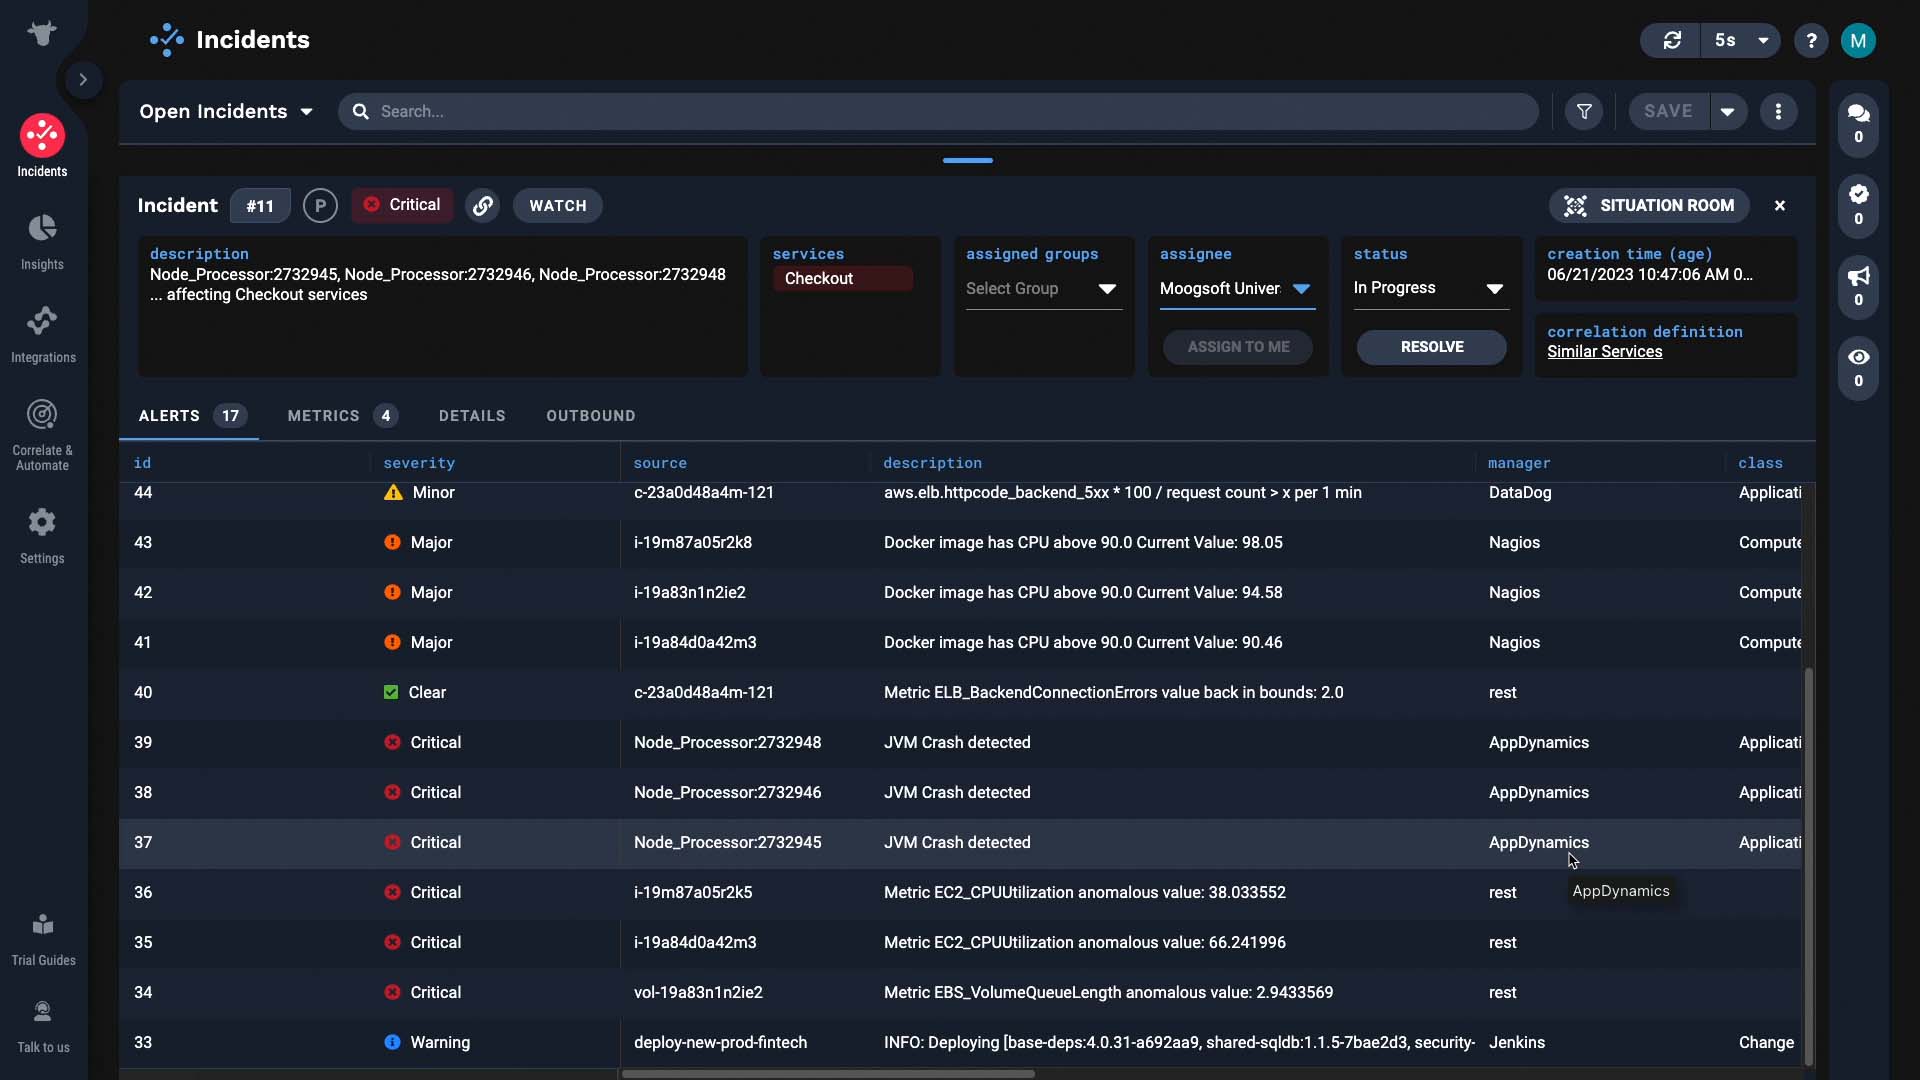
We’ll go to the Situation Room for this incident.
The Situation Room is a virtual collaboration space in Incident Management. It is designed to facilitate collaboration and drive incidents to resolution. Let me show you how it helps our investigation.
It has the same tools and information as the incident details page, but now the entire screen space is dedicated to resolving this one incident. You see the description of the incident, impacted services, and which correlation definition was applied to group the member alerts,
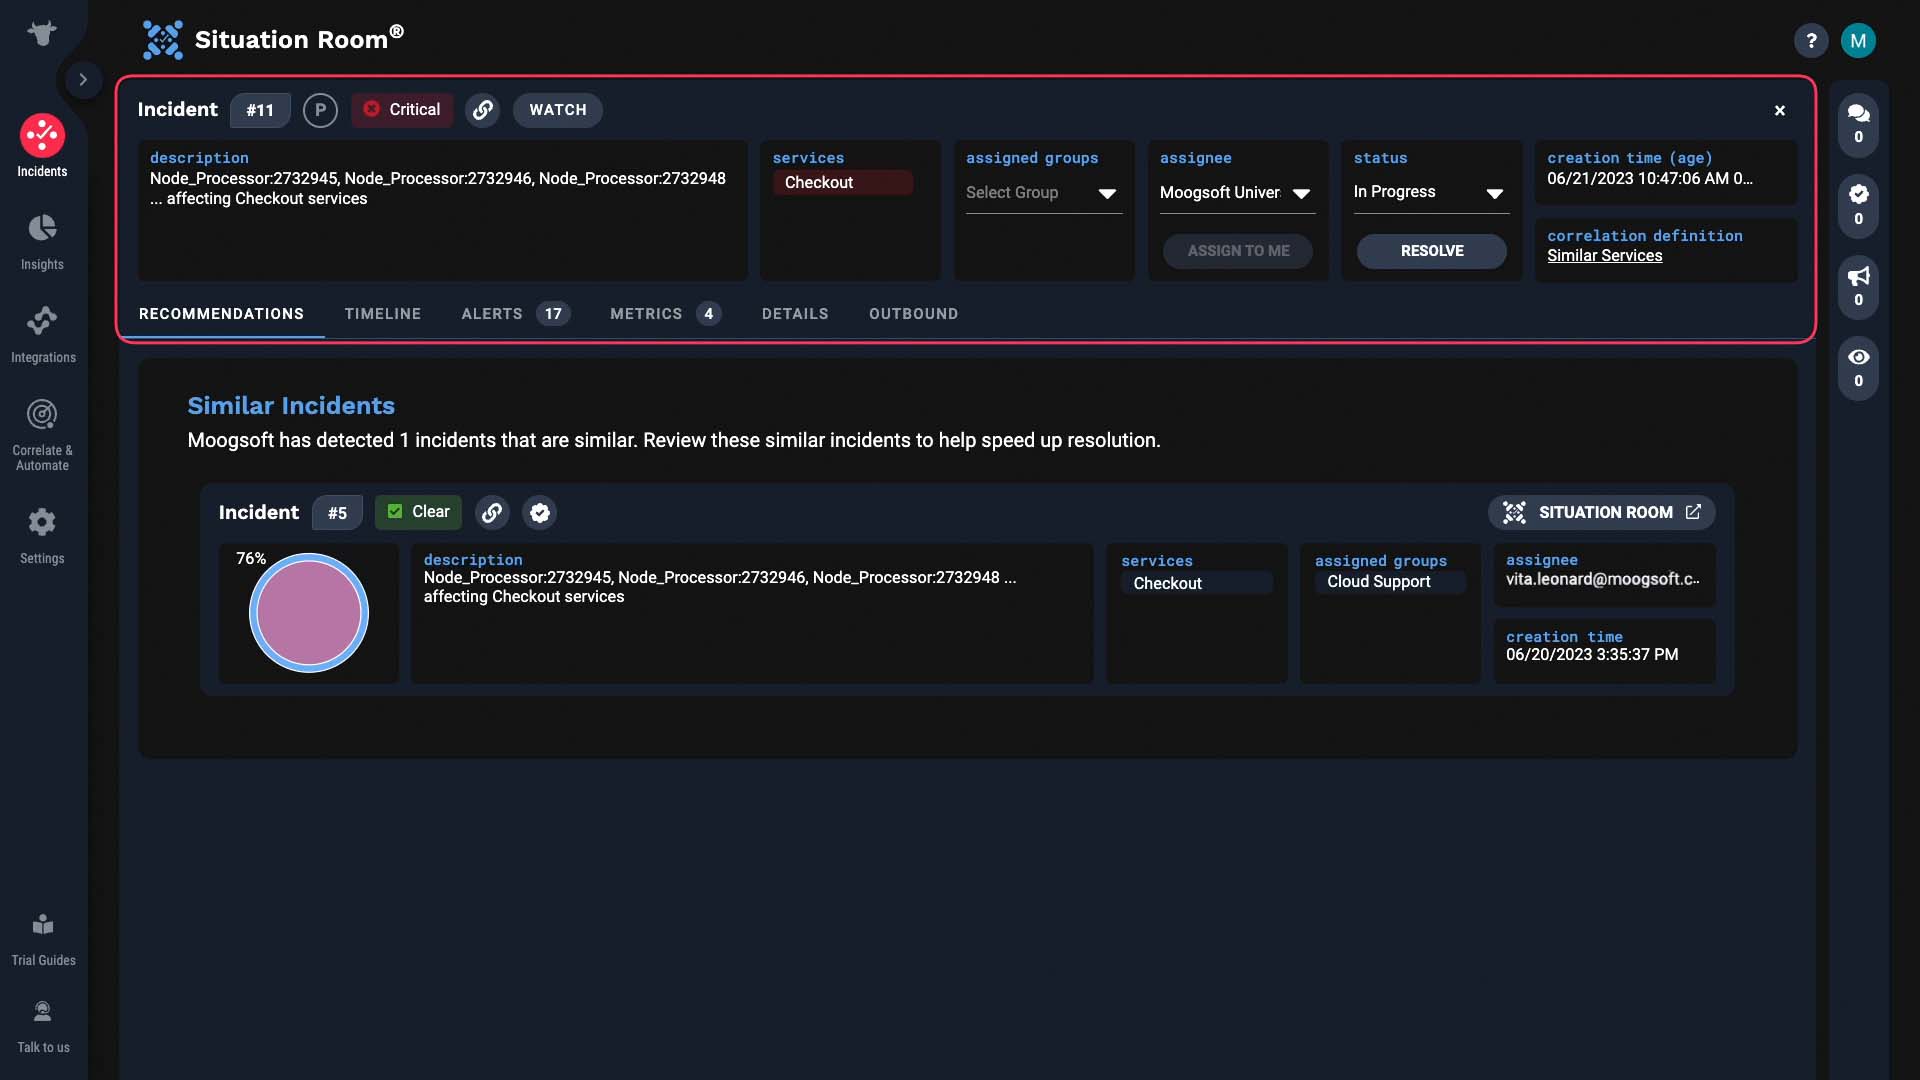
But there are a few things that make the Situation Room special.
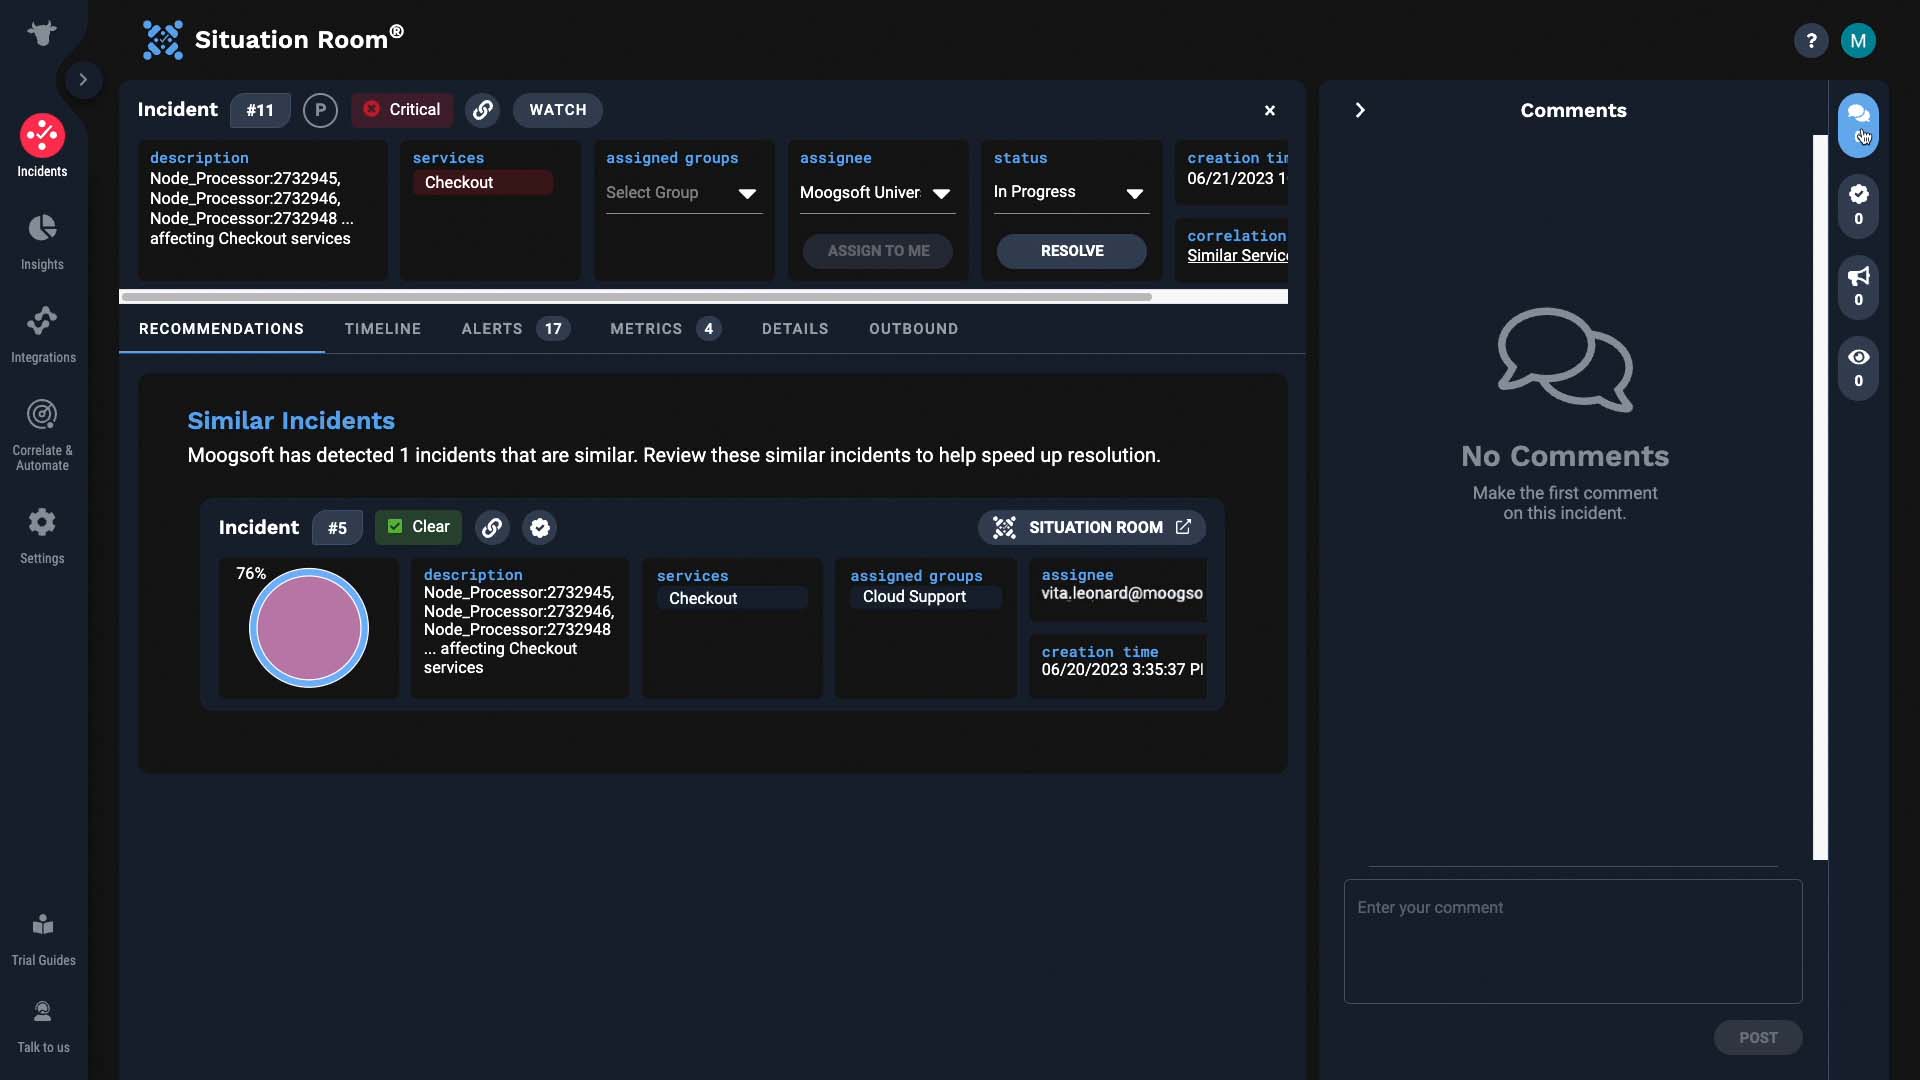
First, here is the comments tab. The team can chat as they work through the incident.
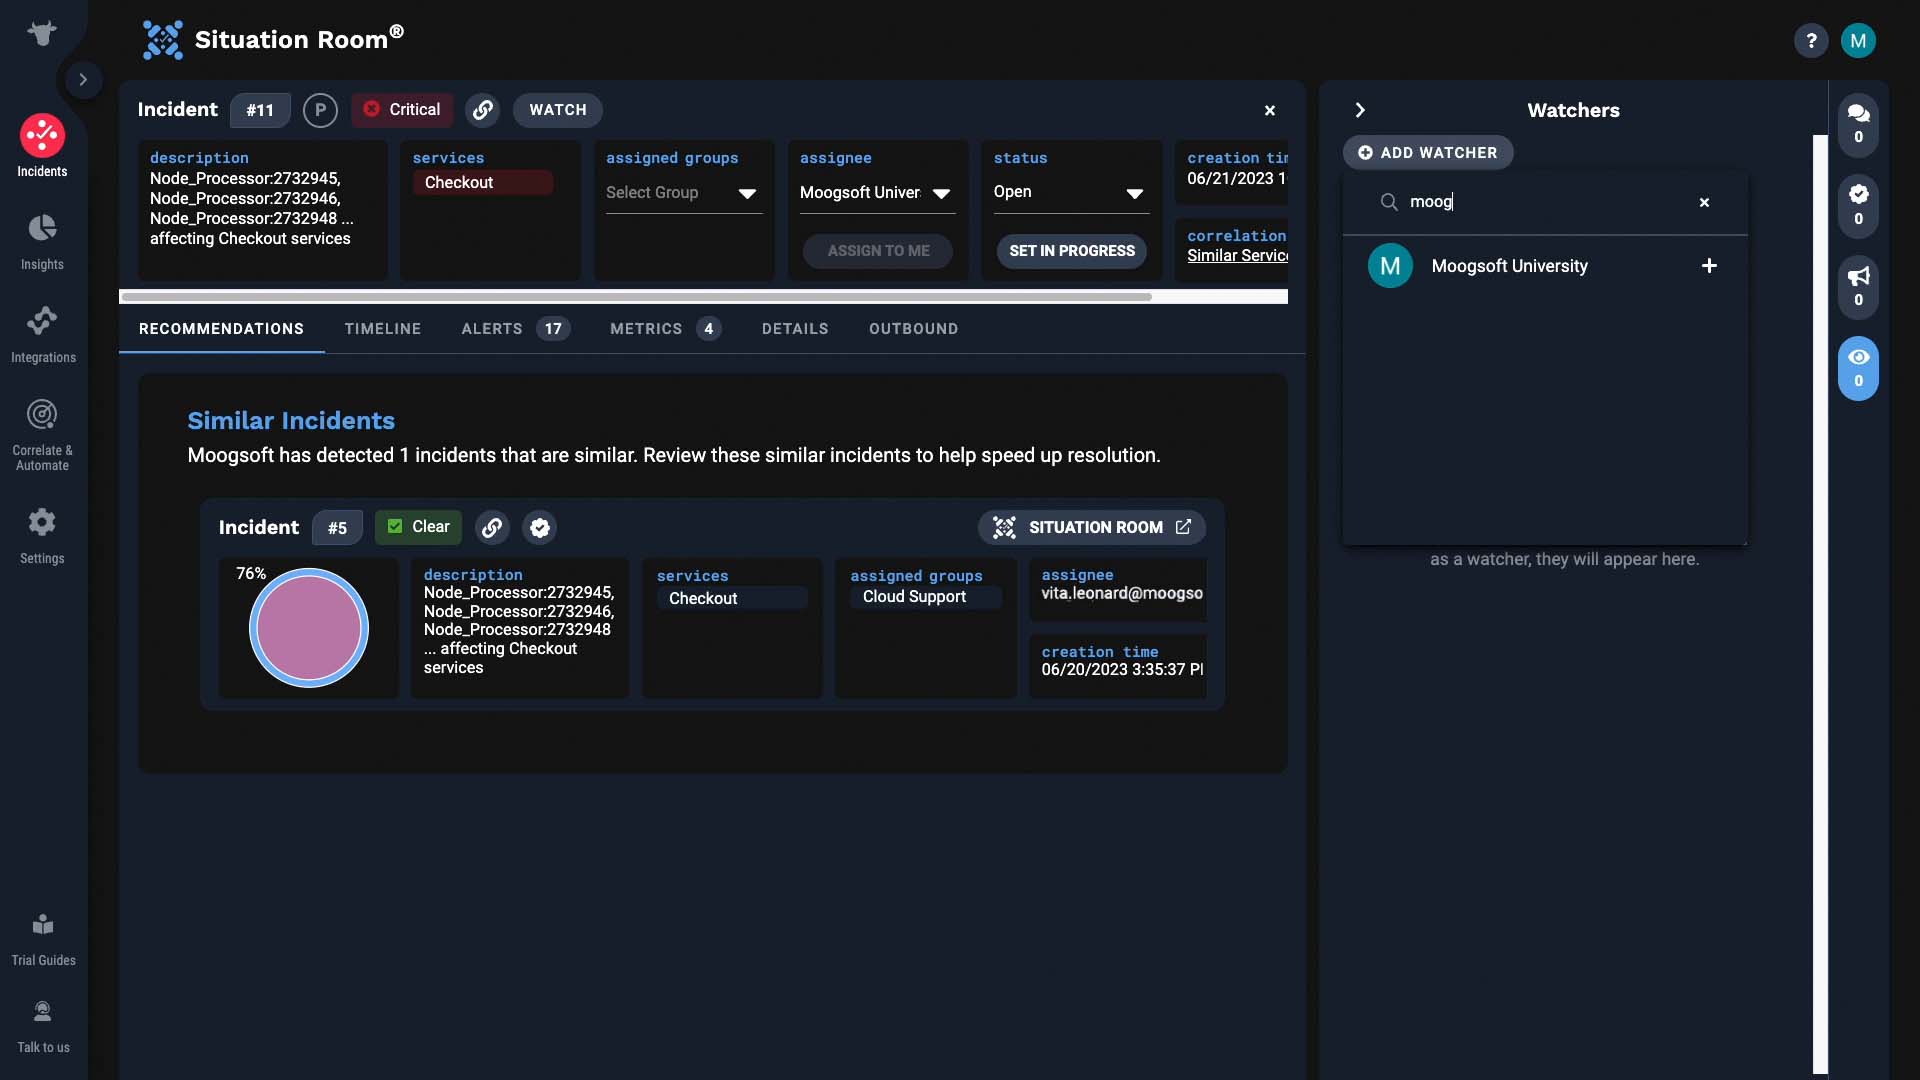
Or maybe you just want to monitor the progress of this incident. Then you can add yourself, or a stakeholder as a watcher. You will receive an email when there are any announcements.
Next, the recommendations tab is a great resource. Incident Management checks if there are incidents similar to the one at hand. And if there are, it will surface them for you to reference.
In this case, we have one similar incident.
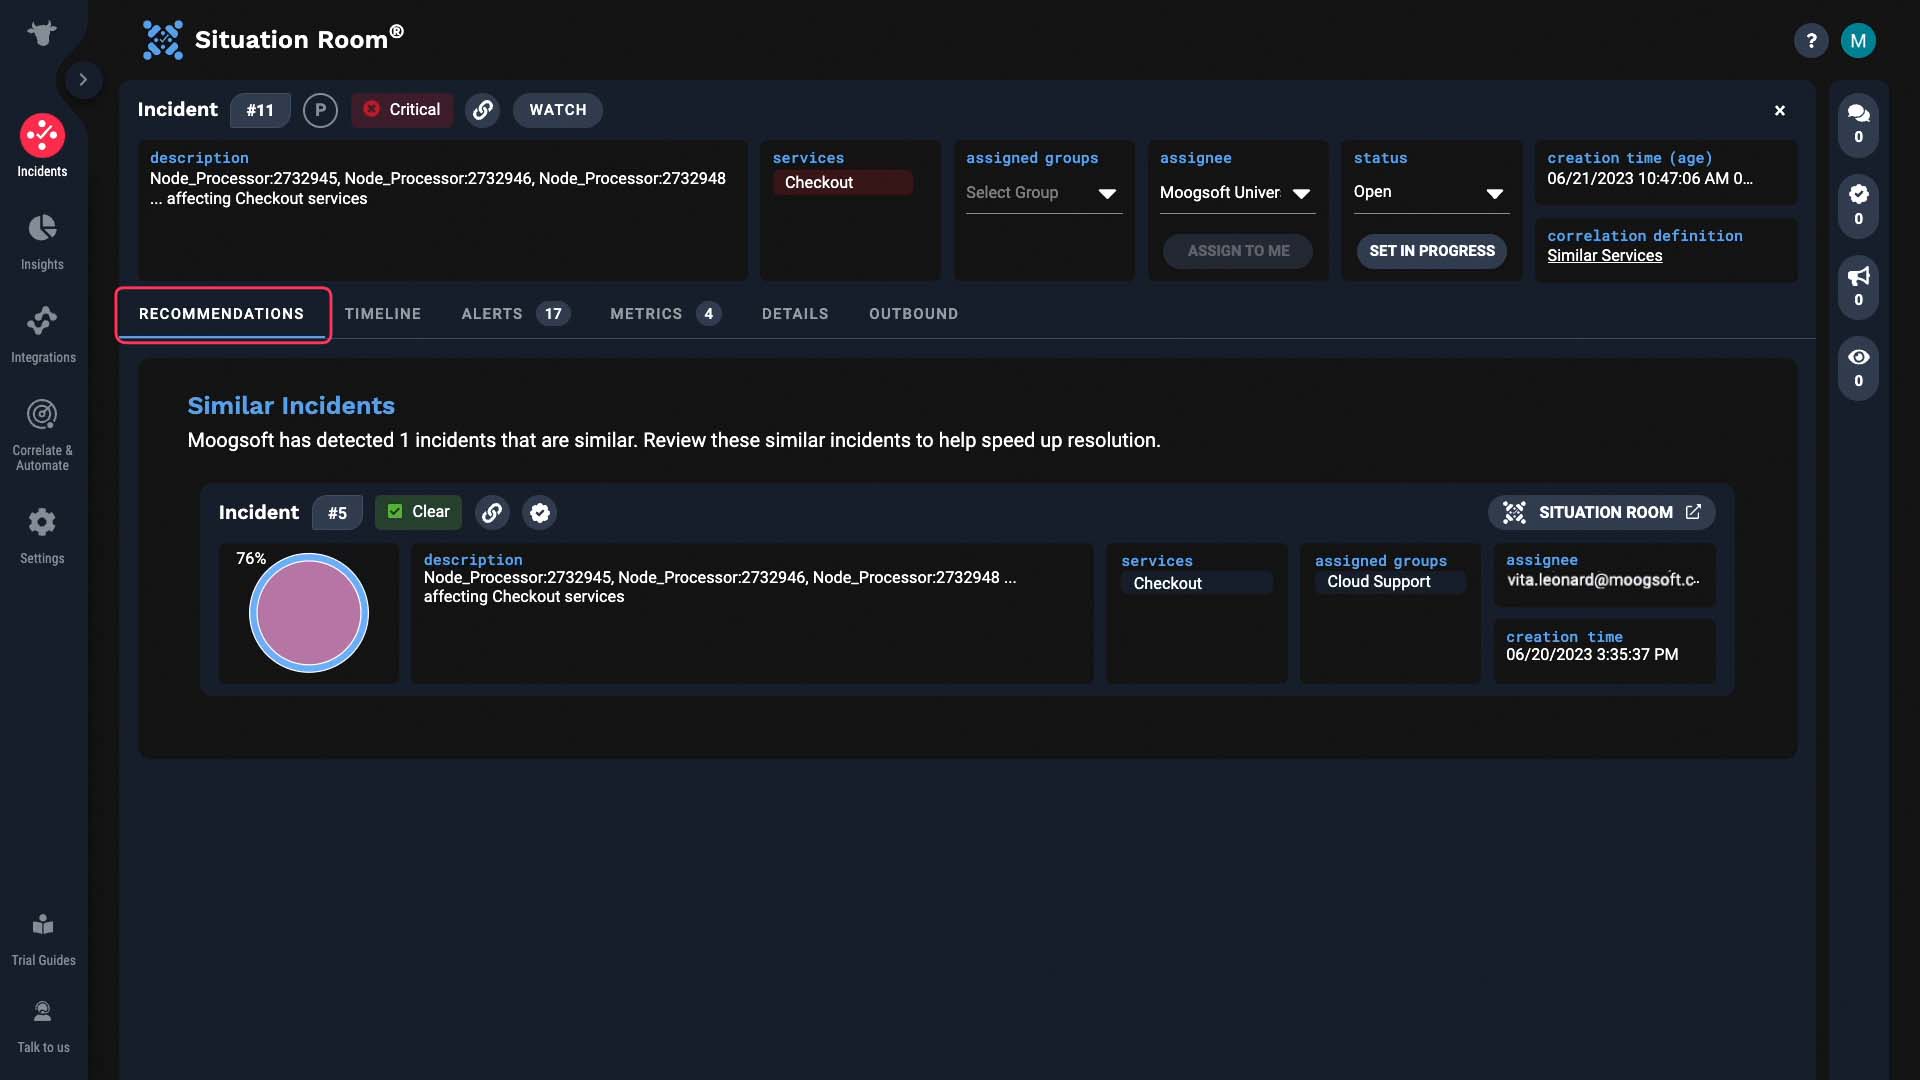
This one is 76% similar to our incident.
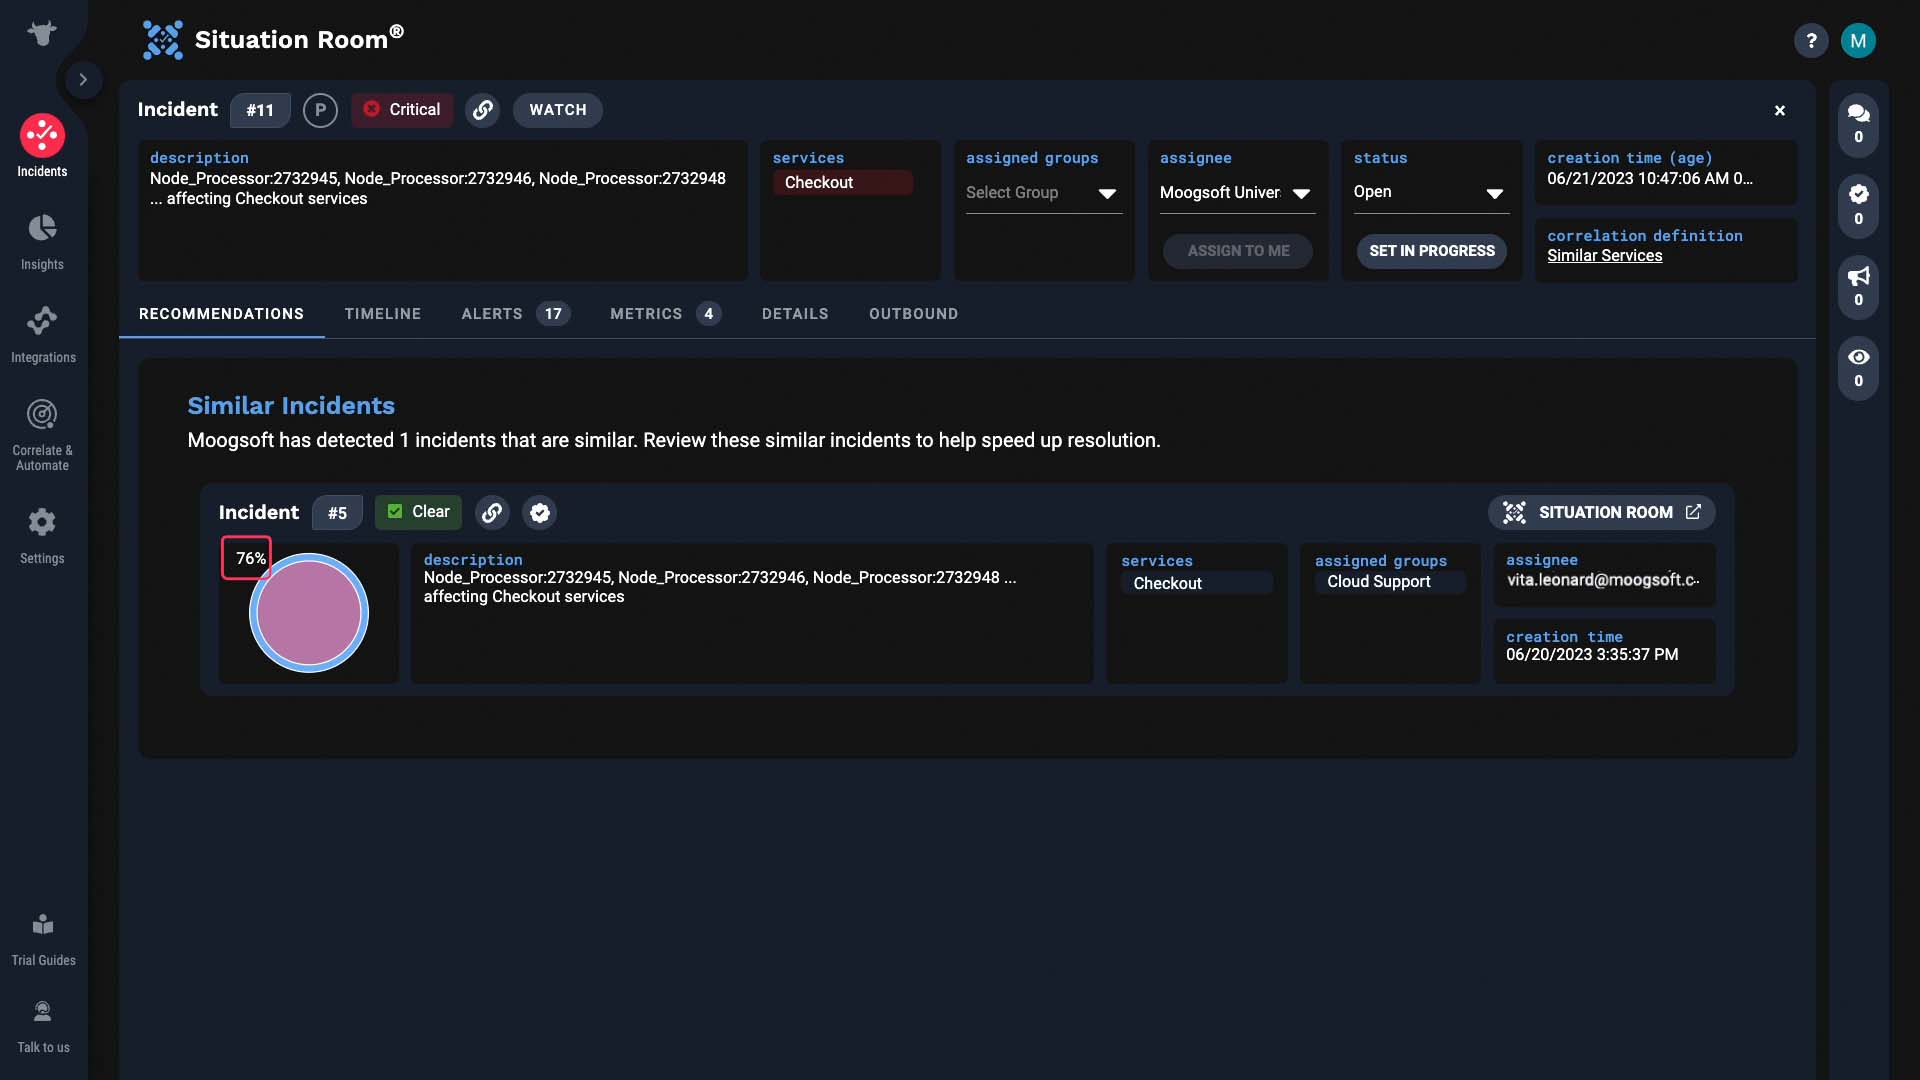
And note this icon! This means information on what resolved this incident is available! With this past incident, it looks like the problems were related to a code push. Let’s learn more about it.
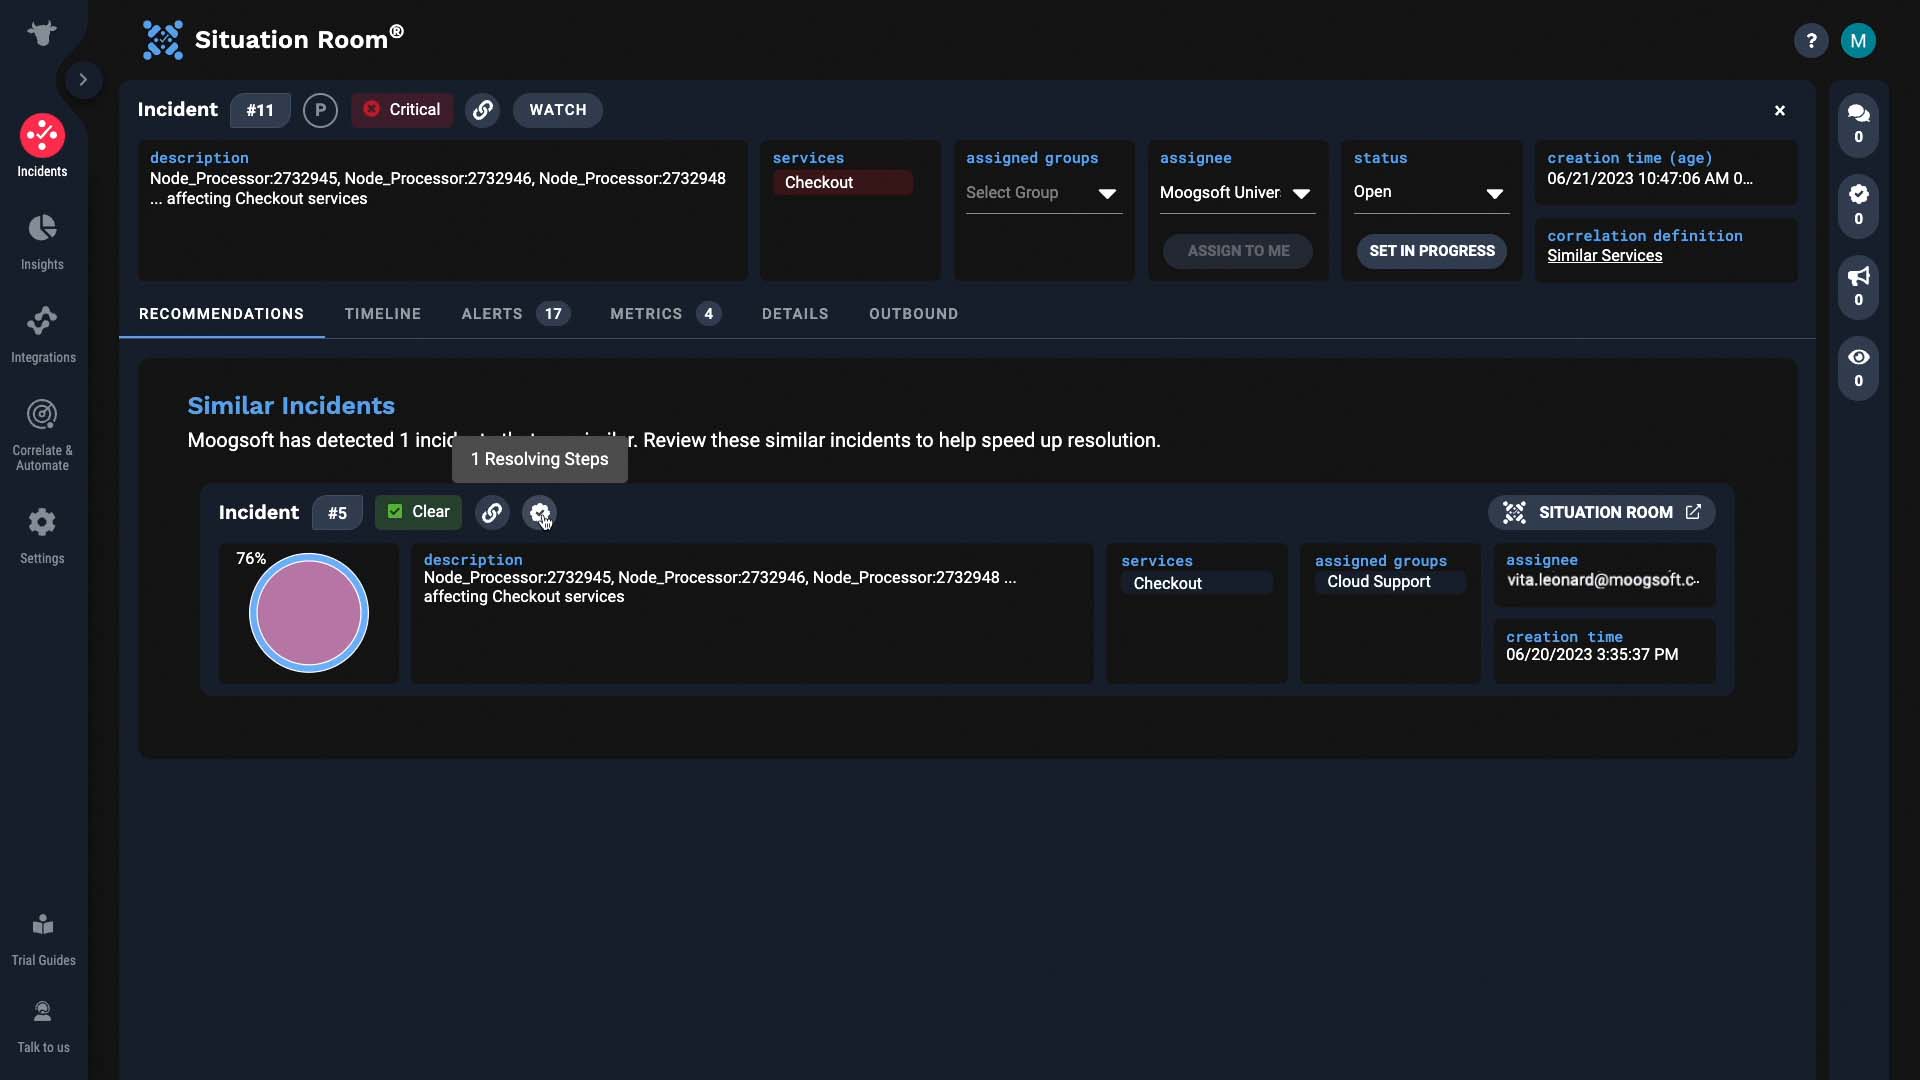
Okay, now we have some more context.
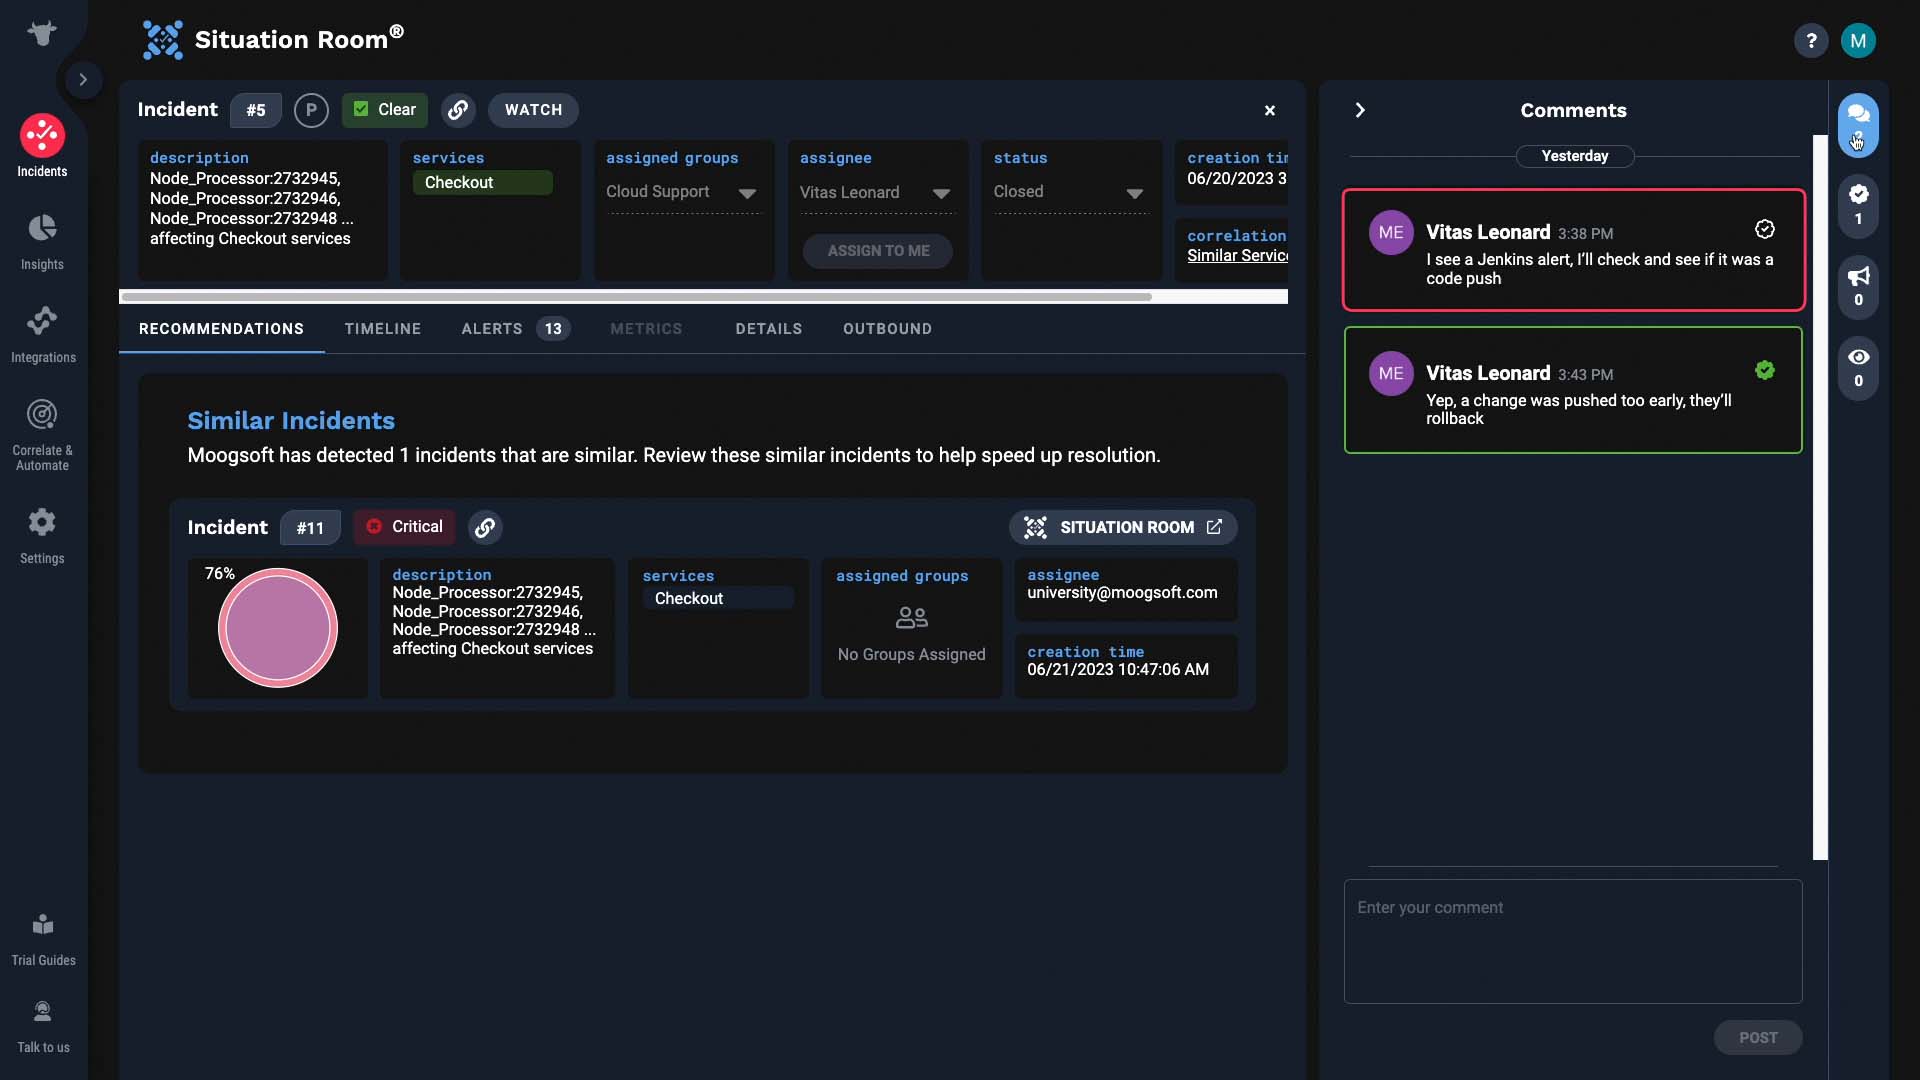
Let’s get back to the incident we were working on. Is there also a Jenkins alert in the current incident? Here’s the timeline that shows you how the incident unfolded…It says code deployment, so this is promising!
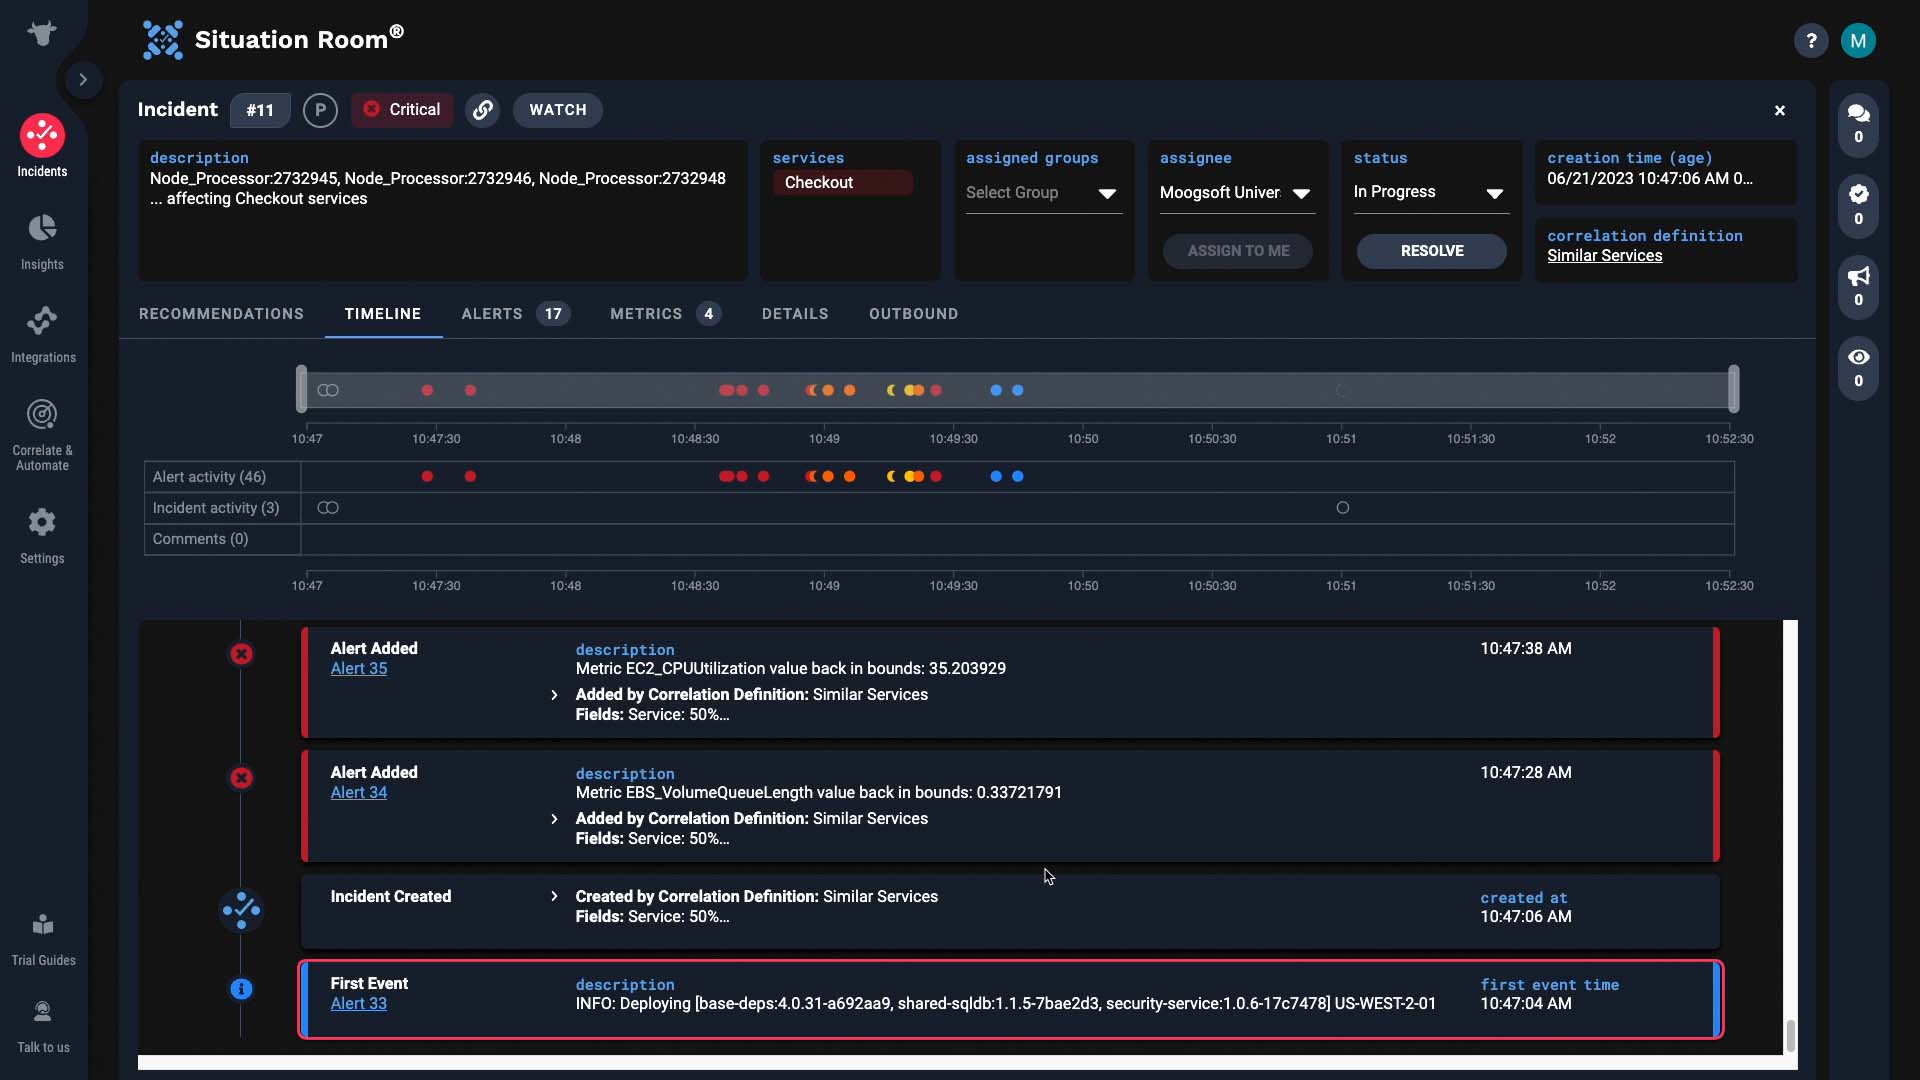
Yes, that is the Jenkins alert. It’s likely that this code change is the root cause of the incident. So indeed, that similar incident Incident Management suggested was right!
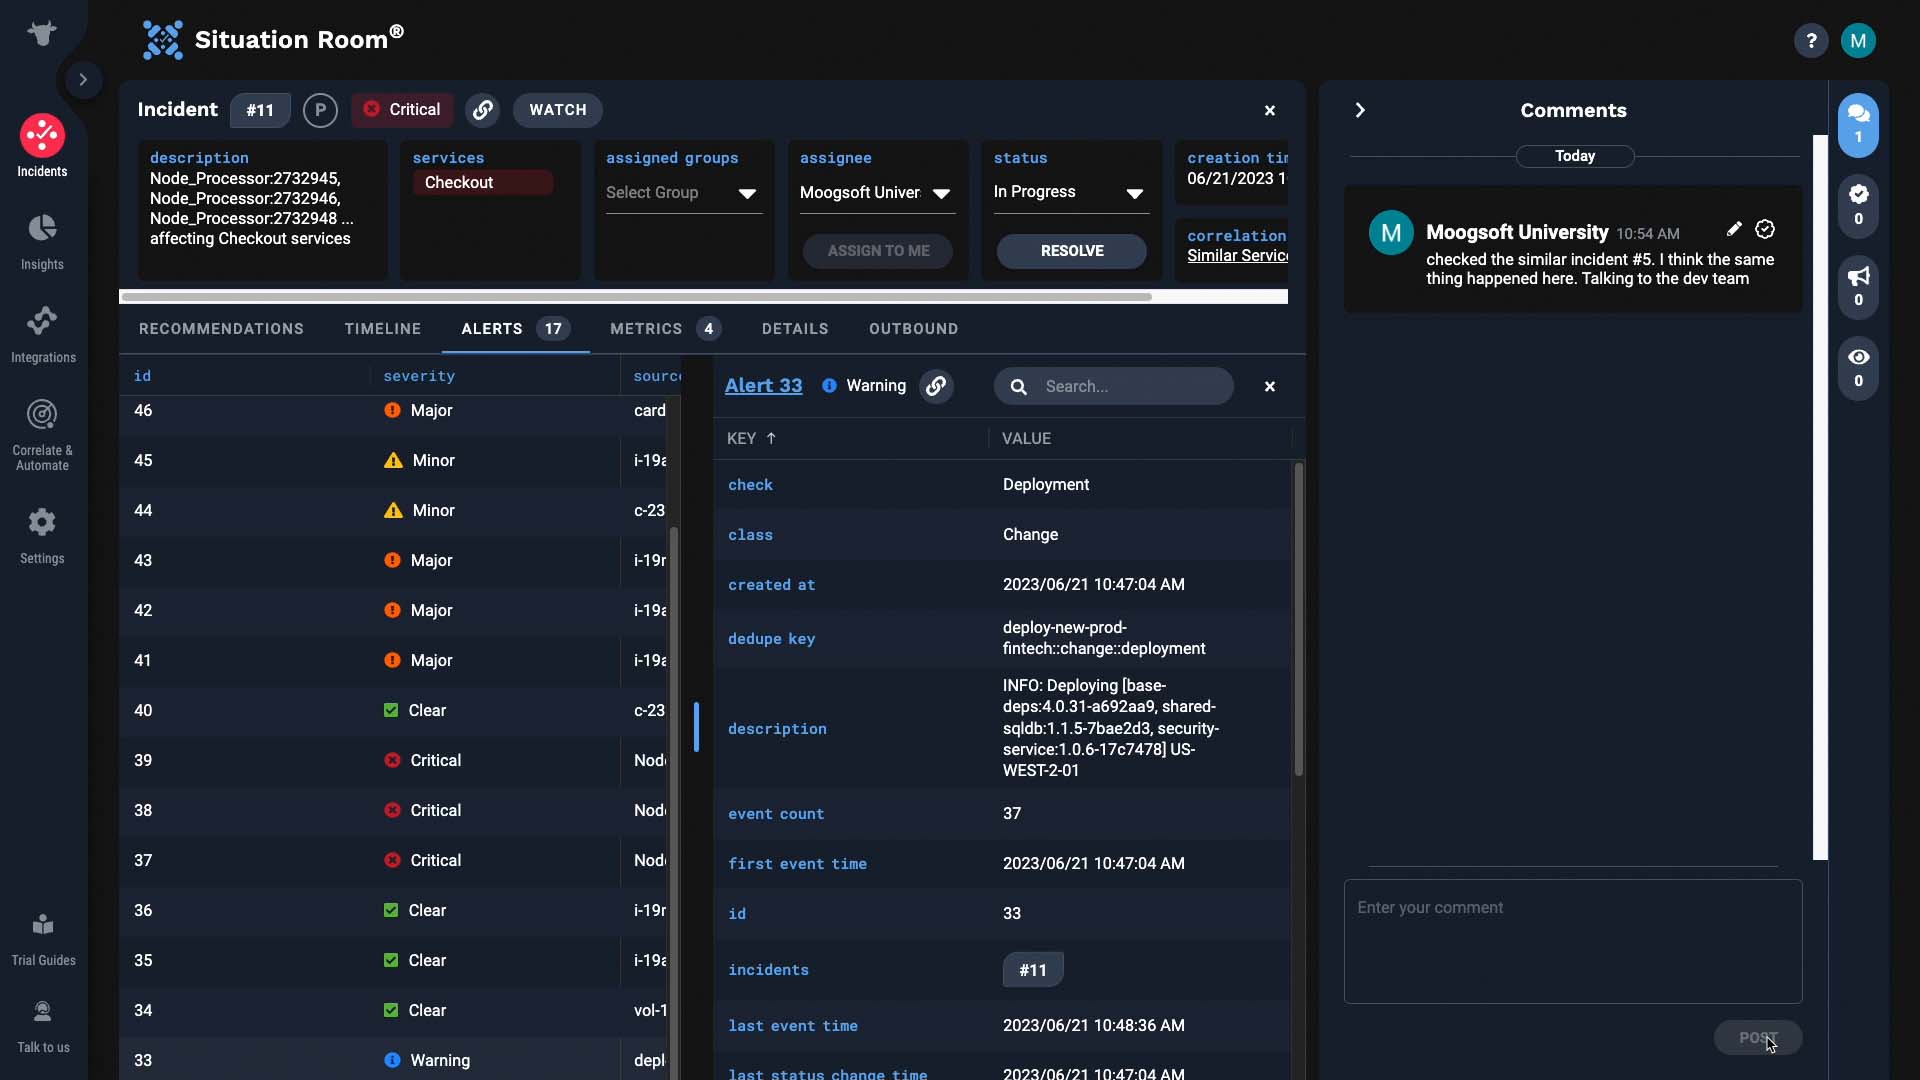
Let’s share our findings with the team. We’ll talk to the developers and get the deployment rolled back.
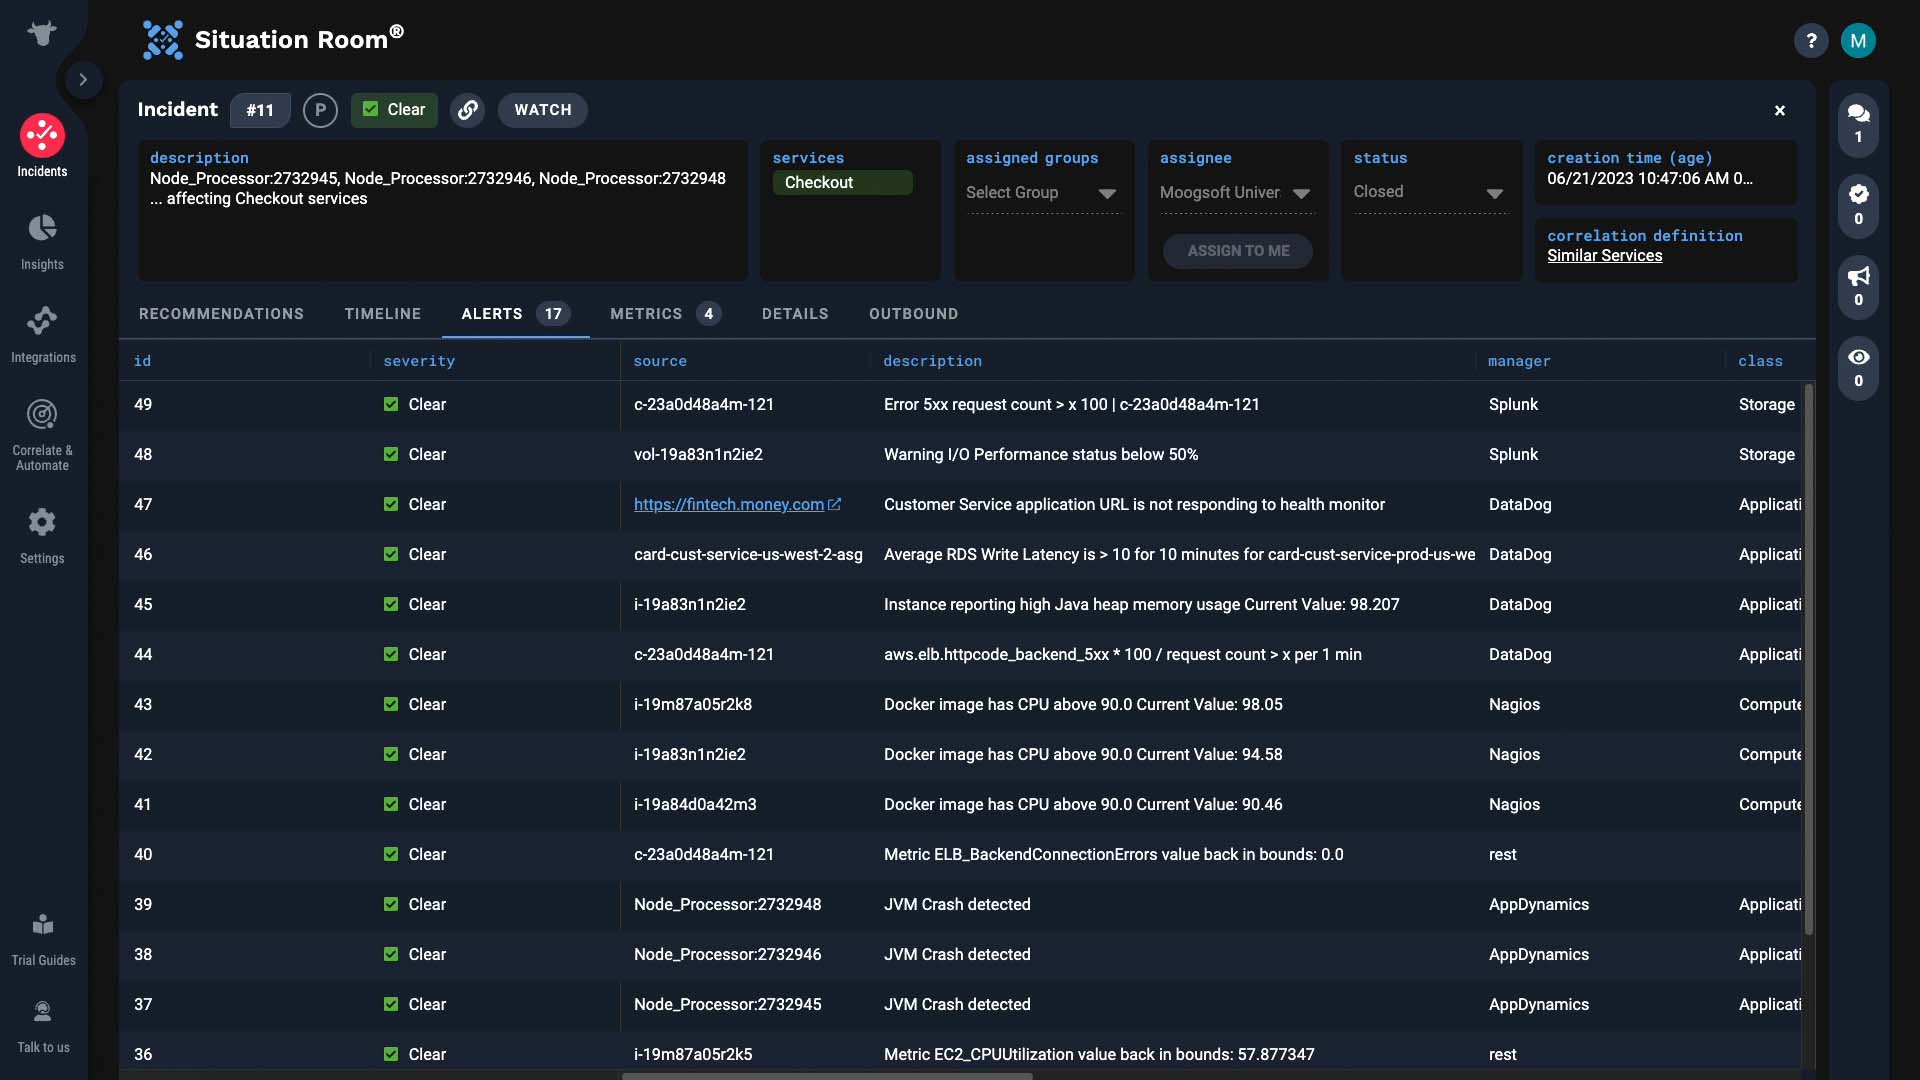
All fixed… that was quick! Now you know how the Situation Room supports faster incident resolution. Thanks for watching!
BASIC | 7 MIN
Incident workflows let you do additional processing when incidents are created or updated, including forwarding incidents to external integrations. Watch this video to see two examples of incident workflows in action.
Demo video: Incident Workflow in APEX AIOps Incident Management ►
This video explains how to configure incident workflows in APEX AIOps Incident Management with examples.
You can now set up workflows to process incidents in Incident Management. In this video, we’ll introduce two examples.
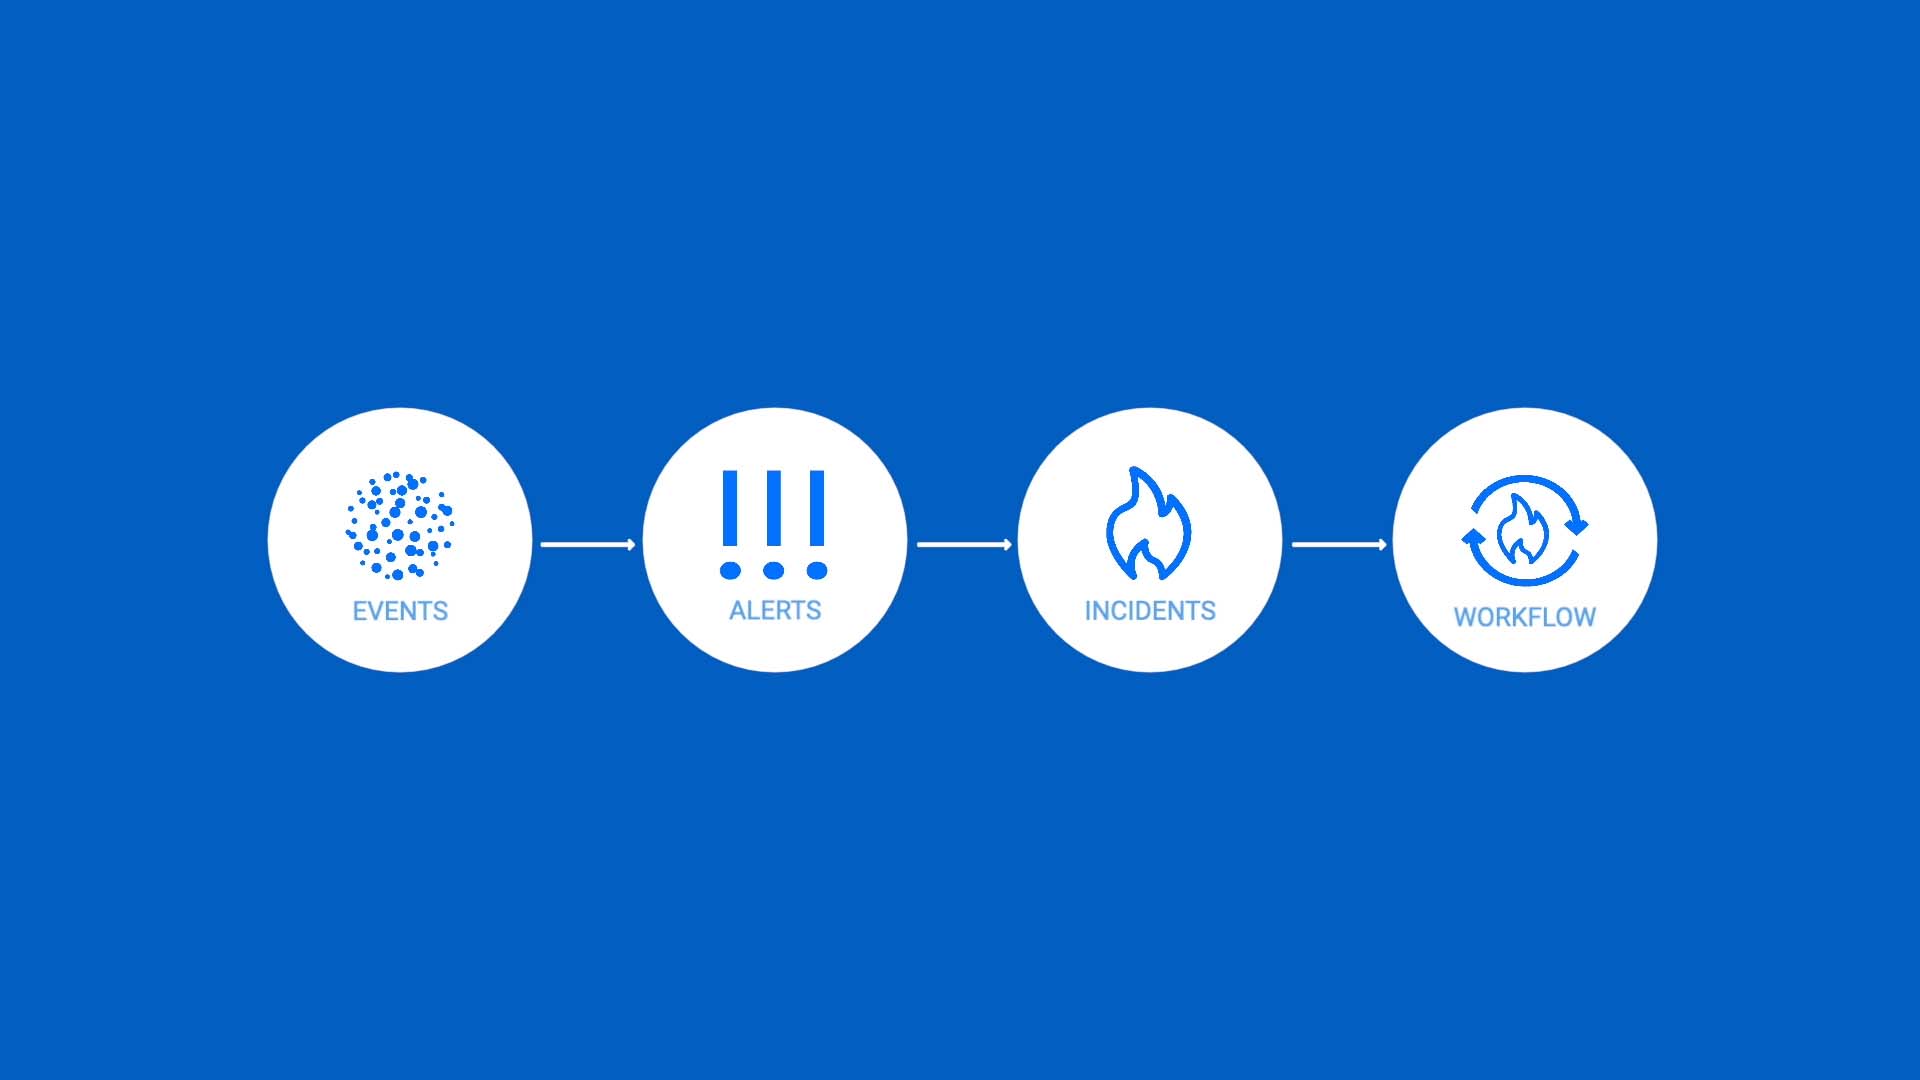
I’m sure you have some rules about how incidents get assigned. Let’s use a simple example and step through a setup.
We want to assign incidents to different teams based on the impacted services.
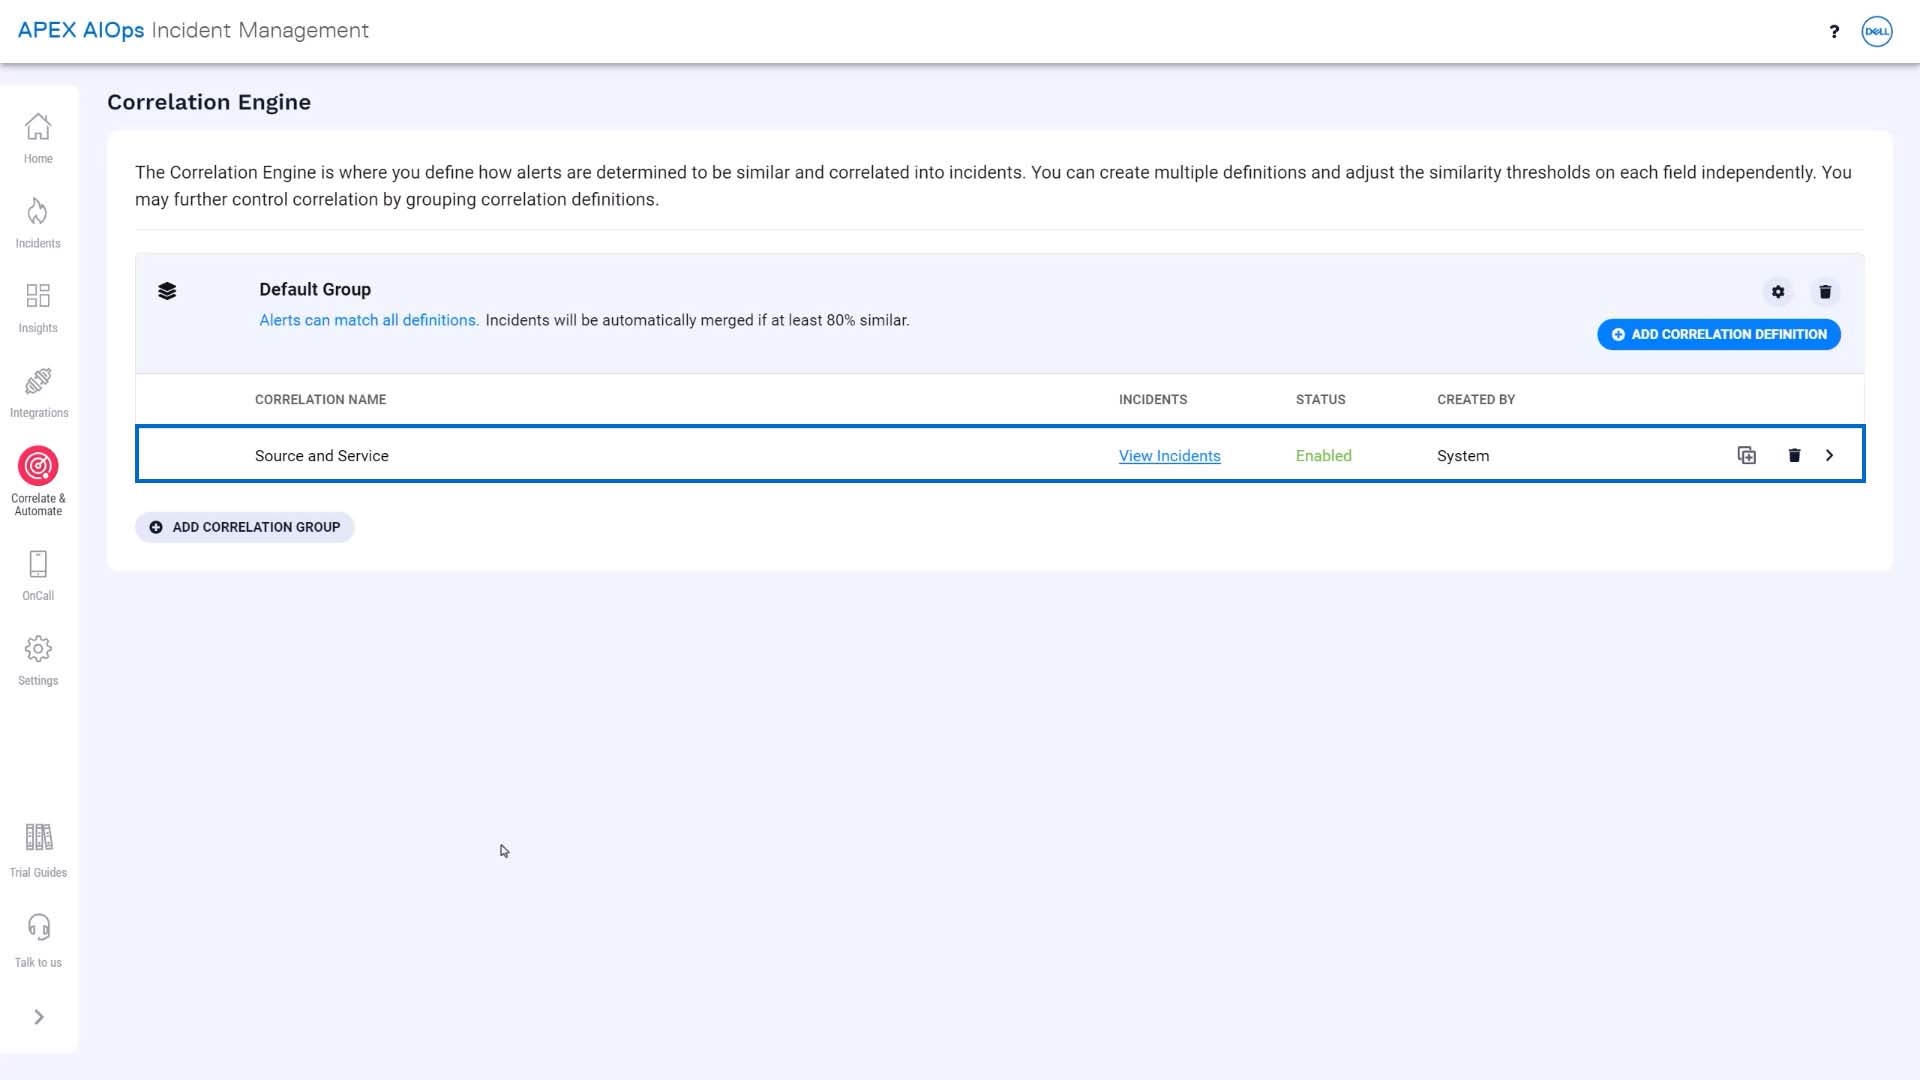
Our Incident Management instance is correlating alerts based on source and service, so we know each incident will only have one service value.
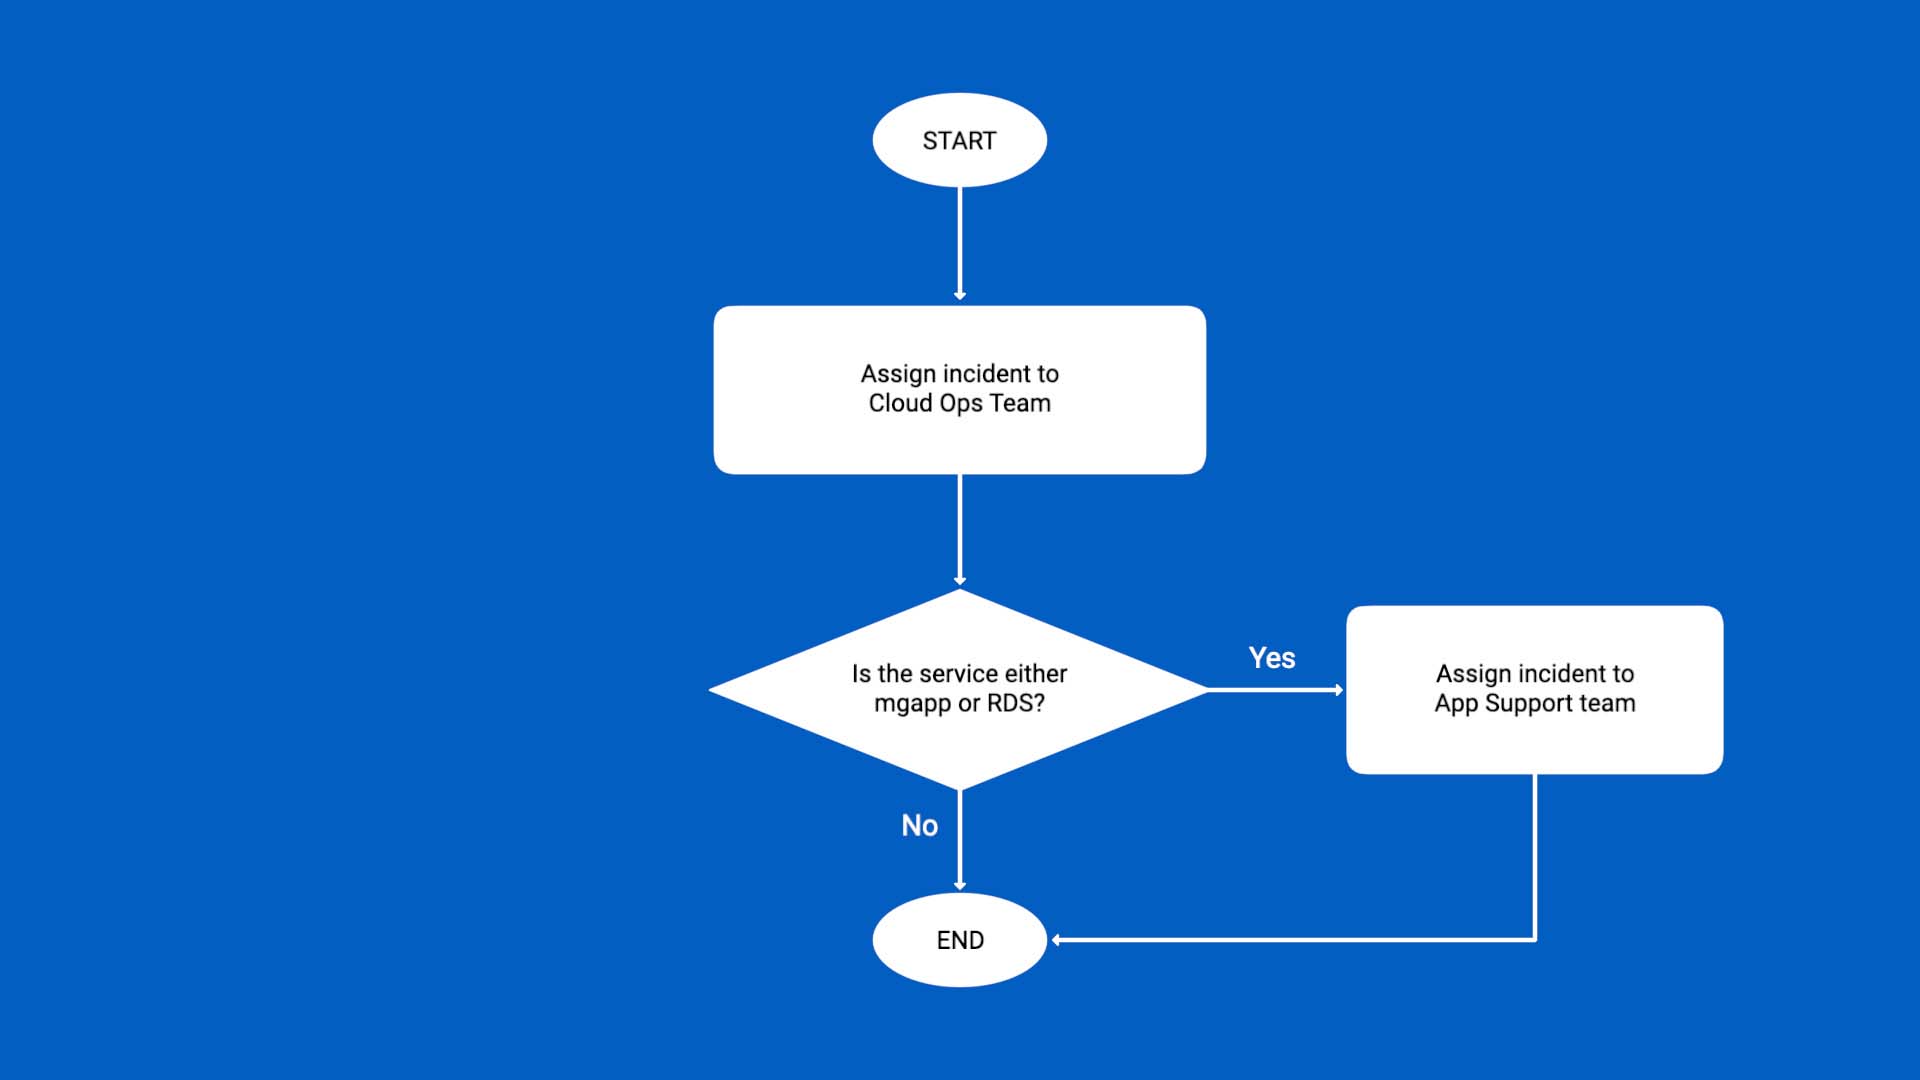
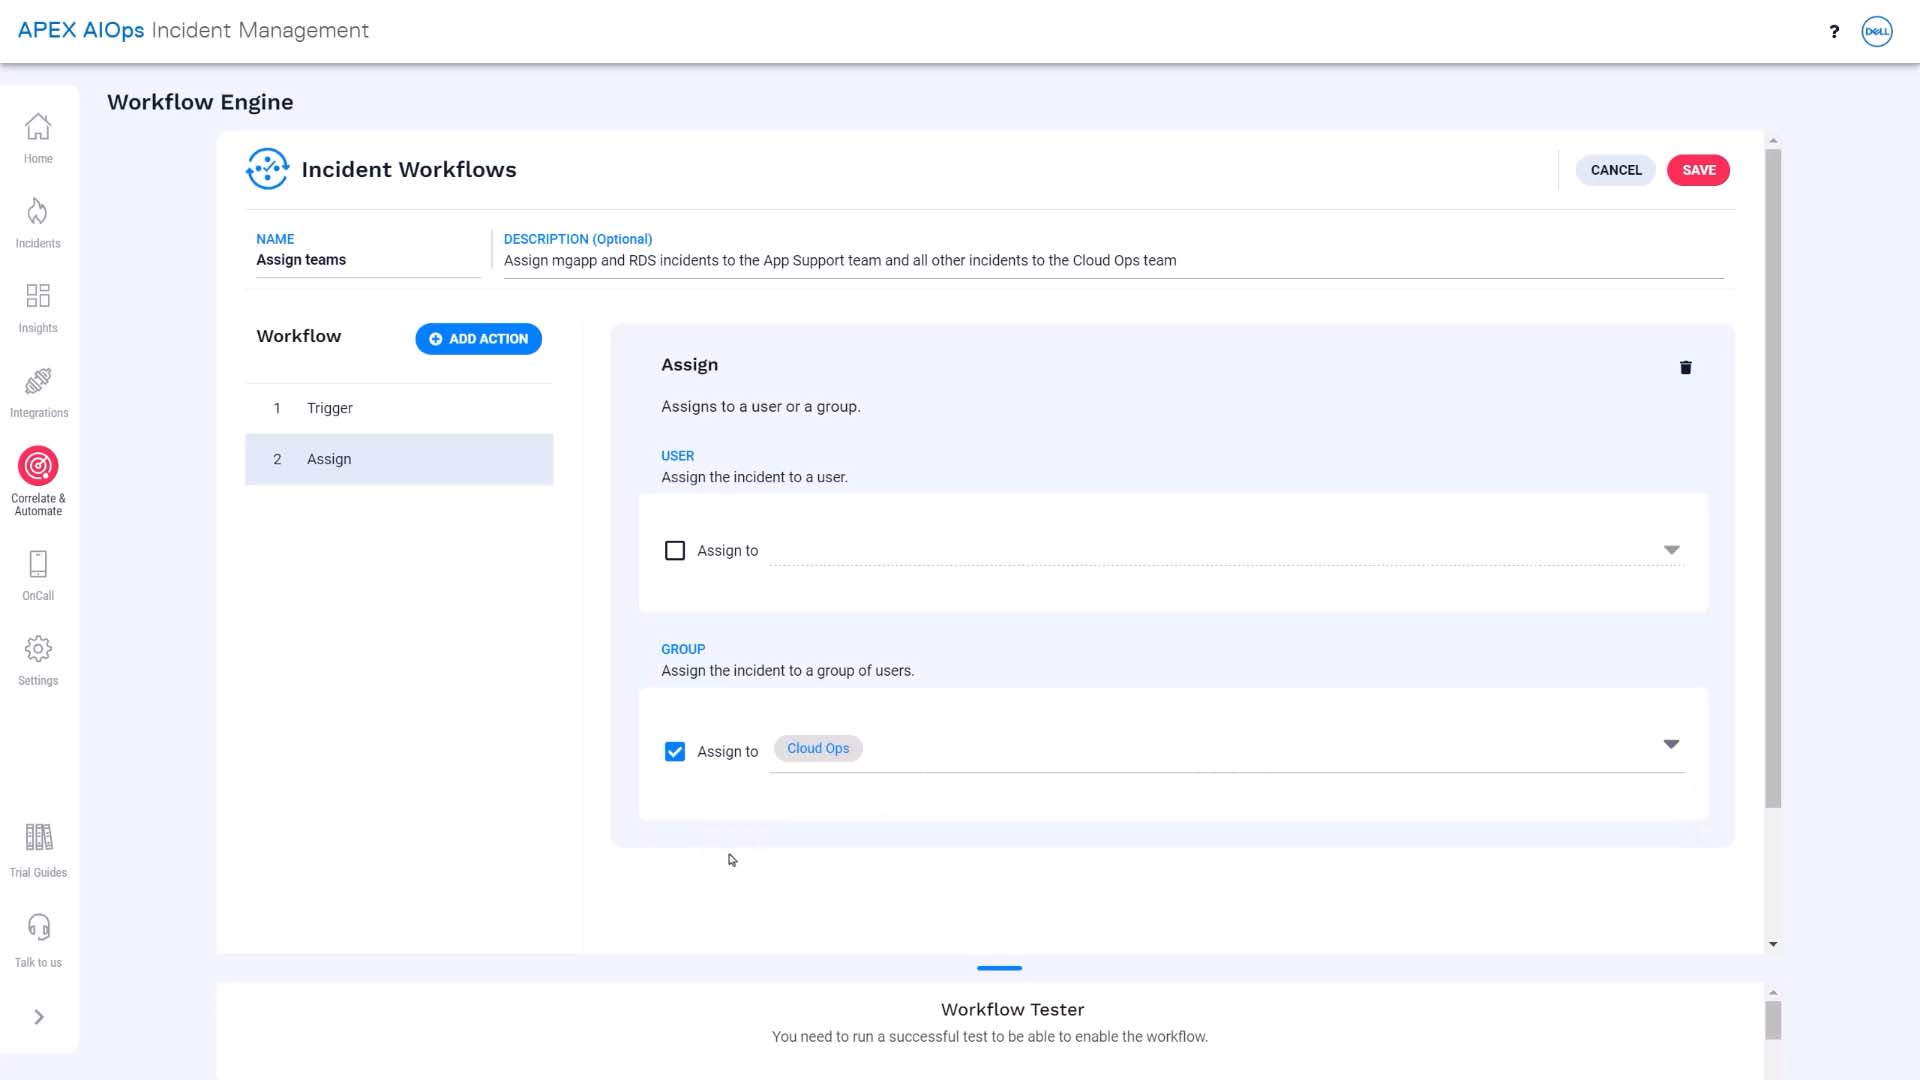
In our workflow, we’ll start by assigning all the incidents to the Cloud Ops team, which is the default.
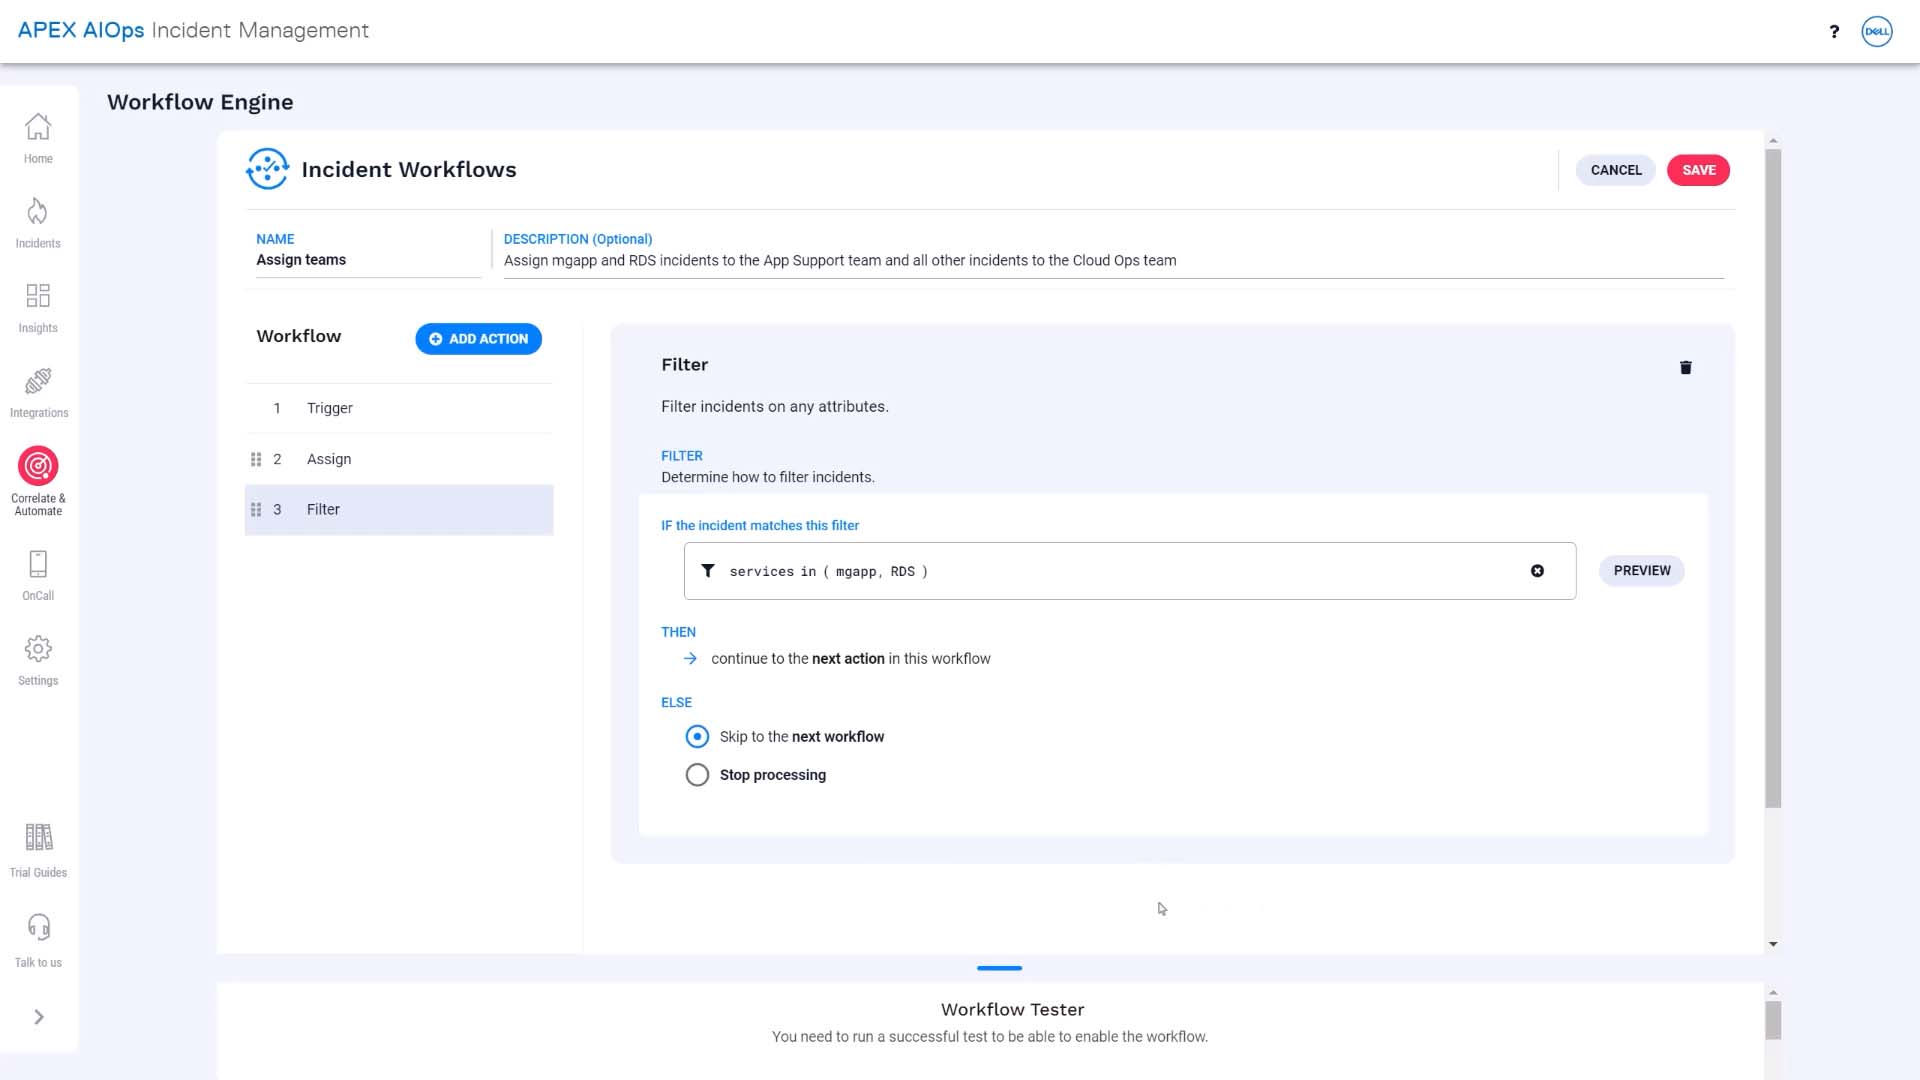
Then, if the services impacted are mgapp or RDS, we’ll change the assignment to the App Support team.
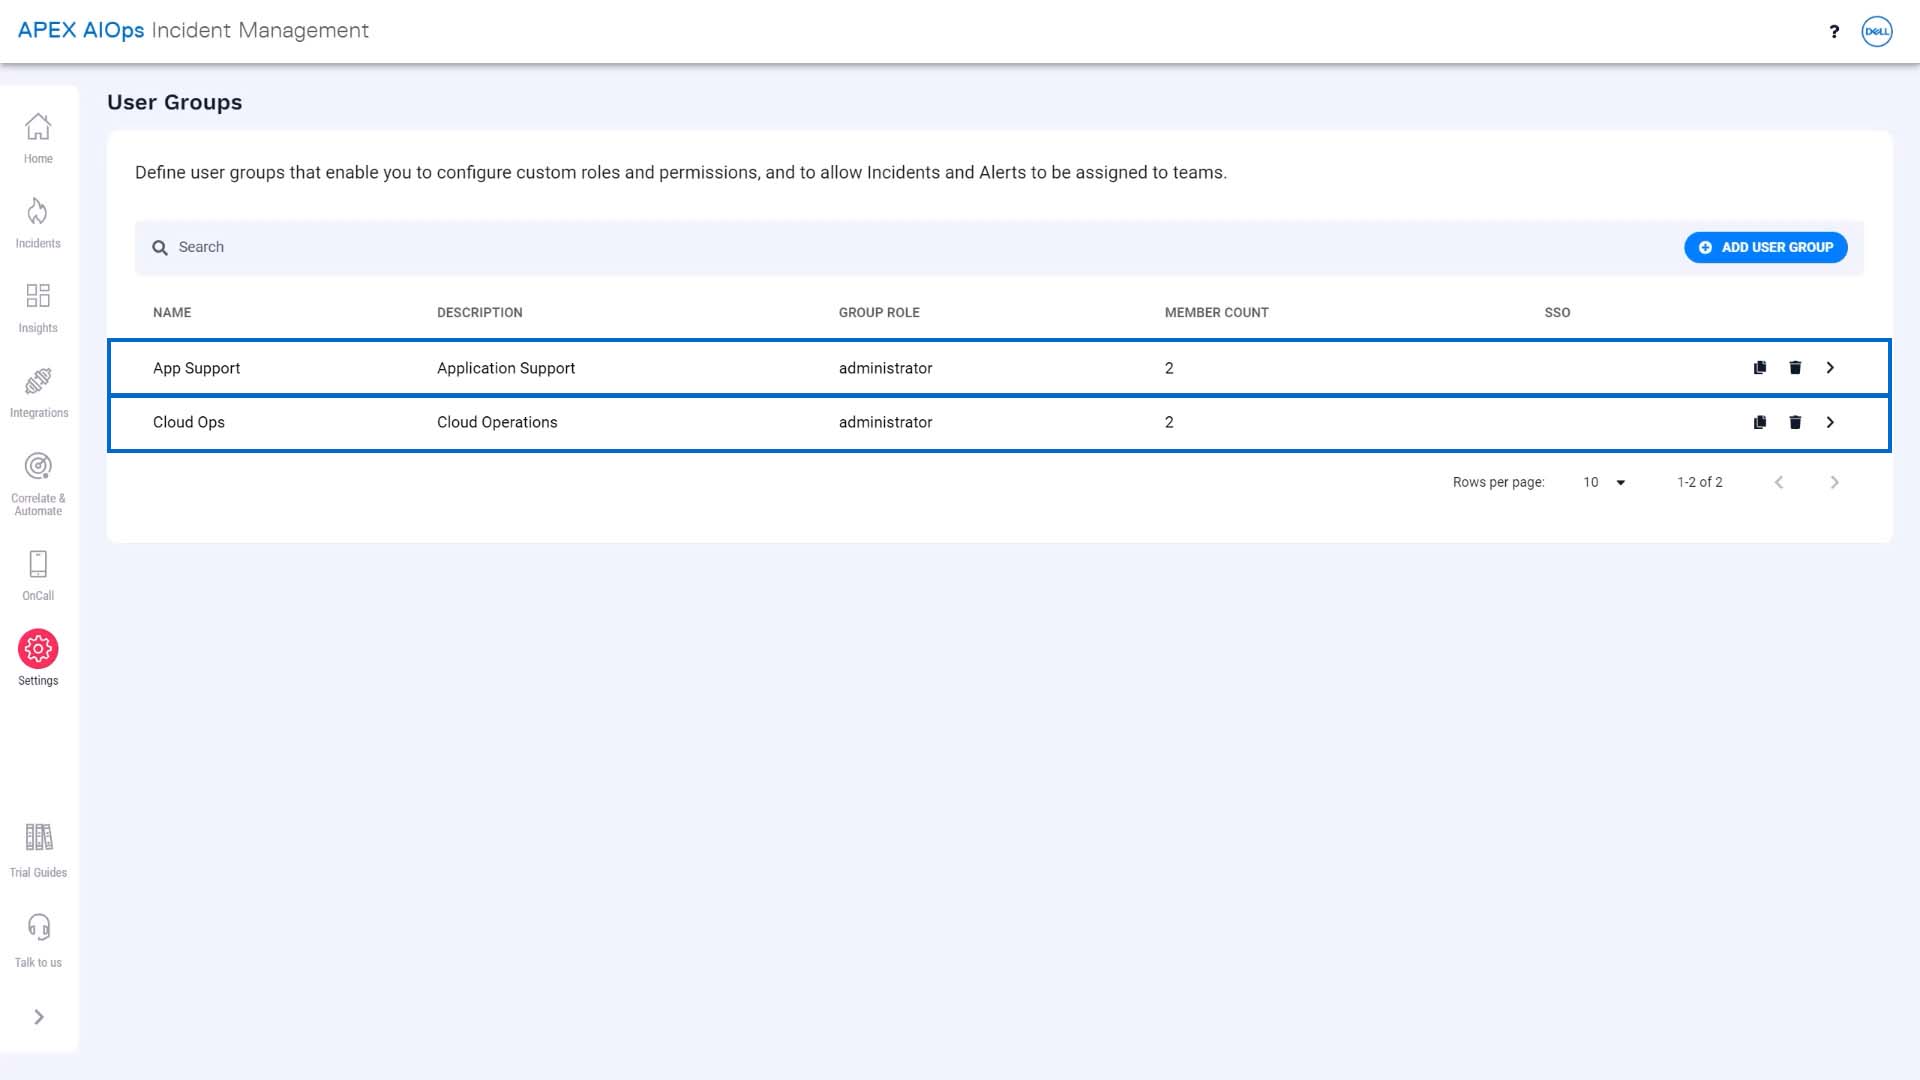
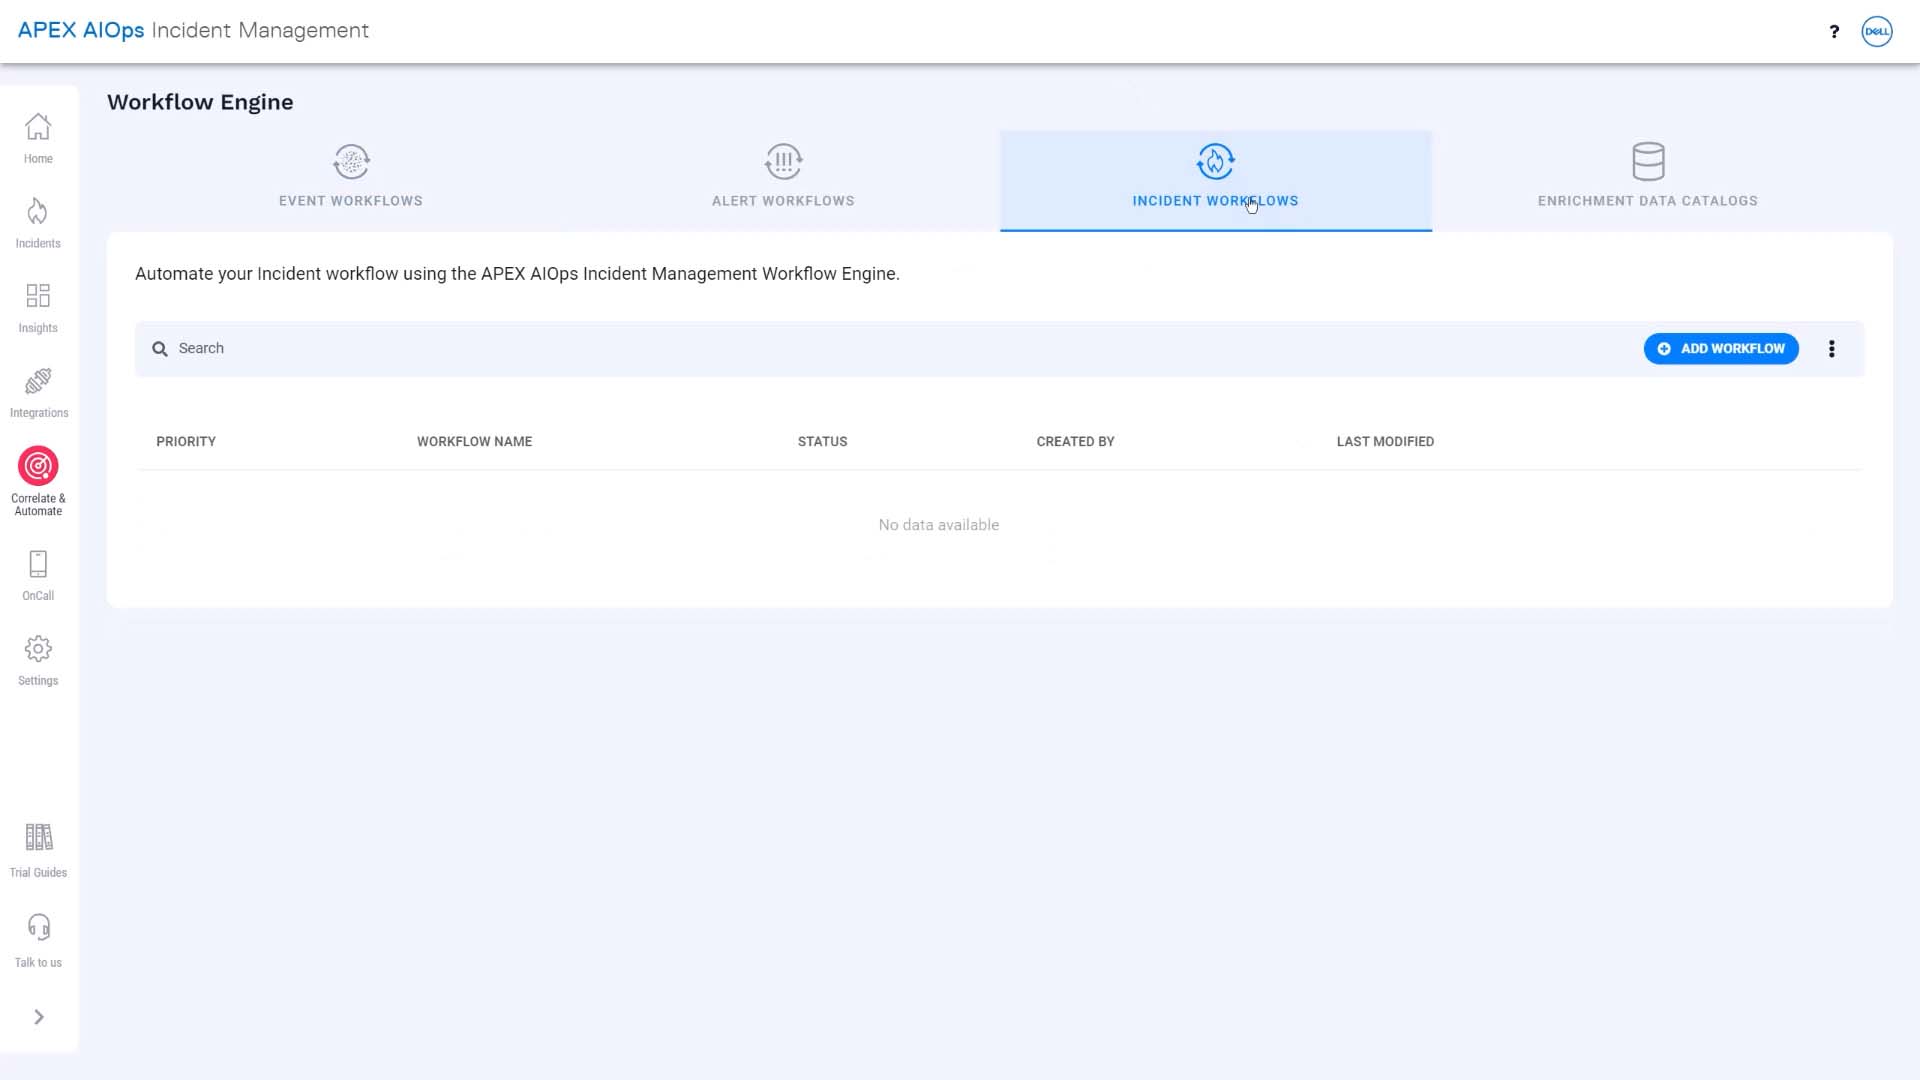
This is where you set up all the workflows, and what we want is a workflow to process incidents.
We’ll name and describe the workflow.
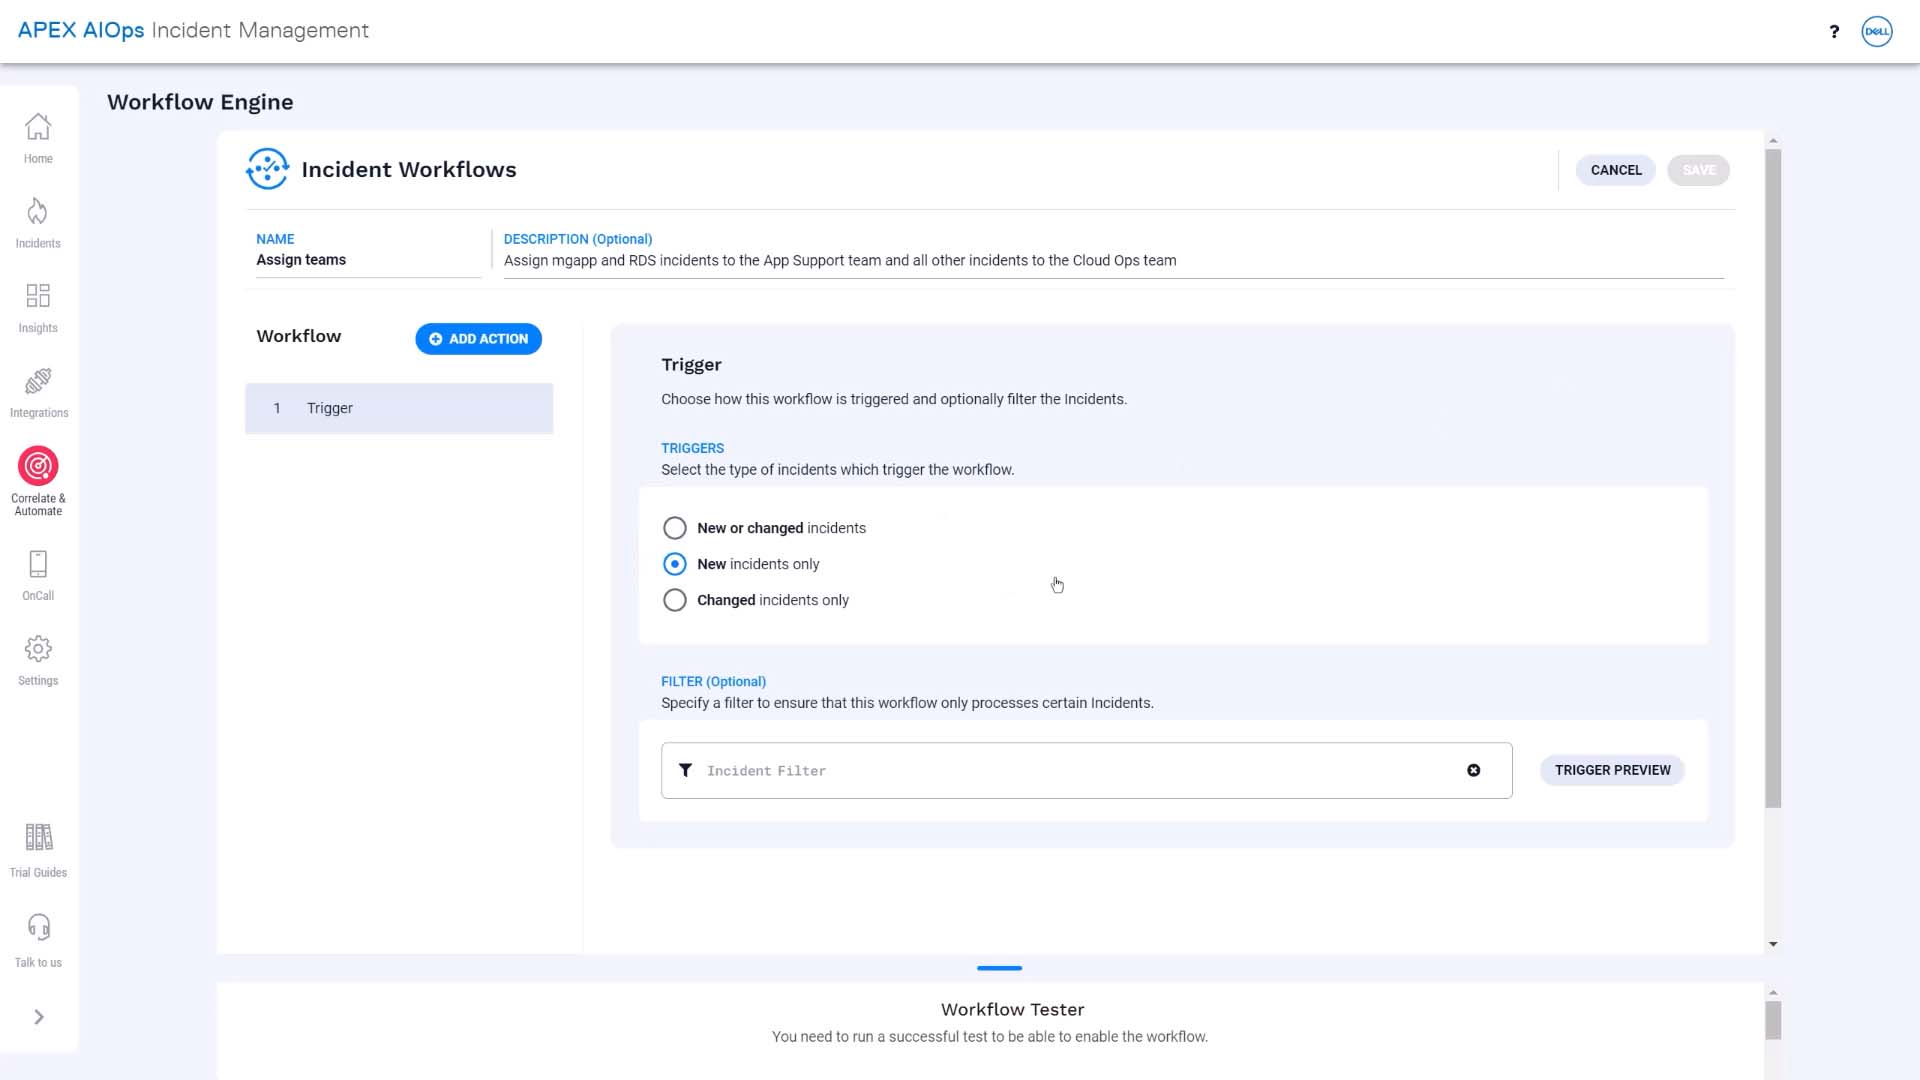
What we want this workflow to do is to take effect when incidents are first created.
Next, we are going to set up the action for qualifying incidents. We want to assign. And, in our case, the assignee is not an individual but a team. That takes care of the default team assignment.
Next, we’ll set up a filter so the workflow will continue processing just the incidents that should go to the App Support team.
And make another assignment action just for those incidents.
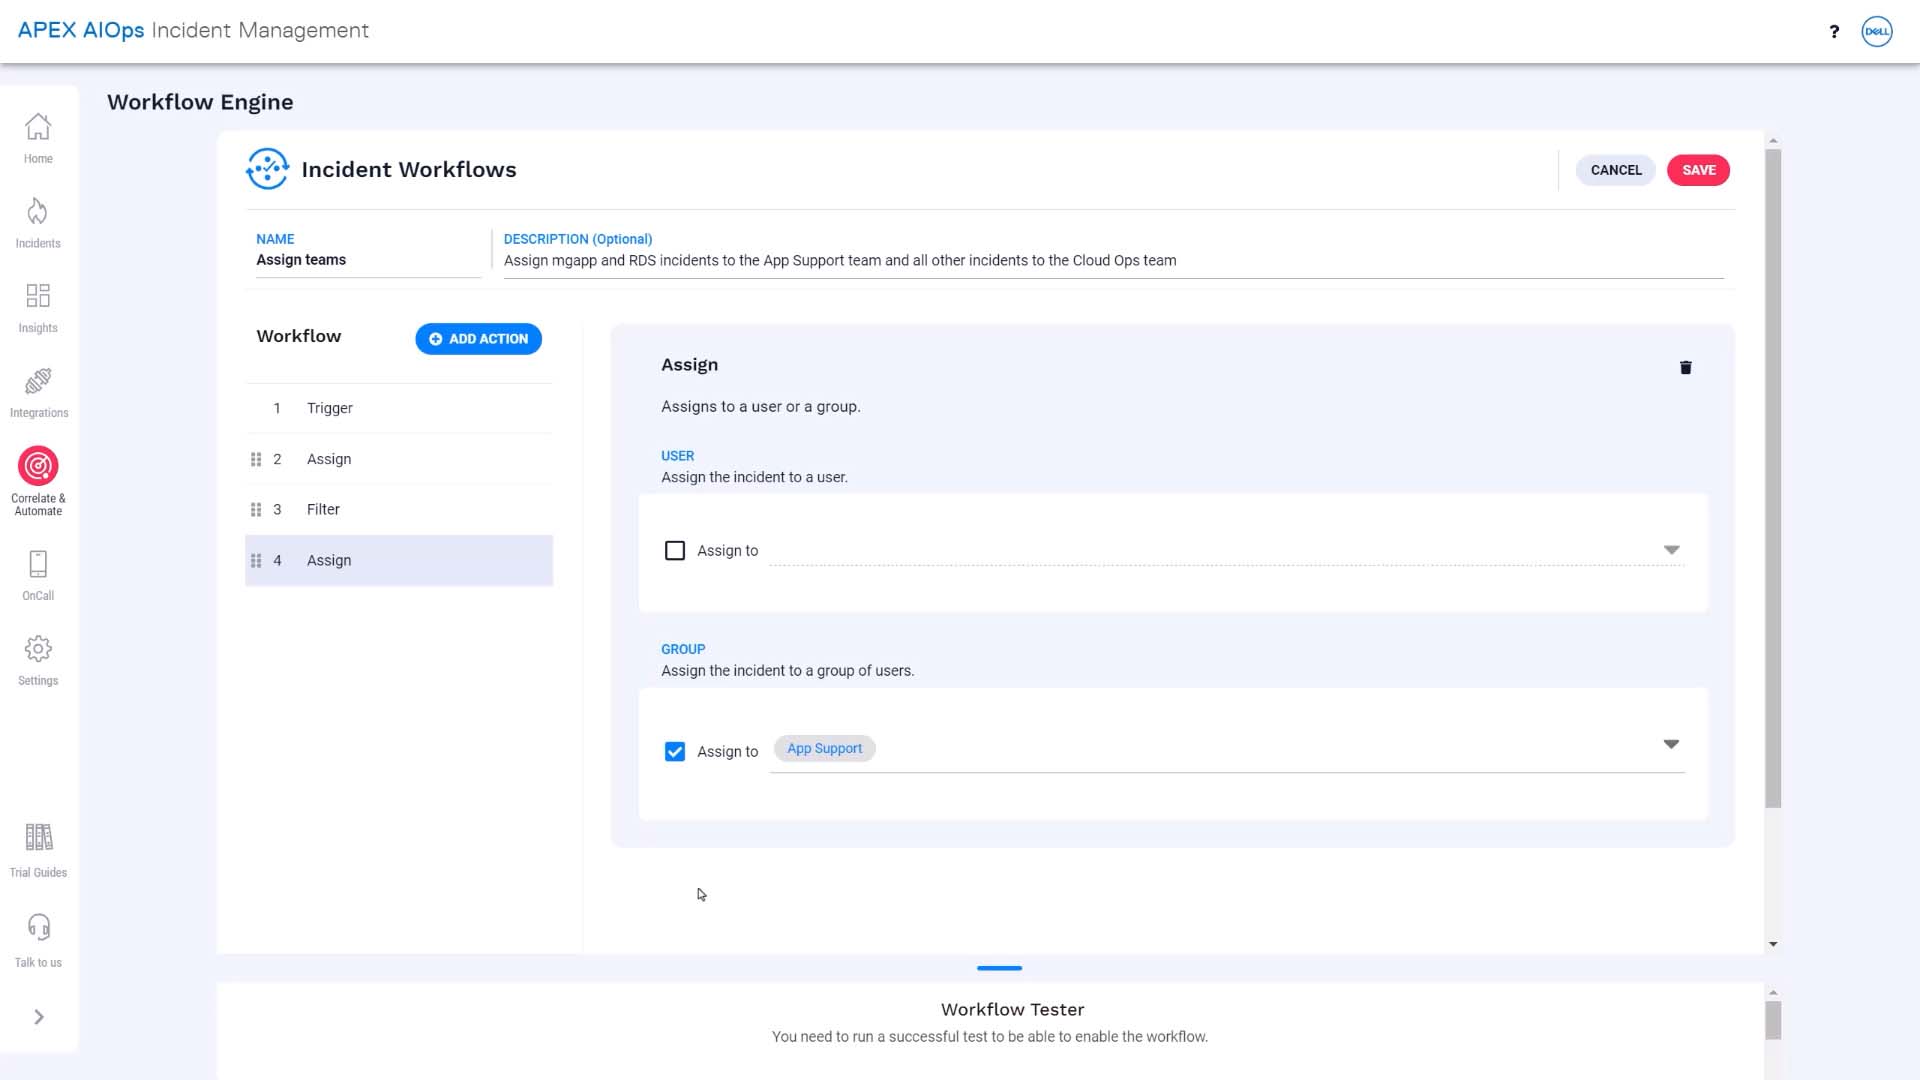
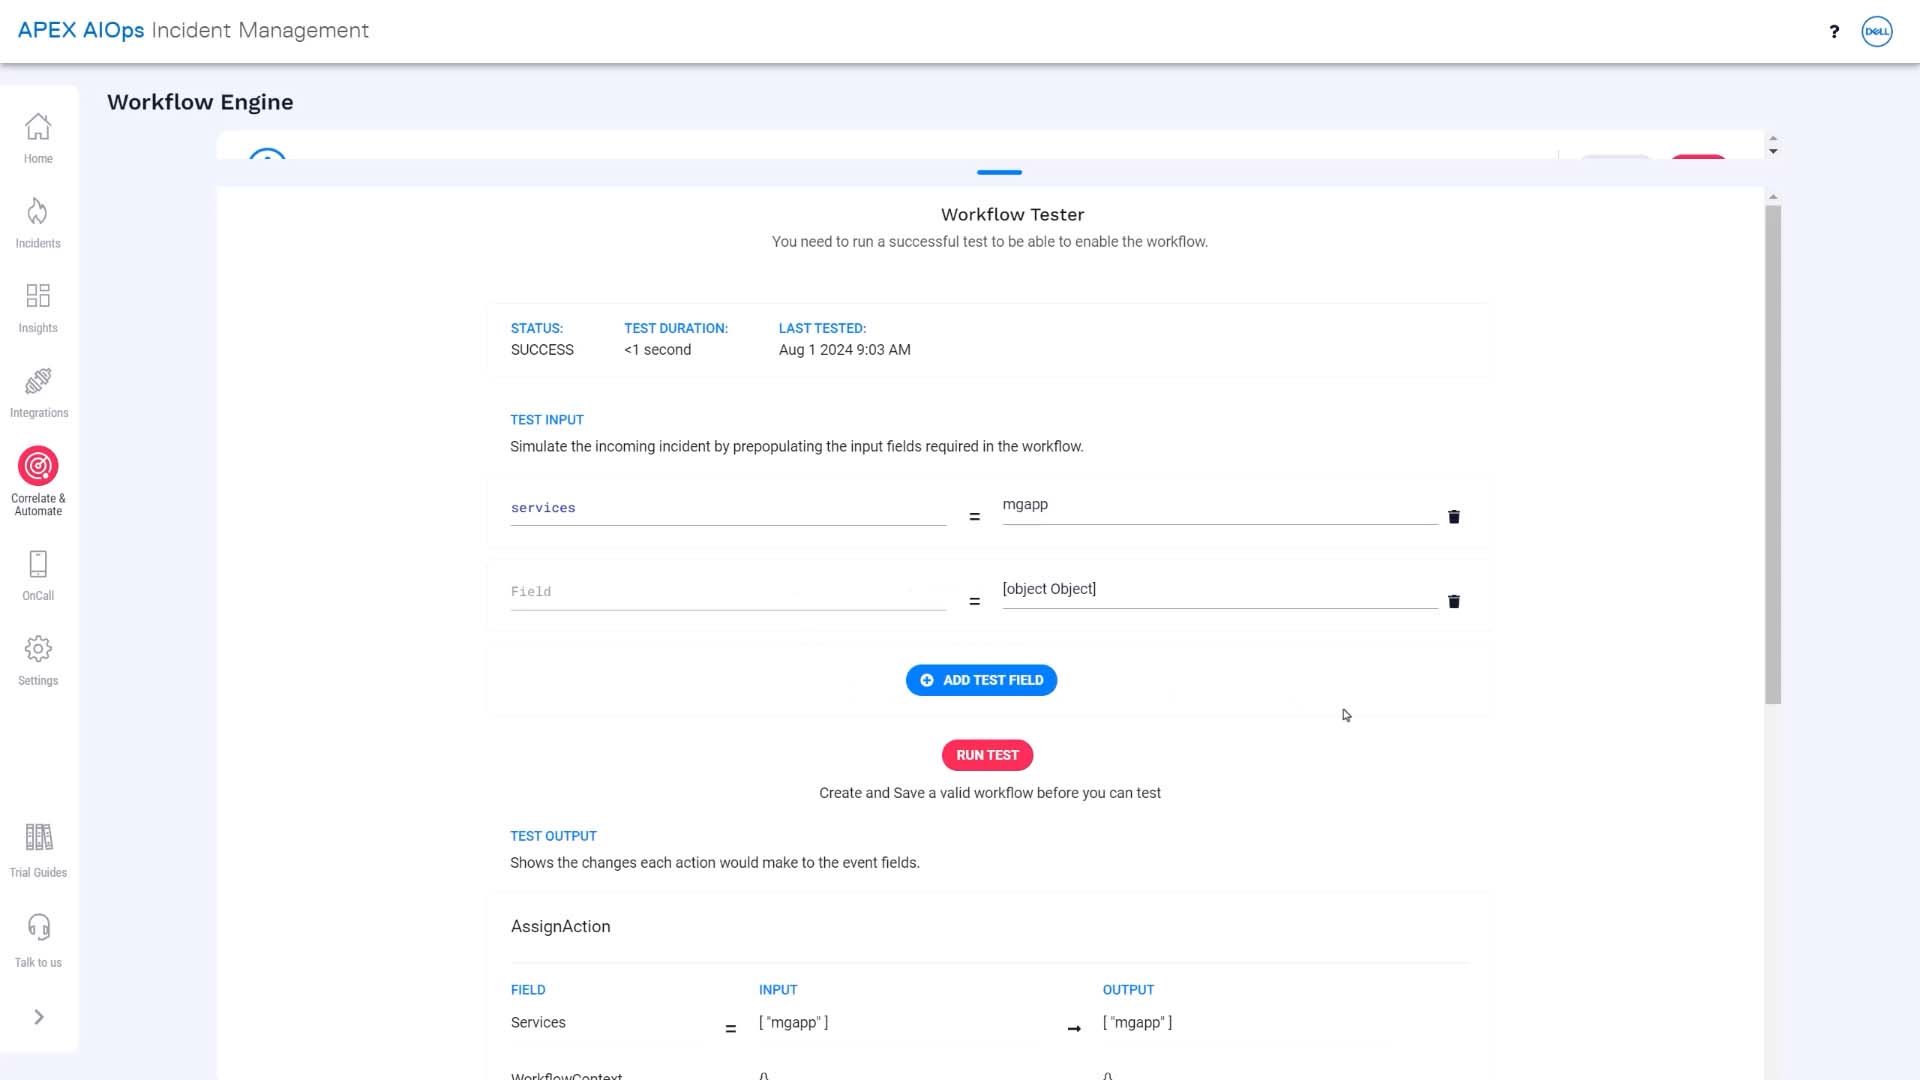
Workflow tester lets you check if the workflow produces the result you expect. This shows the assigned group updating successfully.
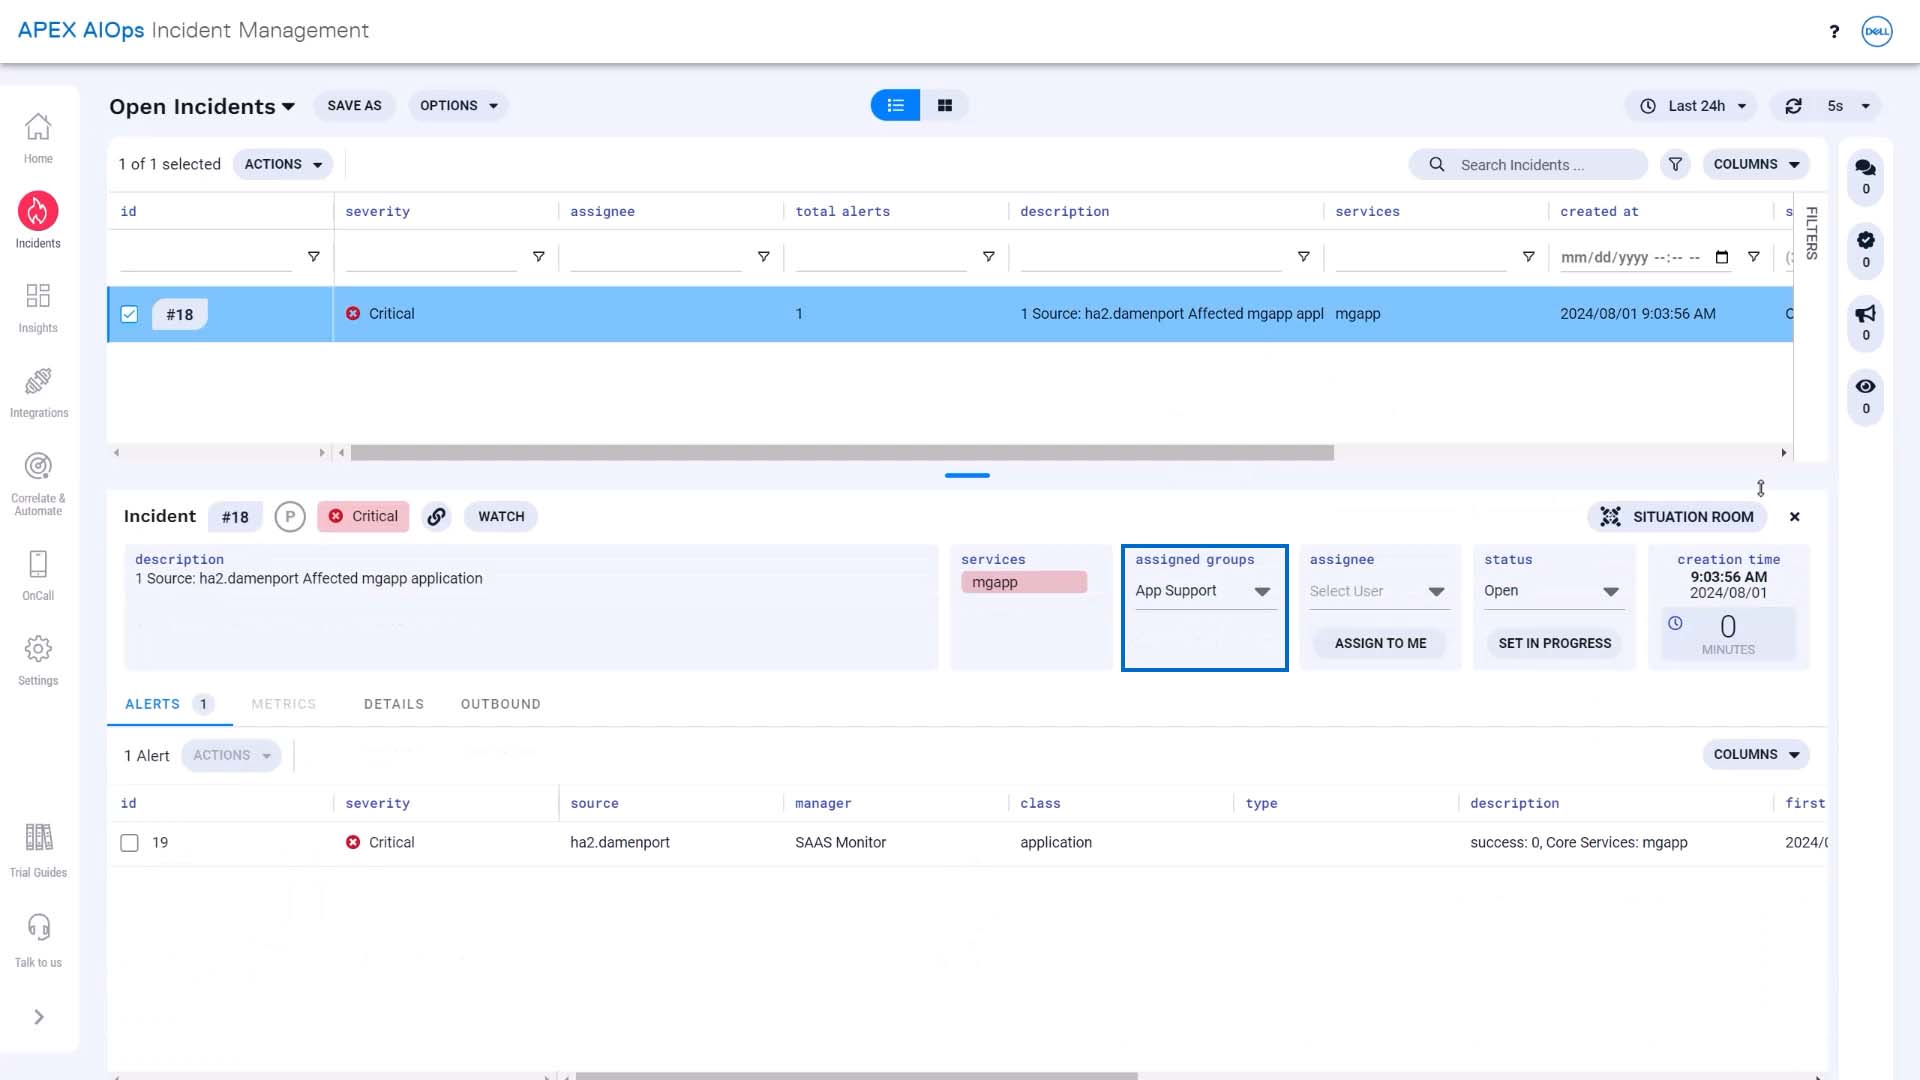
We can enable the workflow. A new incident is created, and the workflow kicks in and updates the team assignment without any manual intervention. Success!
The next example is to put in delay. Many of you have set up integrations to send Incident Management incidents to external systems.
But as you know, incidents sometimes resolve themselves, or their severity decreases. So you don’t want to route the incident information right away. A delay action is what you need.
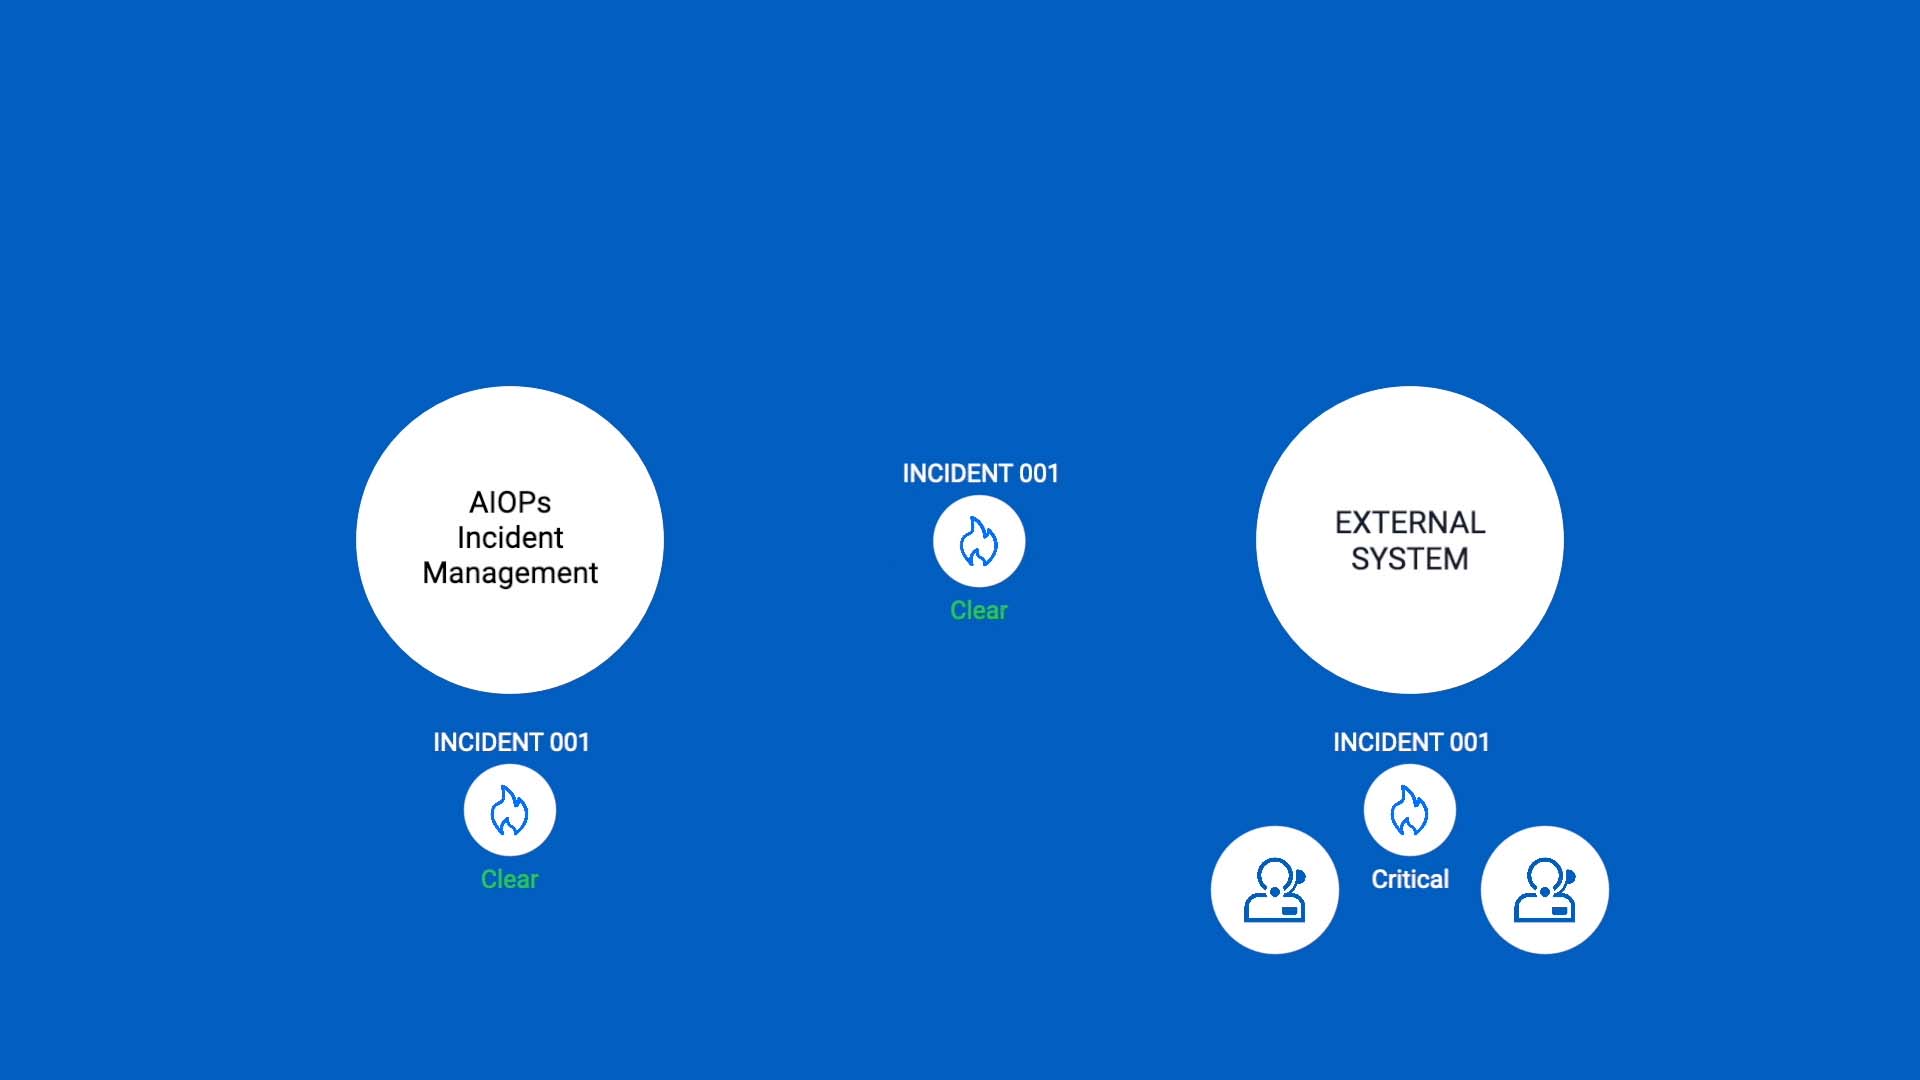
Suppose you want to send critical incidents to Datadog, but only if they are still unresolved after 30 minutes. Here’s how we’ll do that.
First, we’ll set up a workflow to process incidents when they are created. We’ll use an entry filter so only incidents with a critical severity enter the workflow.
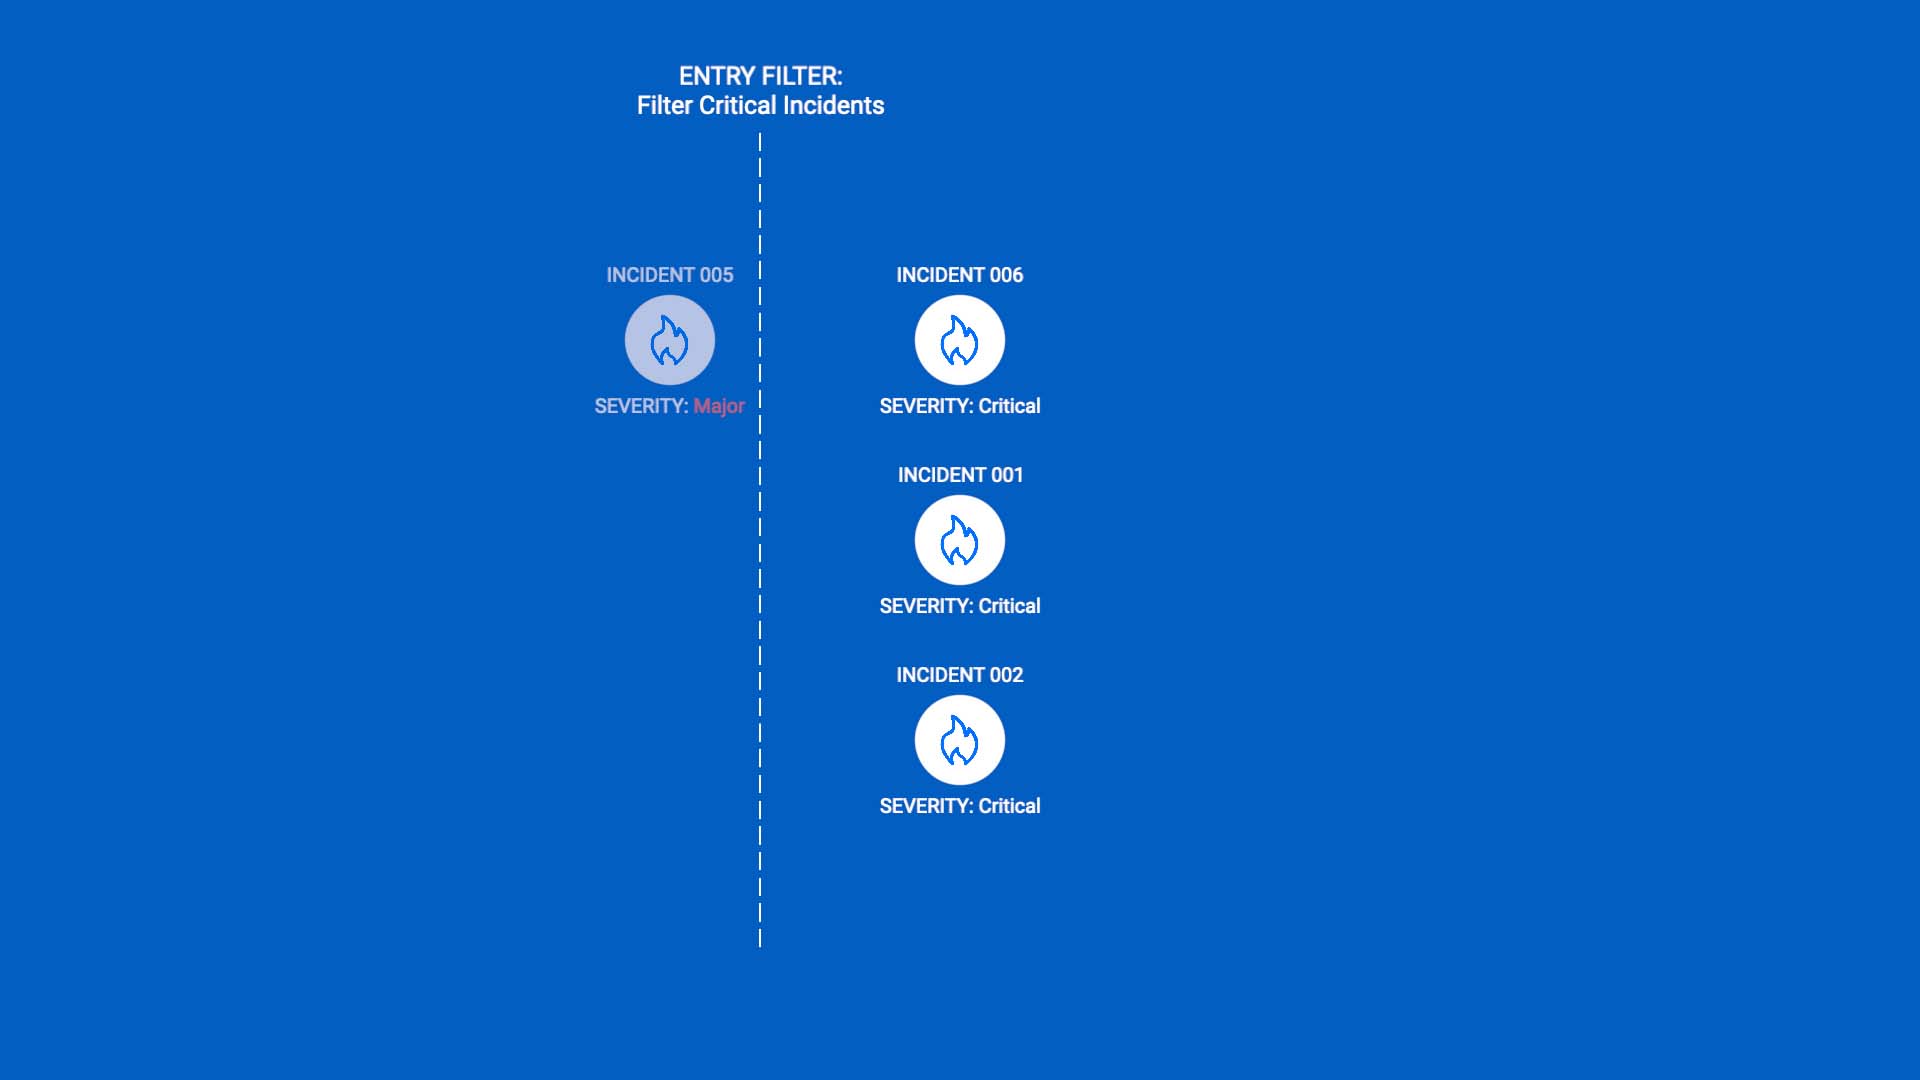
Then, we’ll add a delay.
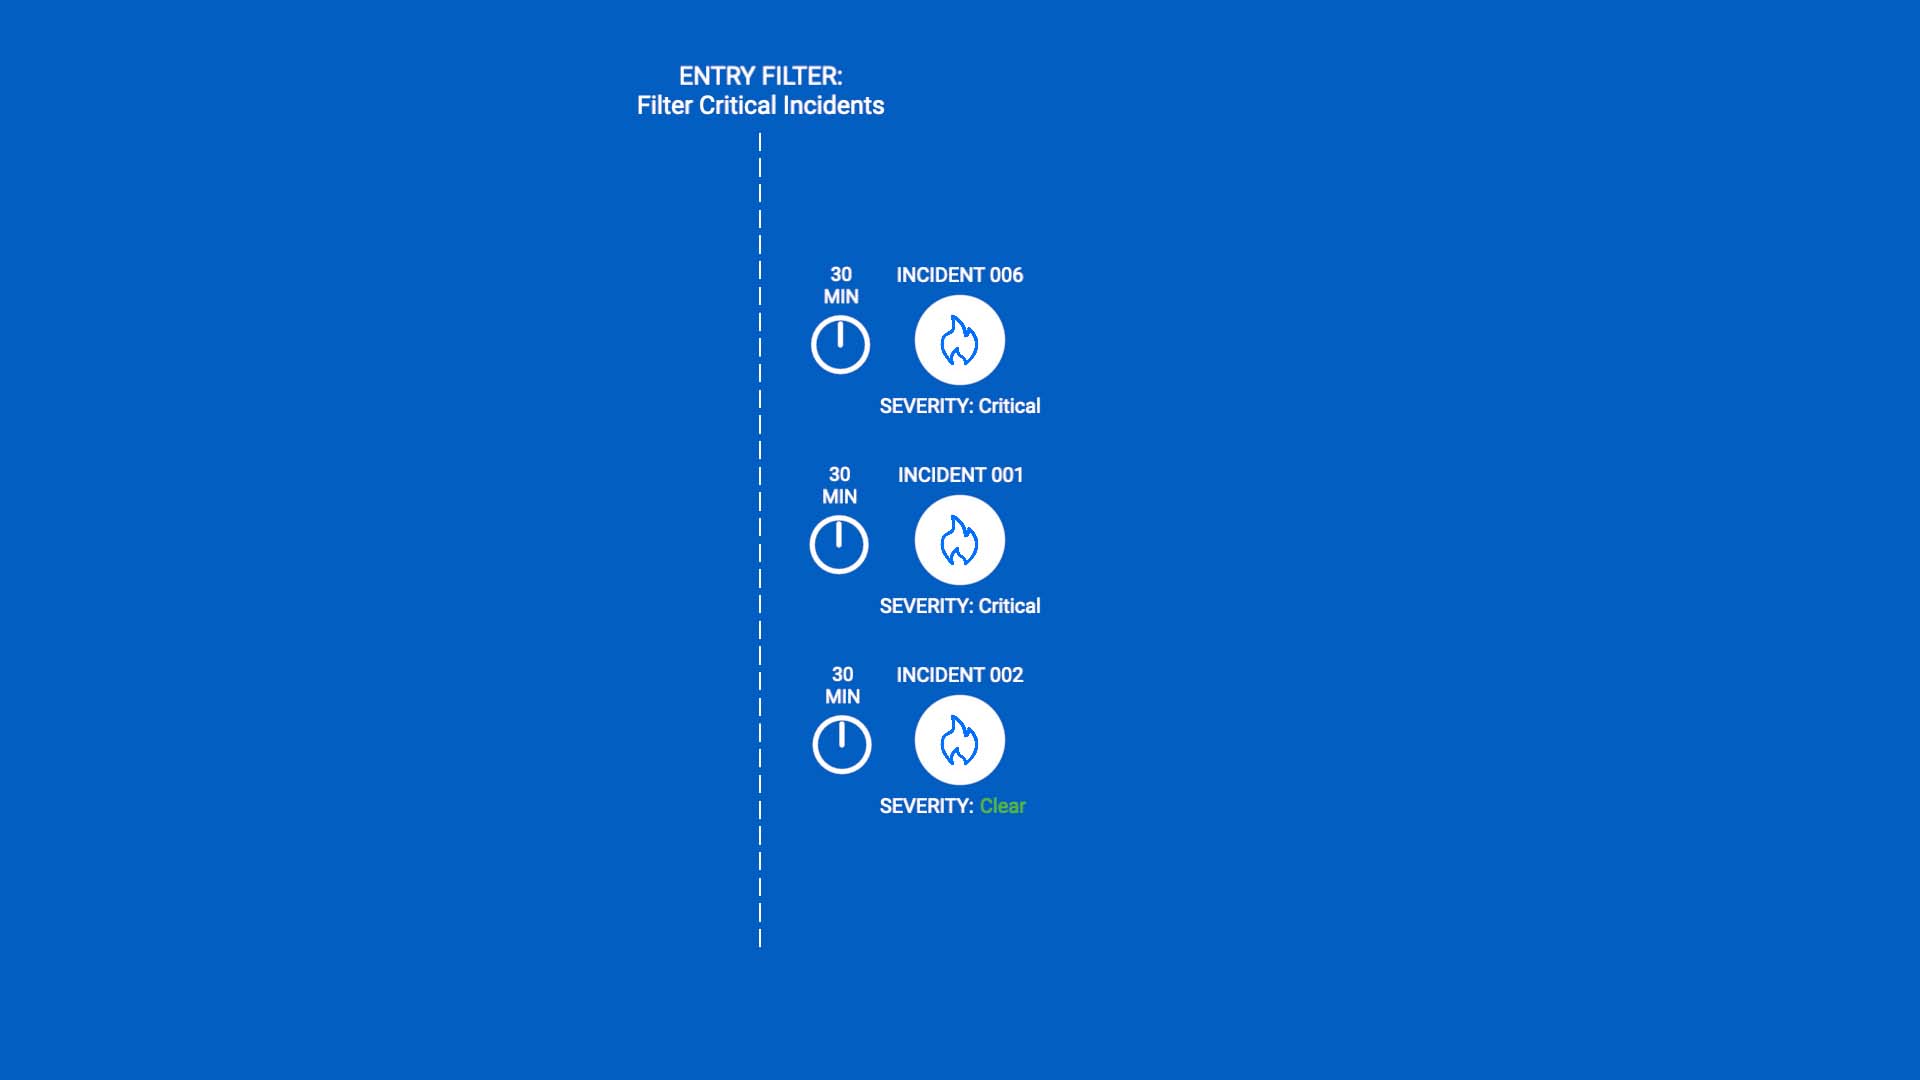
Next, we’ll add another filter for critical severity, so incidents that have become less severe won’t pass.
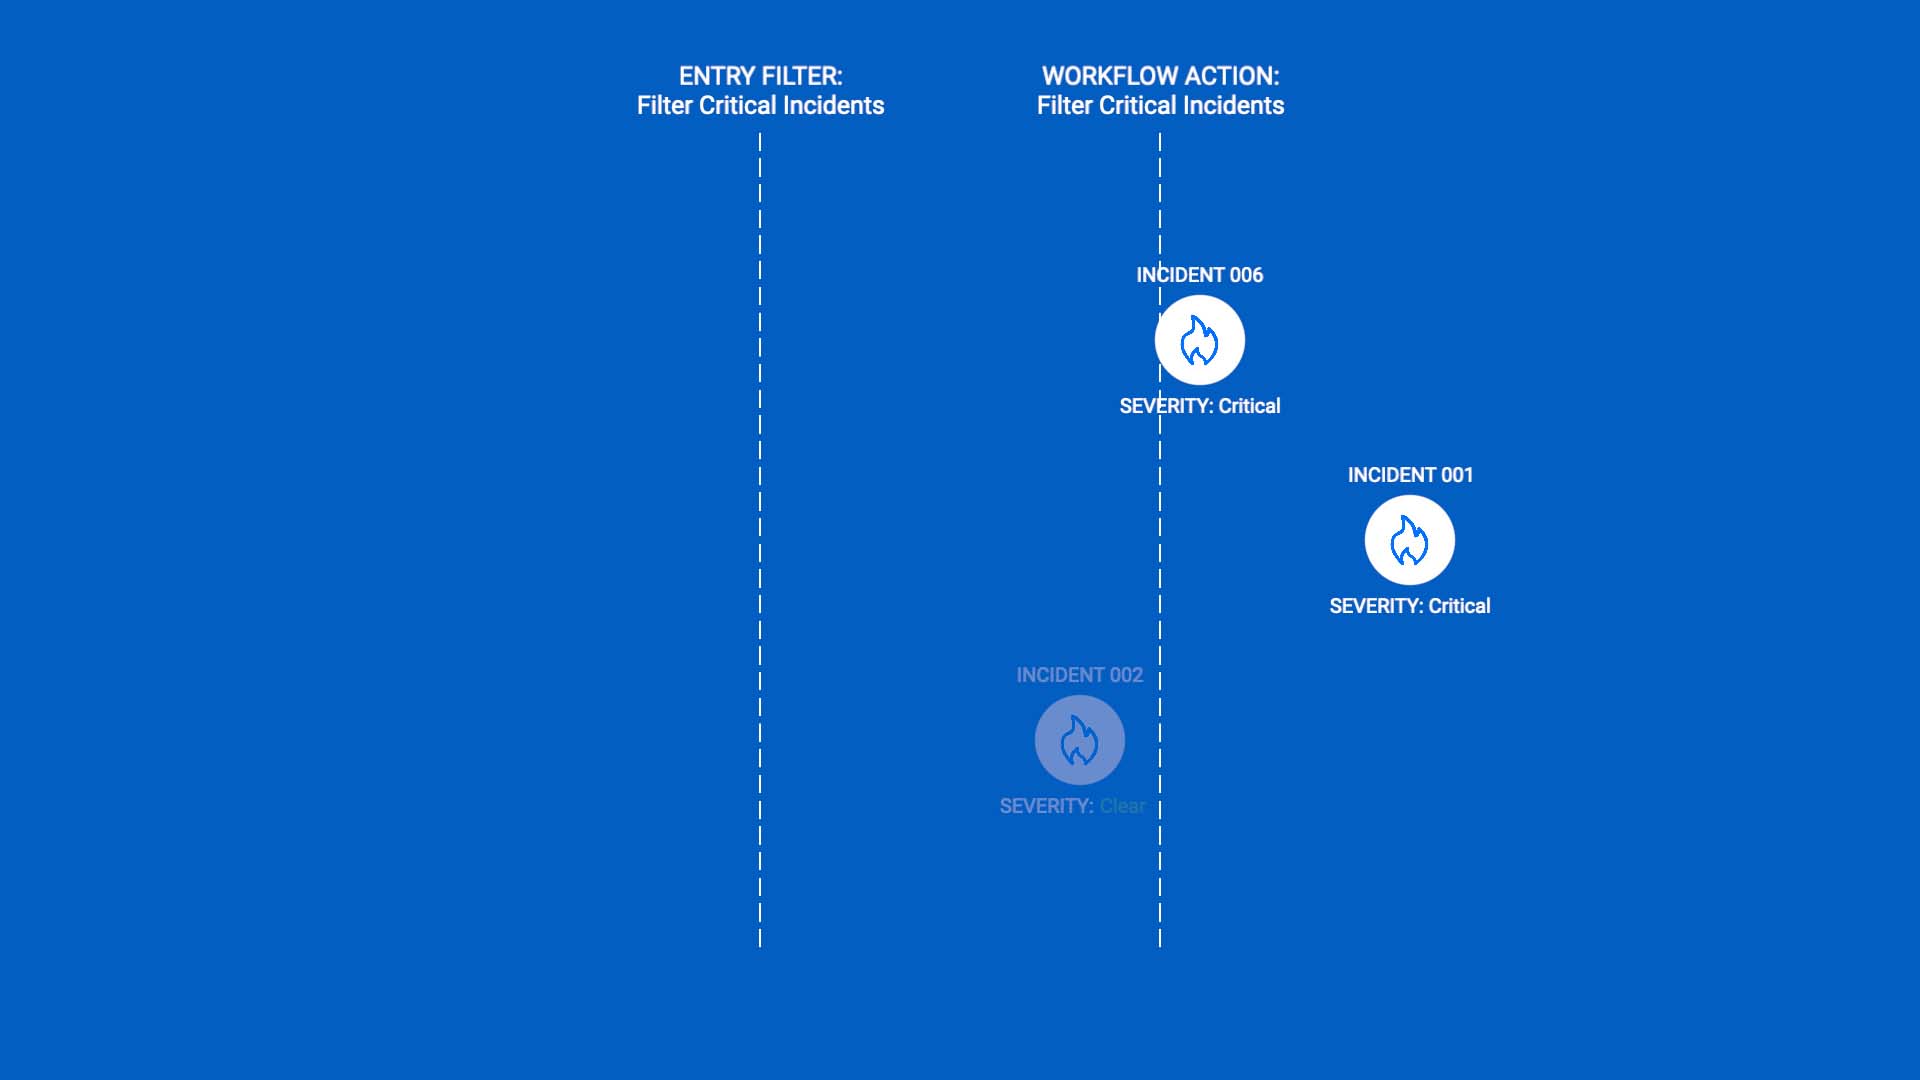
And finally, we’ll use a send to endpoint action to route the remaining critical incidents to our Datadog integration.
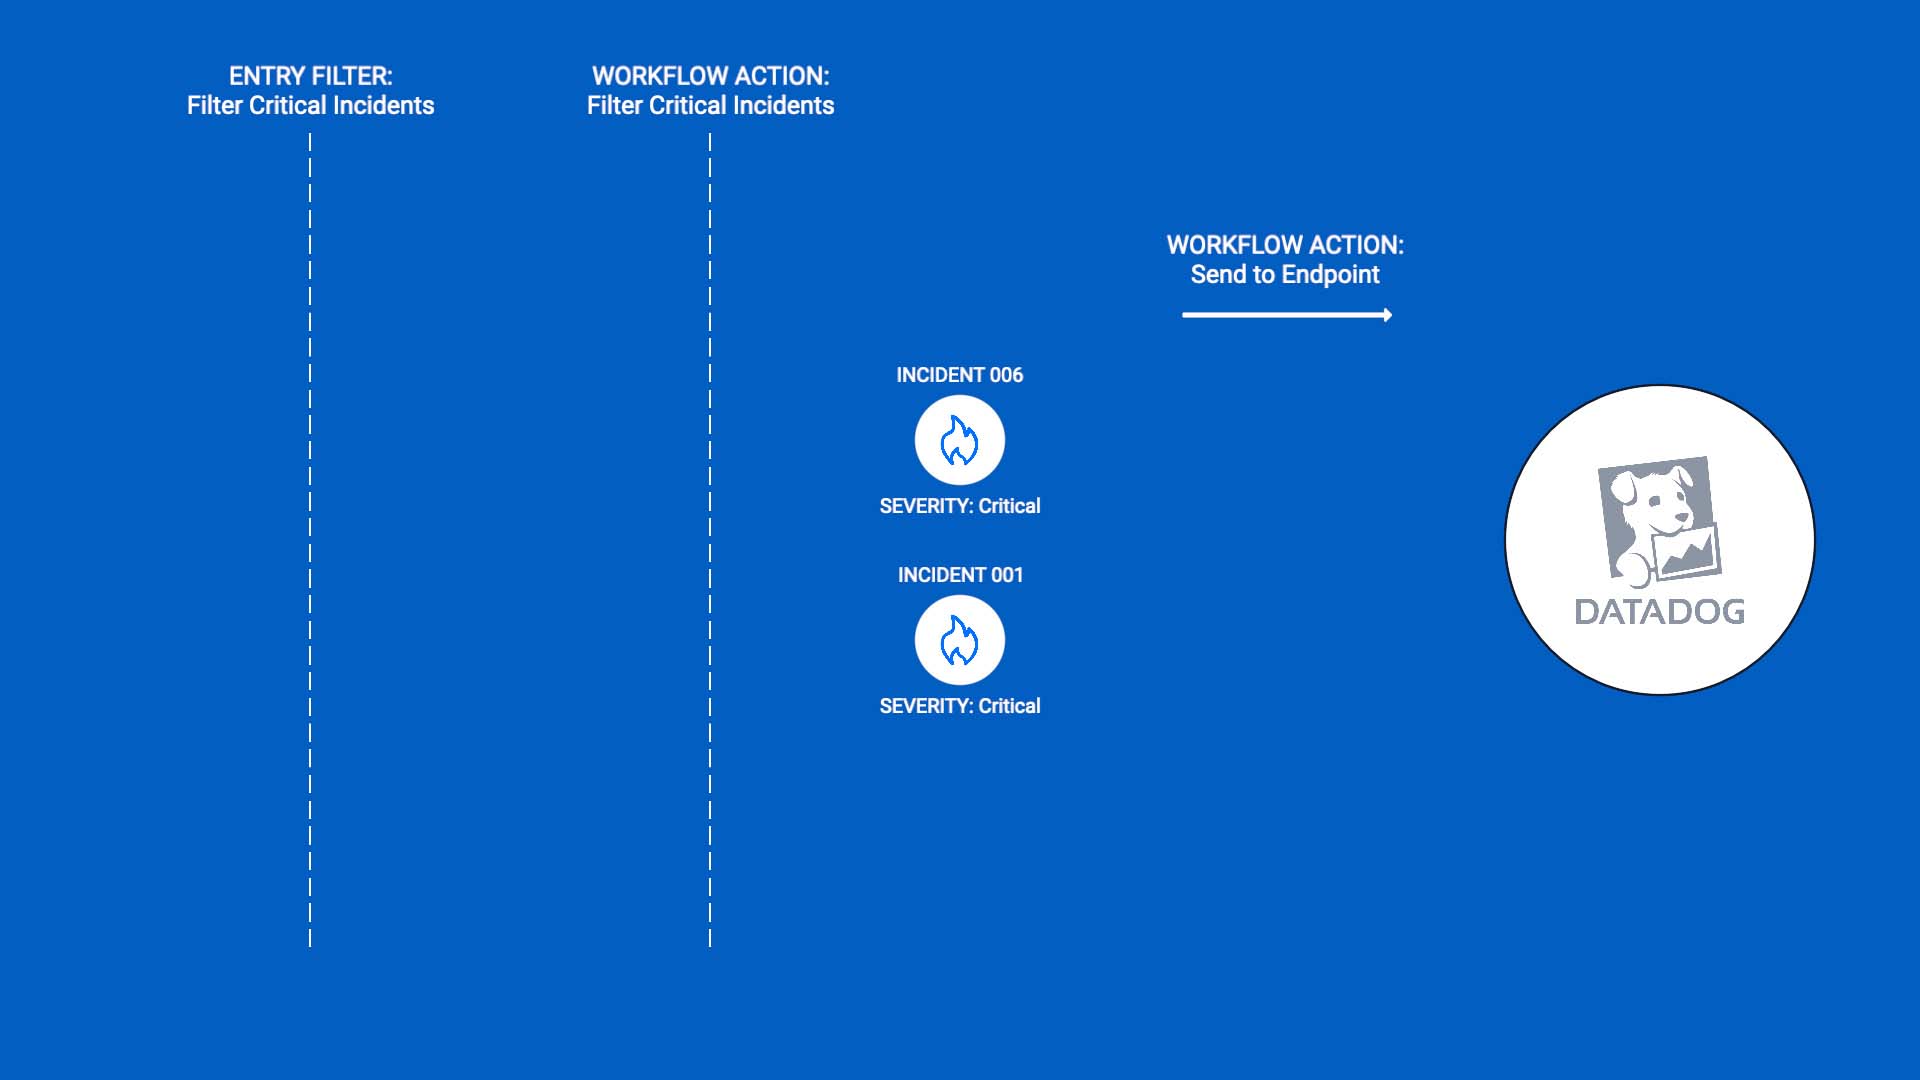
Here’s what that looks like. We’ll add a new workflow. We'll name and describe it, and set it to start up when an incident is created. We’ll filter for critical incidents.
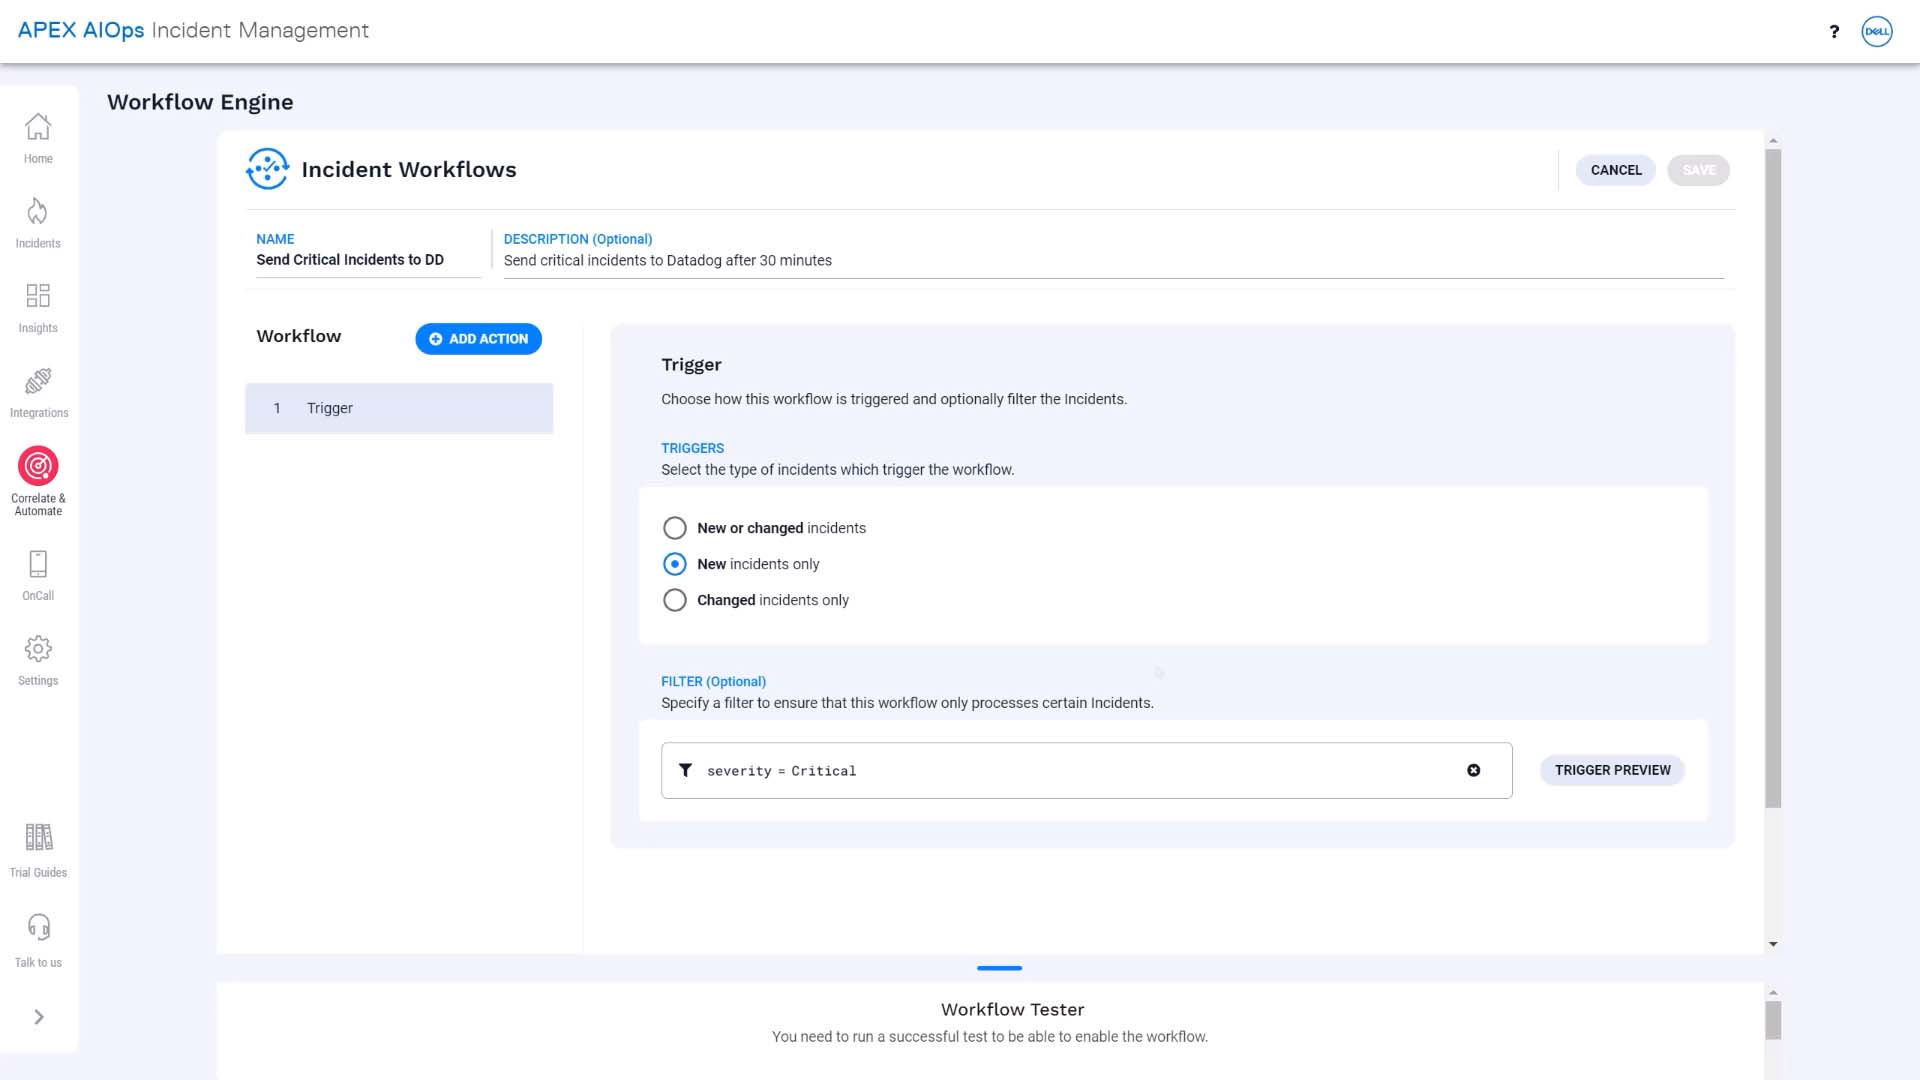
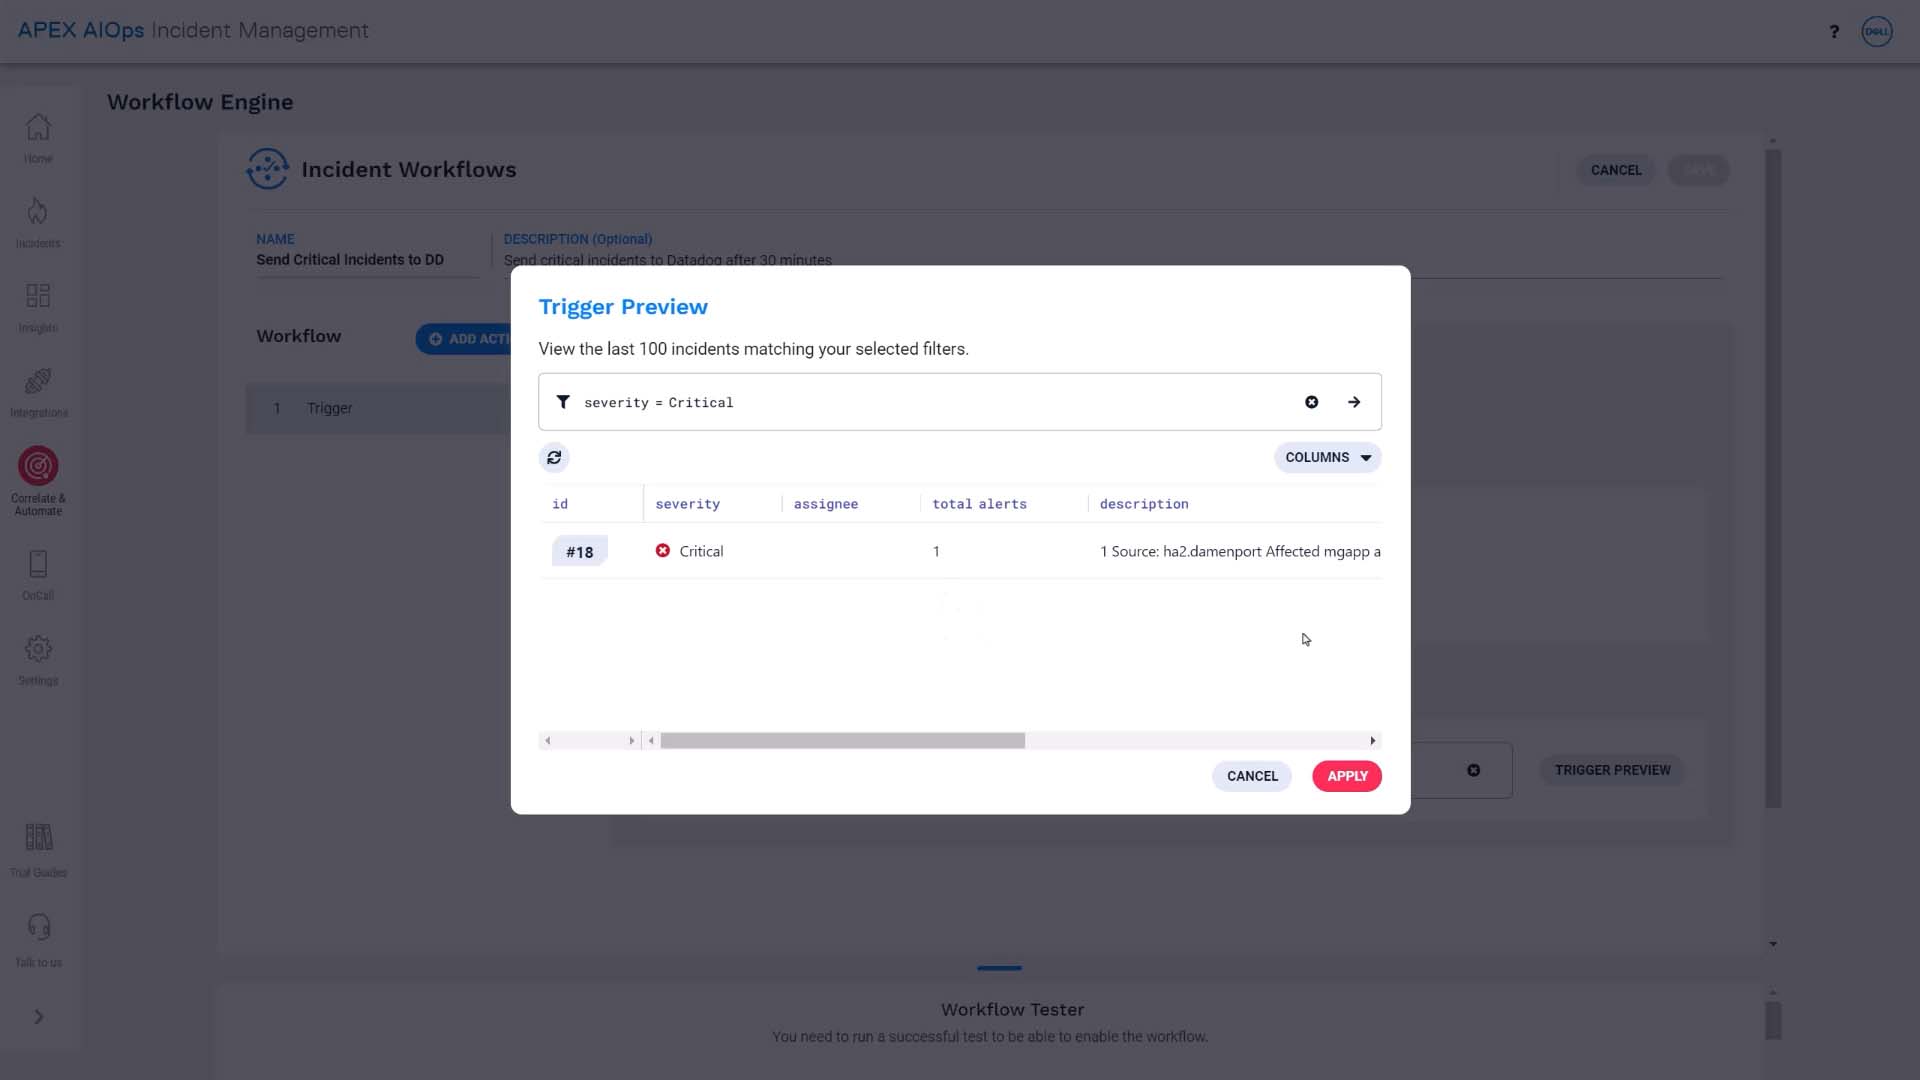
This preview button is convenient. You can test and see if you are getting the intended result.
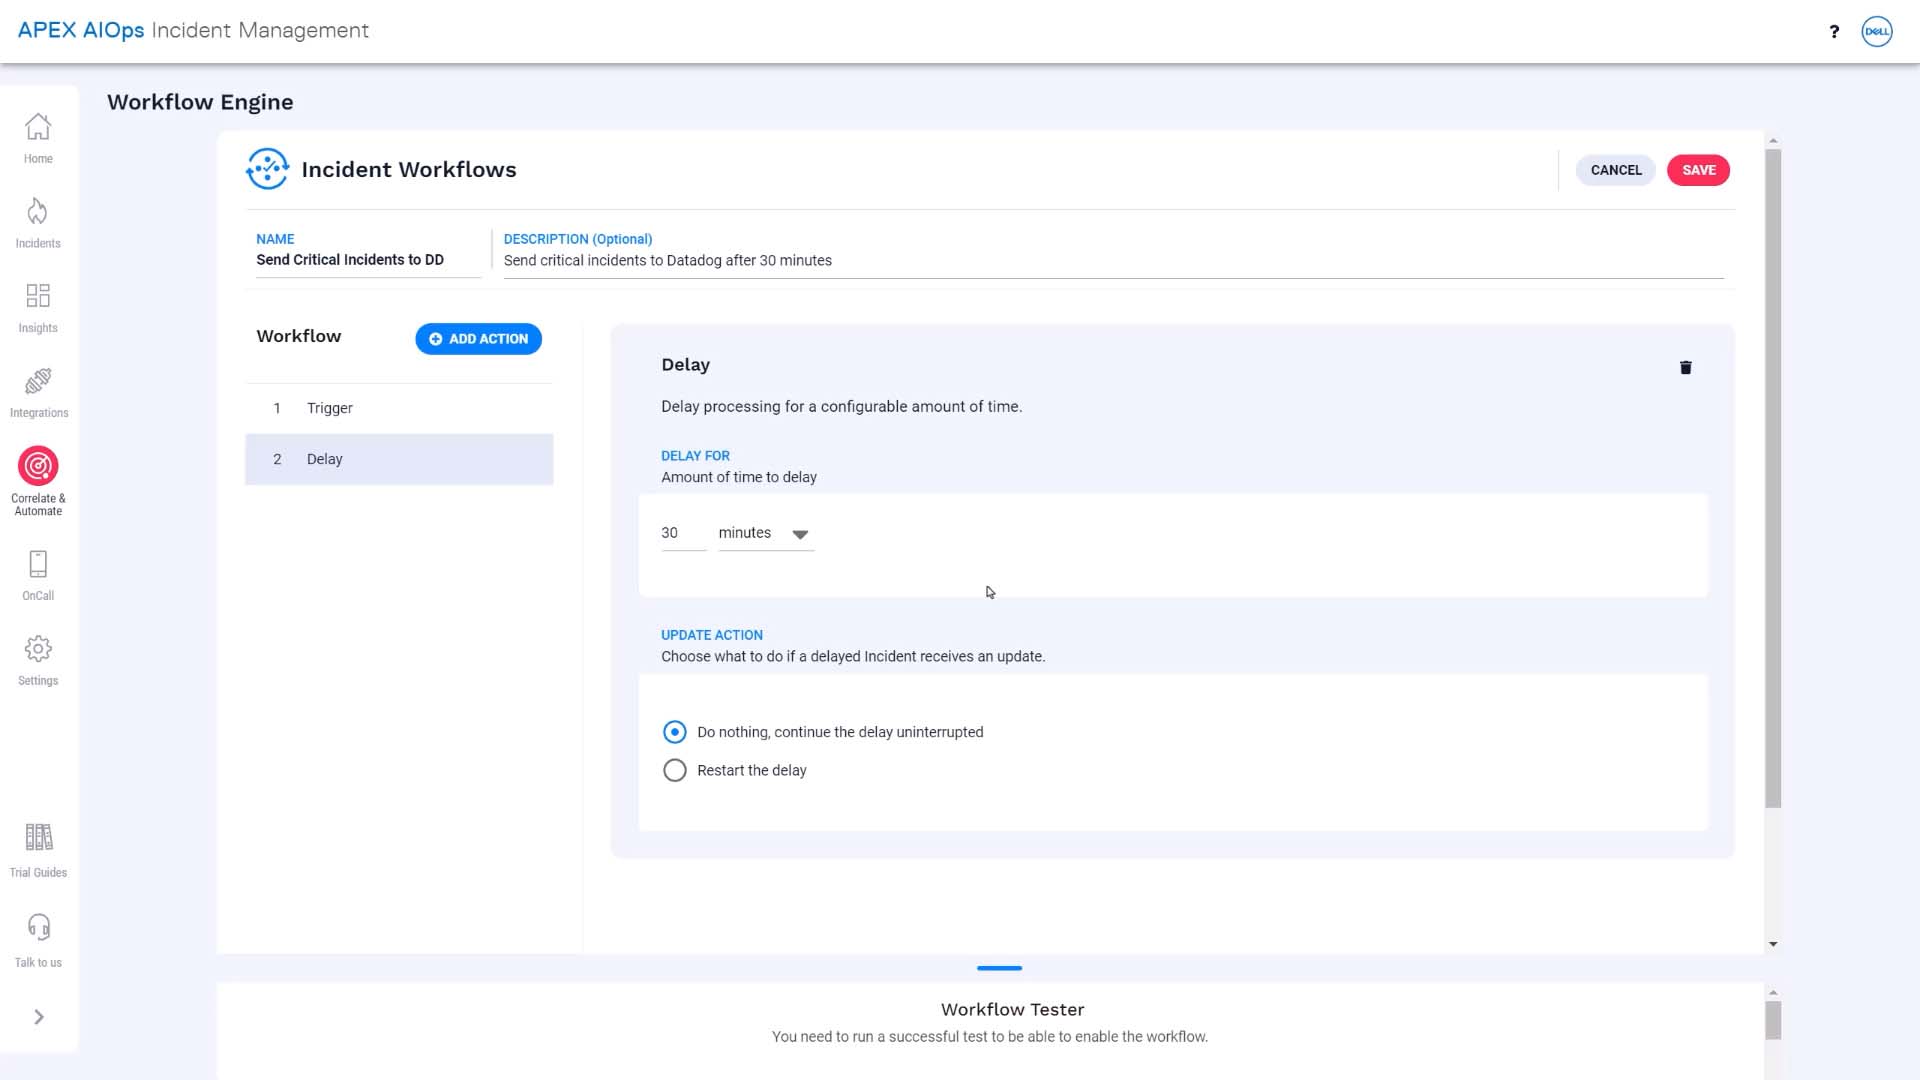
We’ll add a delay action, and set the delay to 30 minutes.
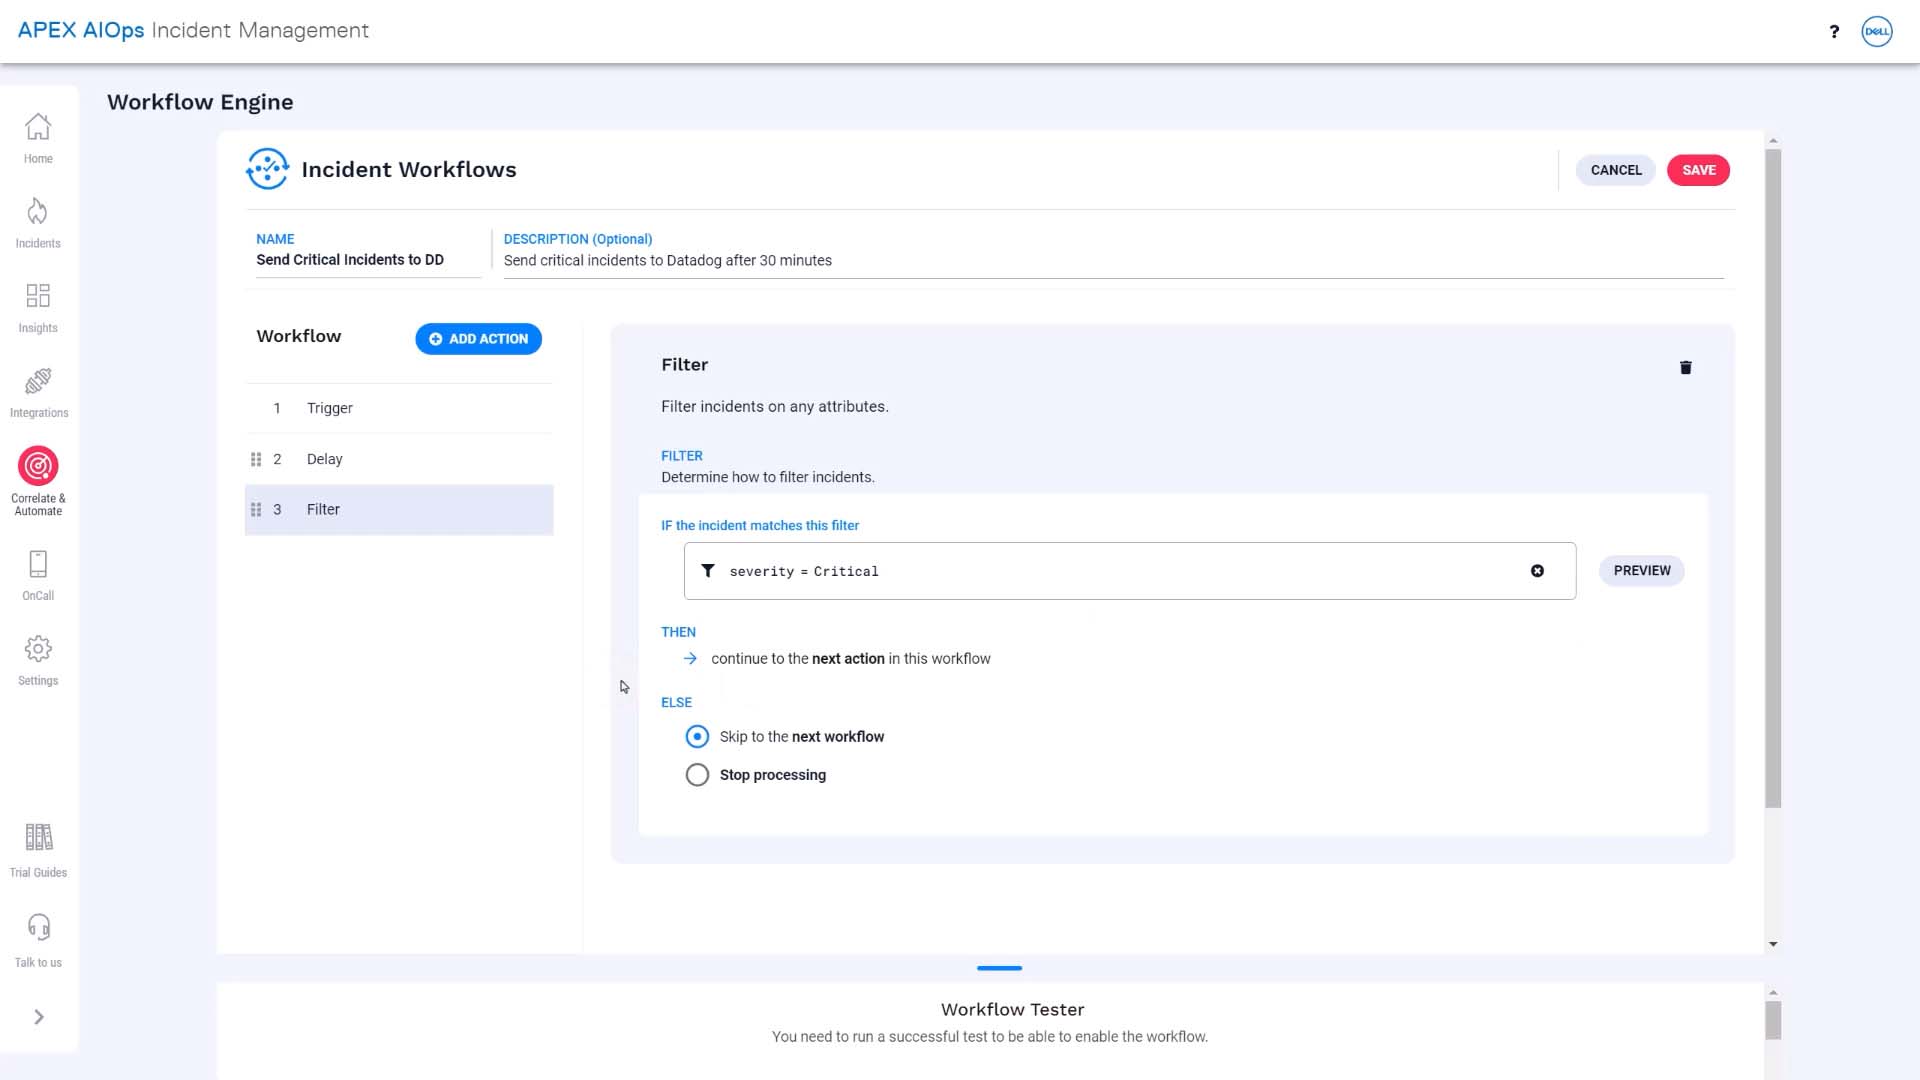
Next we’ll add another critical severity filter.
Any incidents that pass the second filter after the delay should go to Datadog. Here’s the action we need.
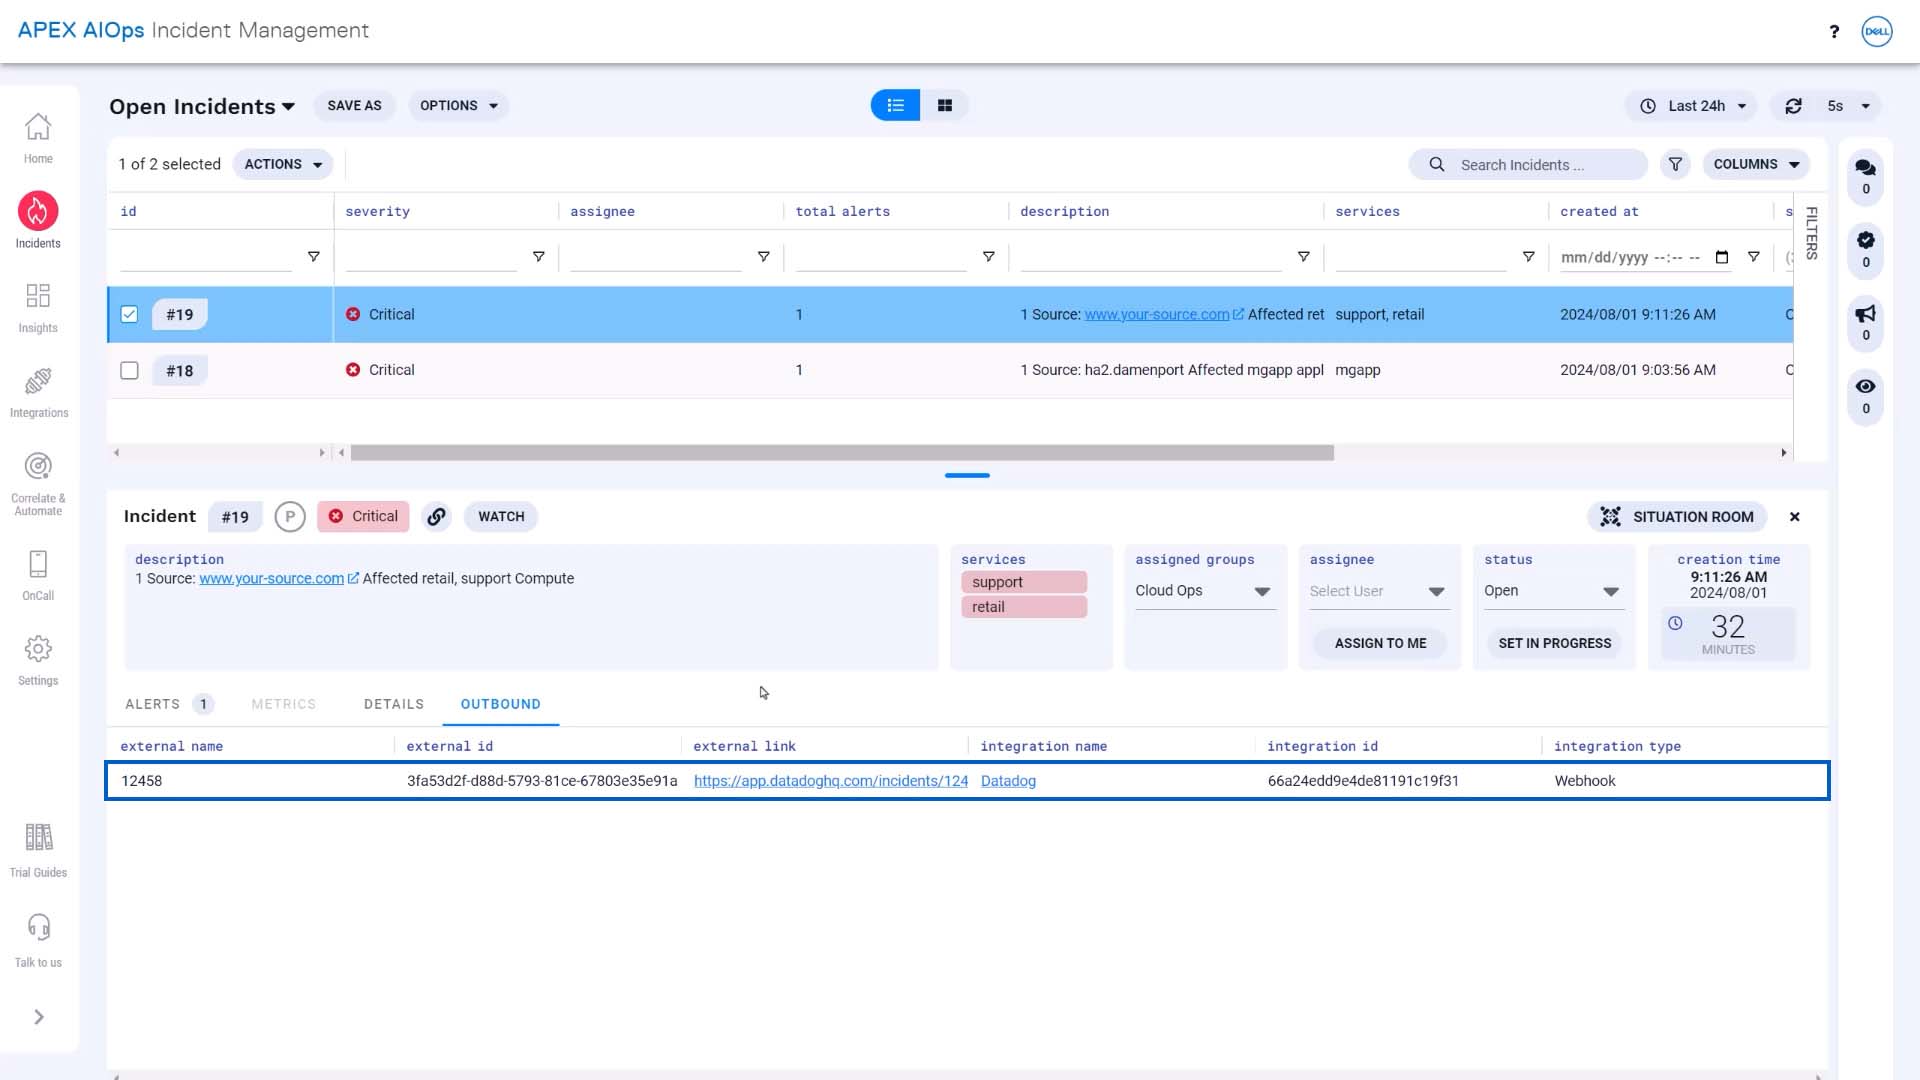
Our Datadog outbound webhook is already configured, so we’ll use that. You can read the Incident Management documentation to learn about configuring outbound integrations. This adds a link to the incident in Datadog to the Incident Management incident.
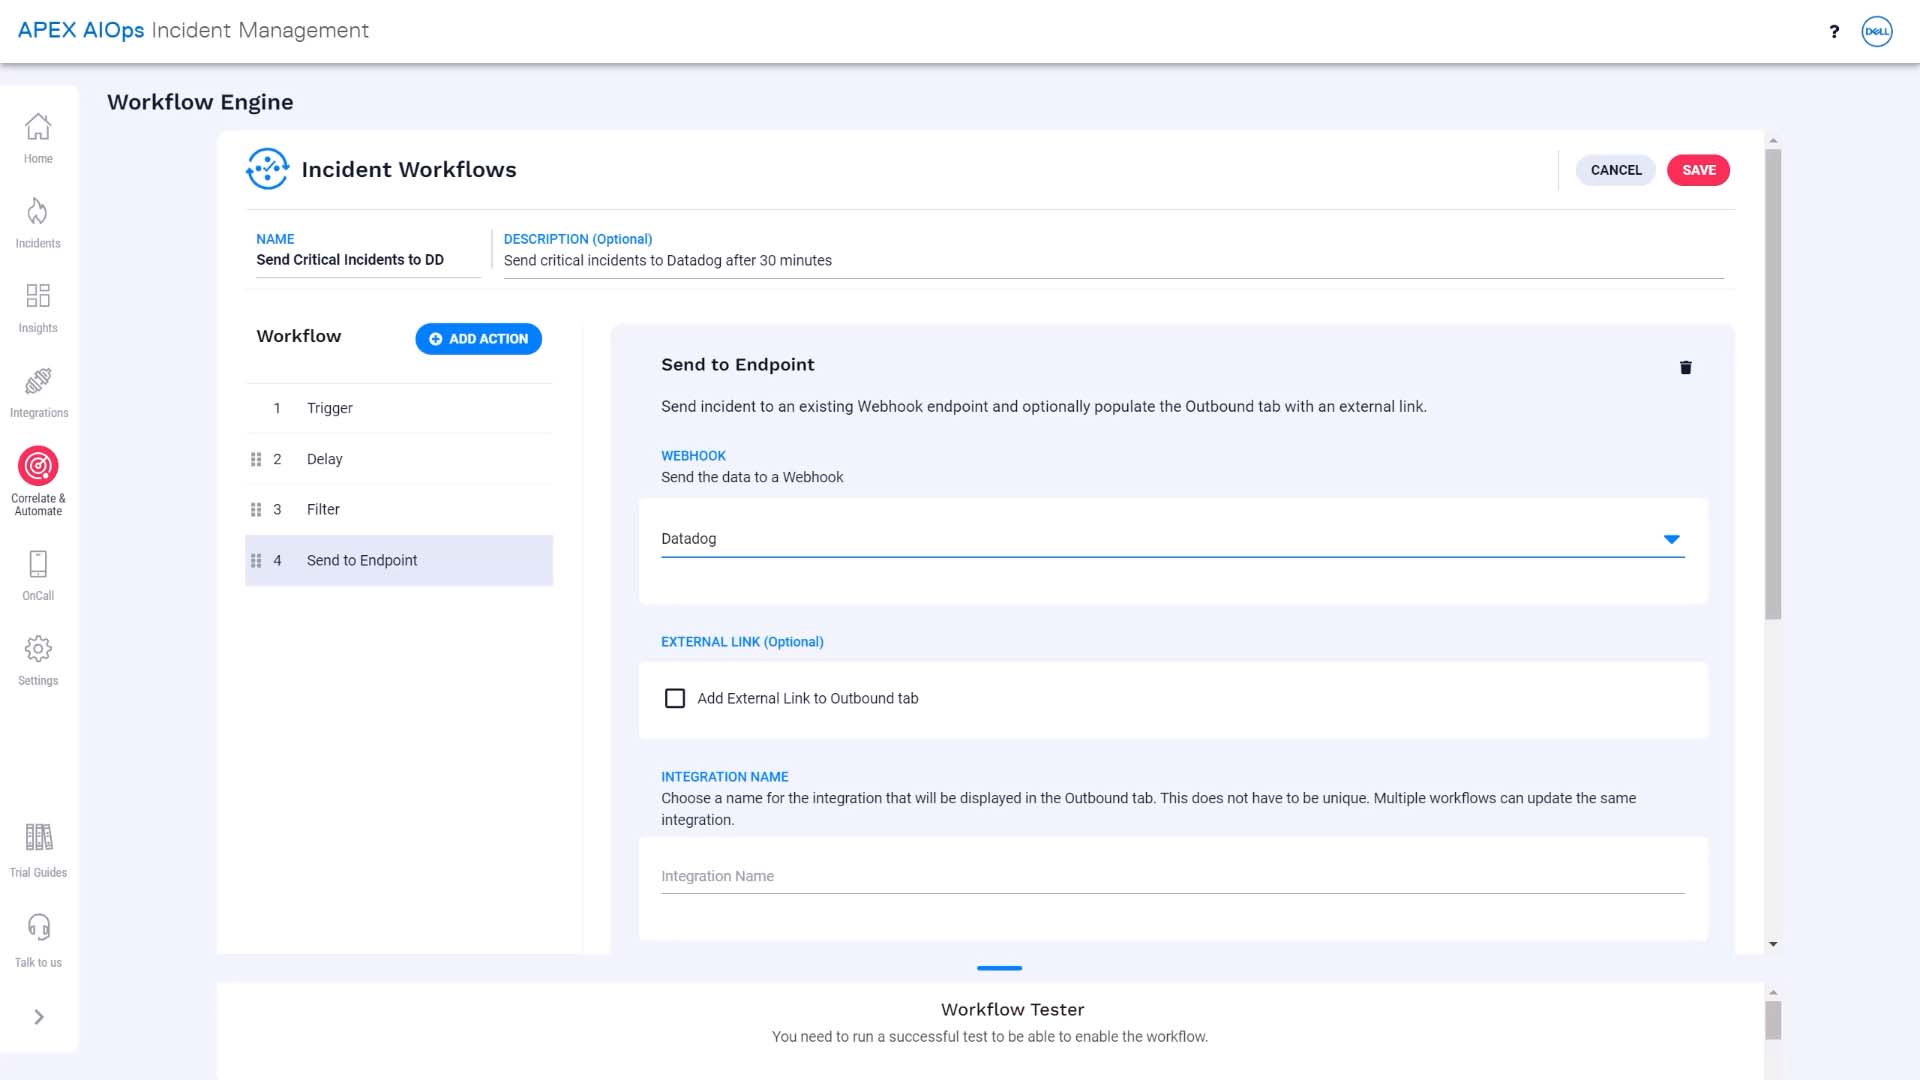
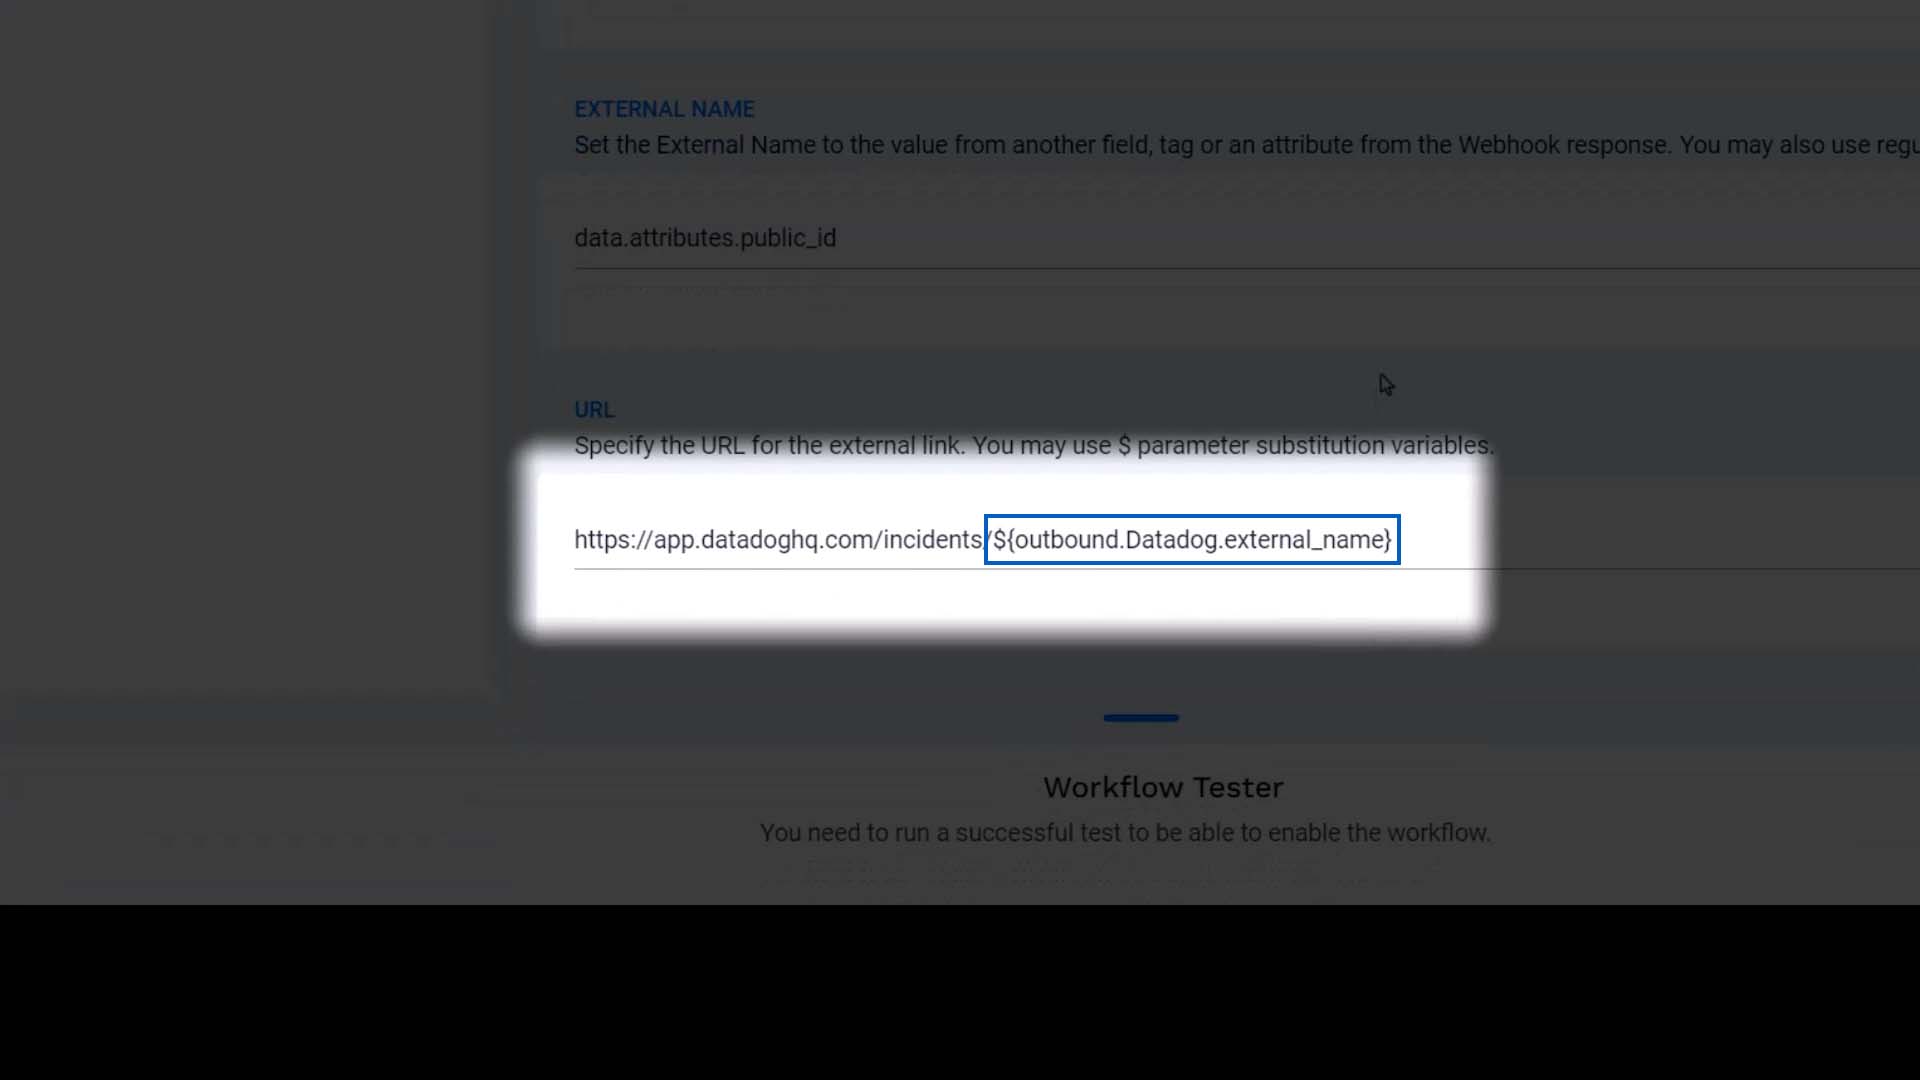
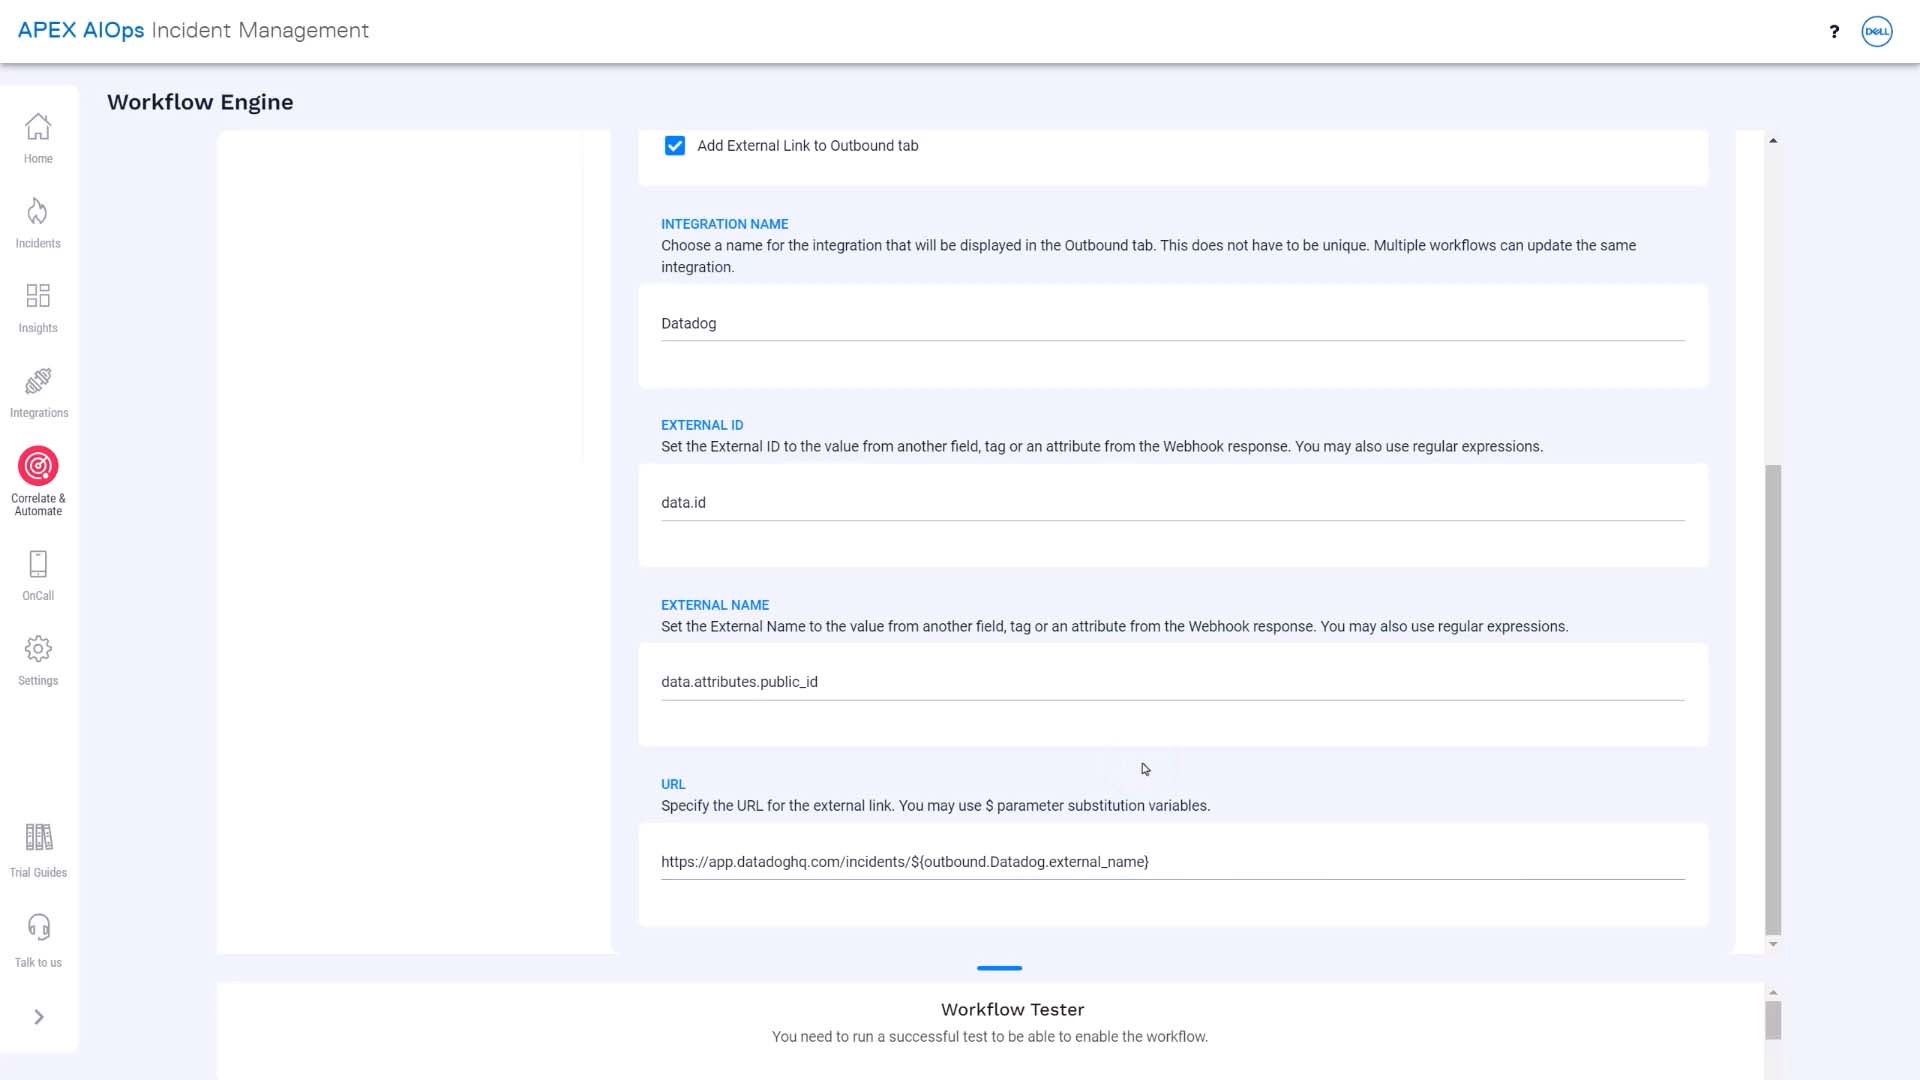
We’ll name the integration, and we’ll add the external name and ID, too. When an incident is forwarded to Datadog, Incident Management will parse Datadog’s response to get these values. Here is the URL that will link to the Datadog incident in Incident Management. It will show up under the Outbound tab for the incident.
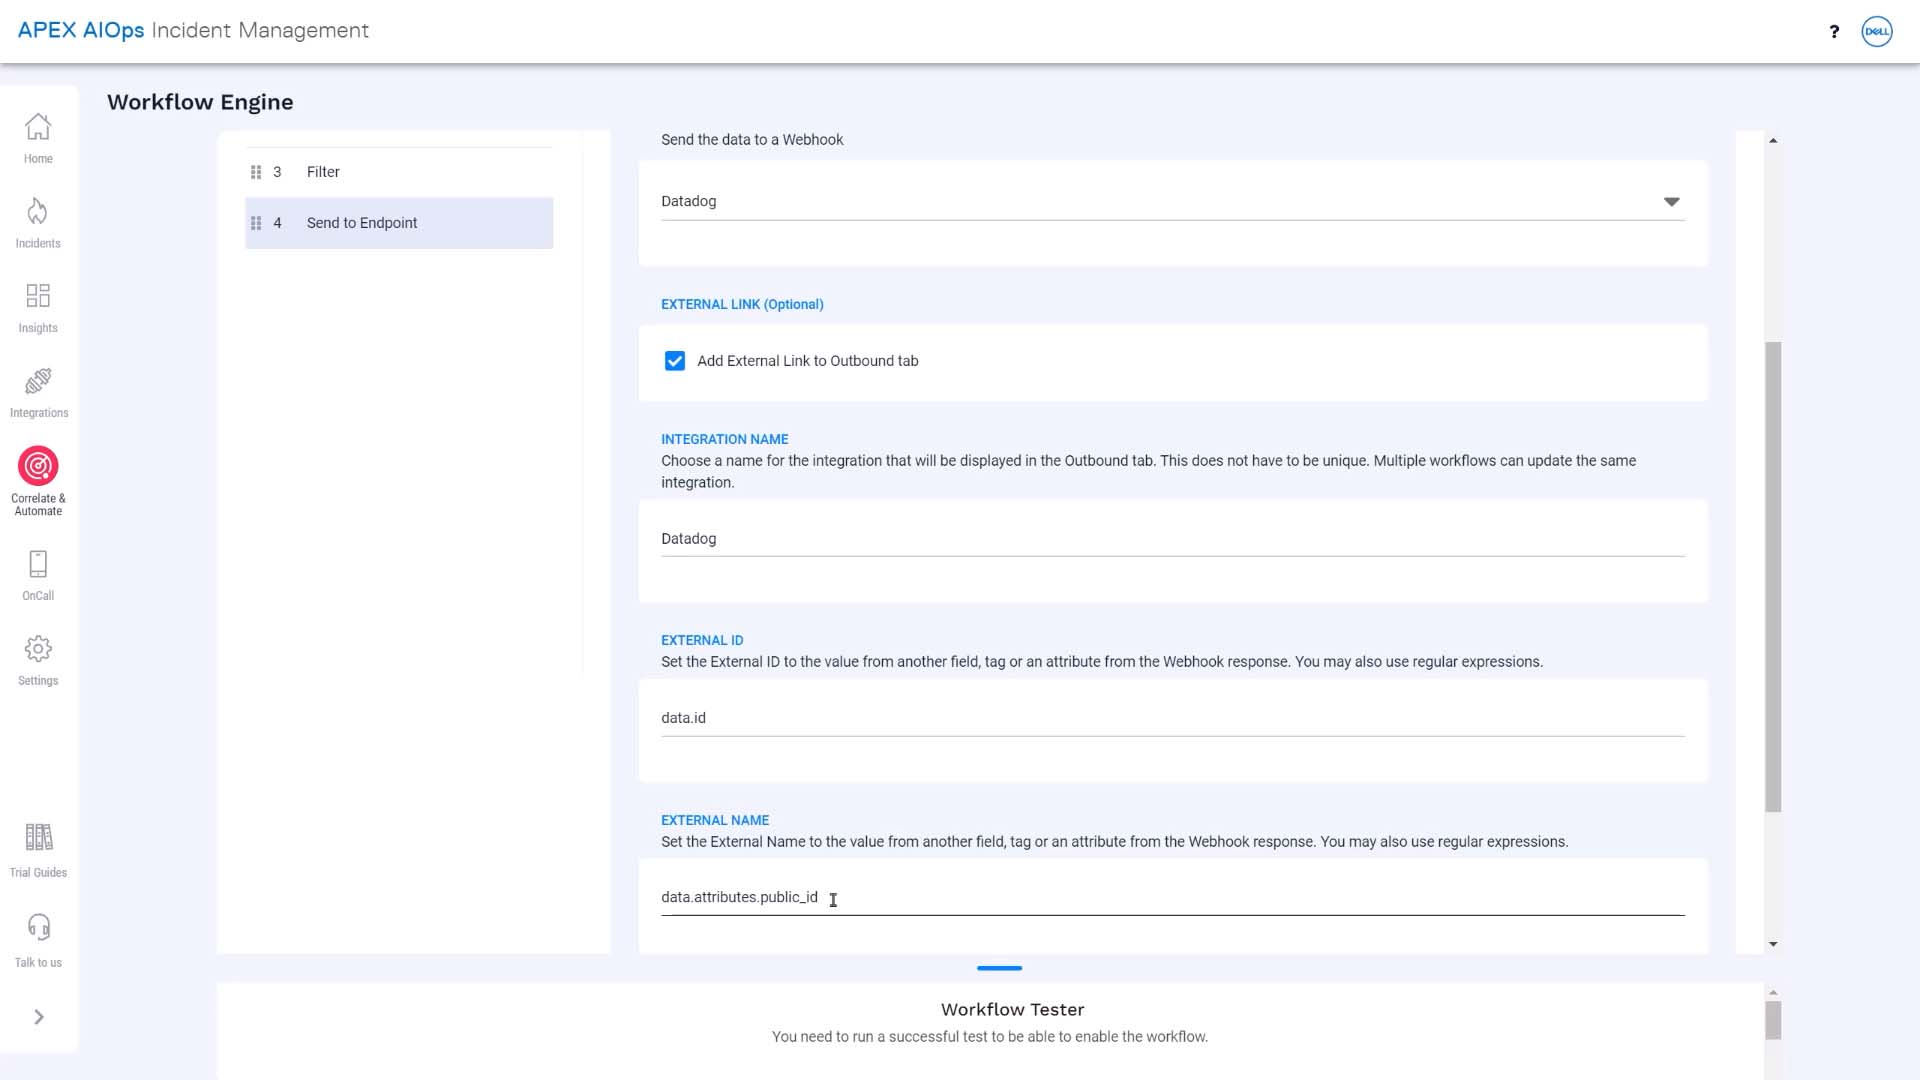
The dollar sign and curly brackets tell Incident Management we are referring to a Incident Management field–in this case, the external name we just defined.
Our workflow is all set! Let’s make sure it works. We could use the workflow tester, but we want to see the incident show up in Datadog, so let’s send a test incident.
Let’s take a closer look at how to send in a test incident. We can copy a curl command with a sample event from here…
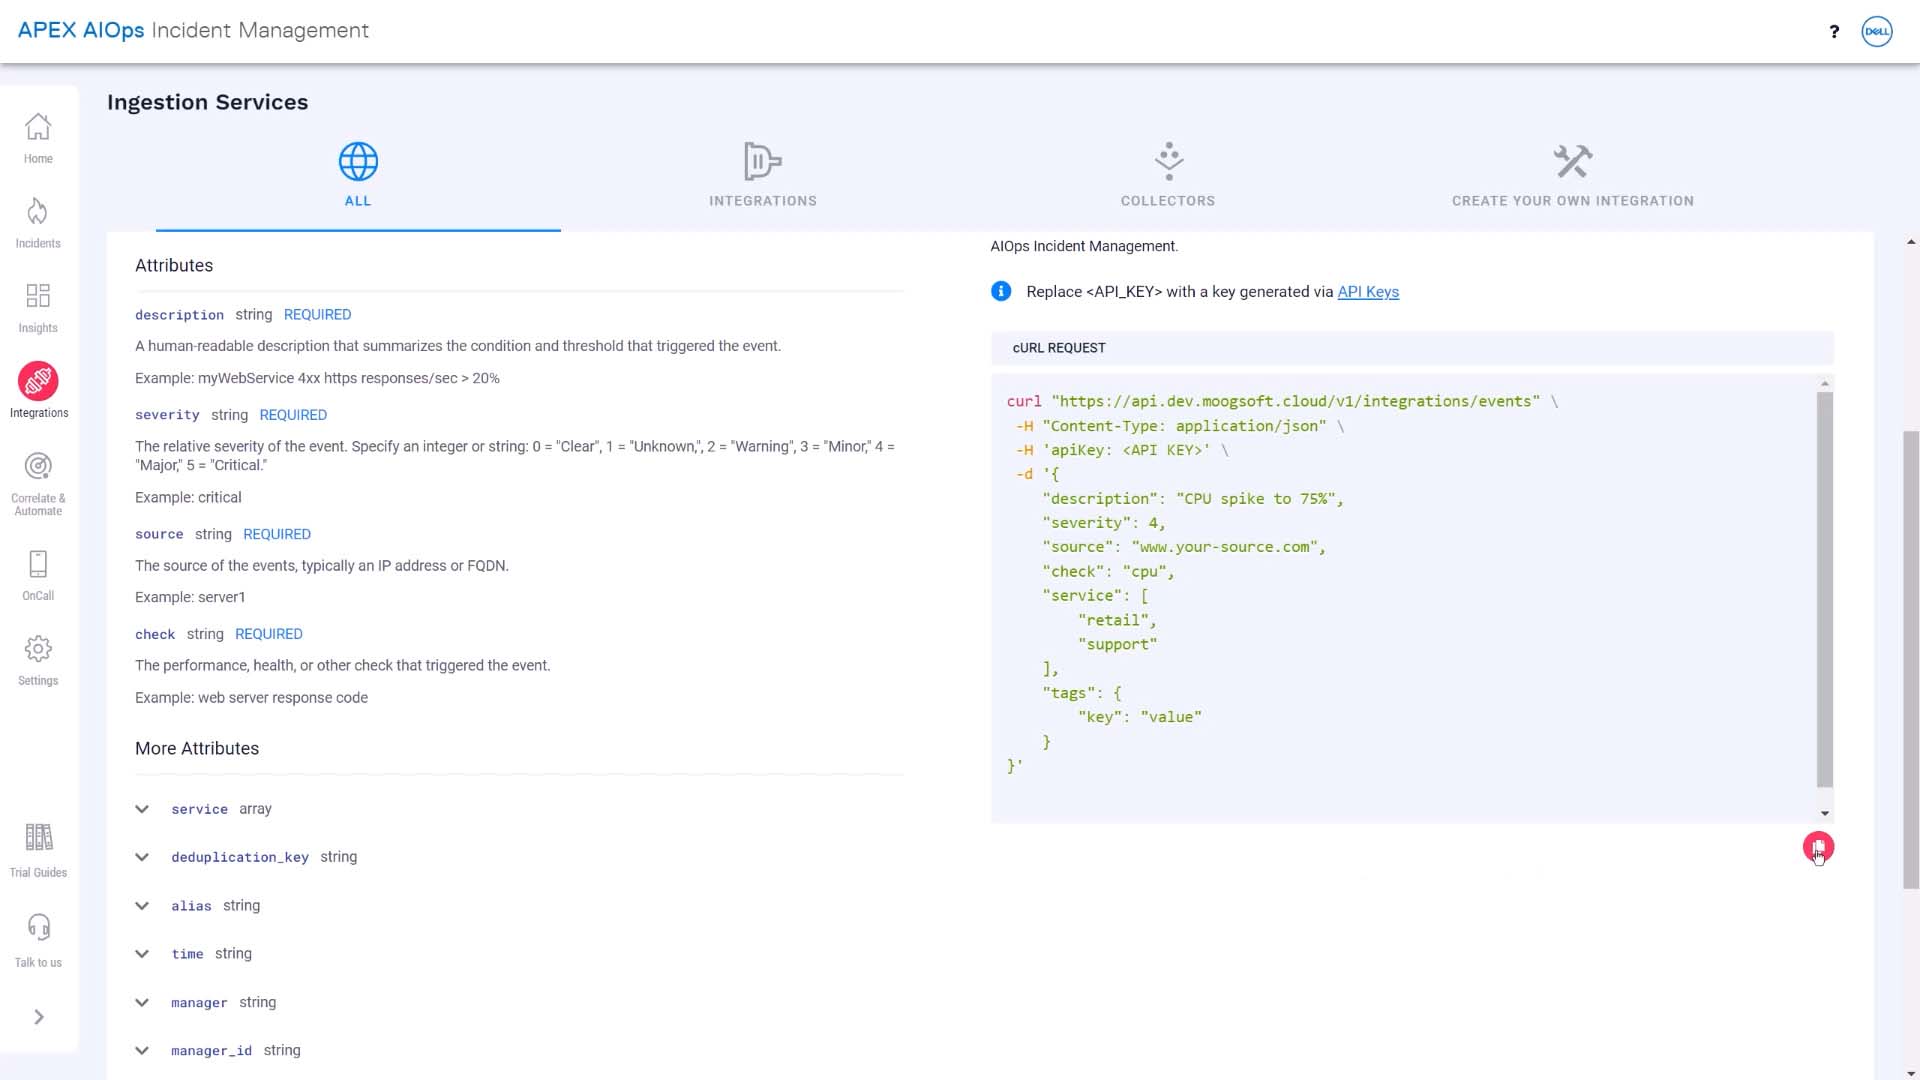
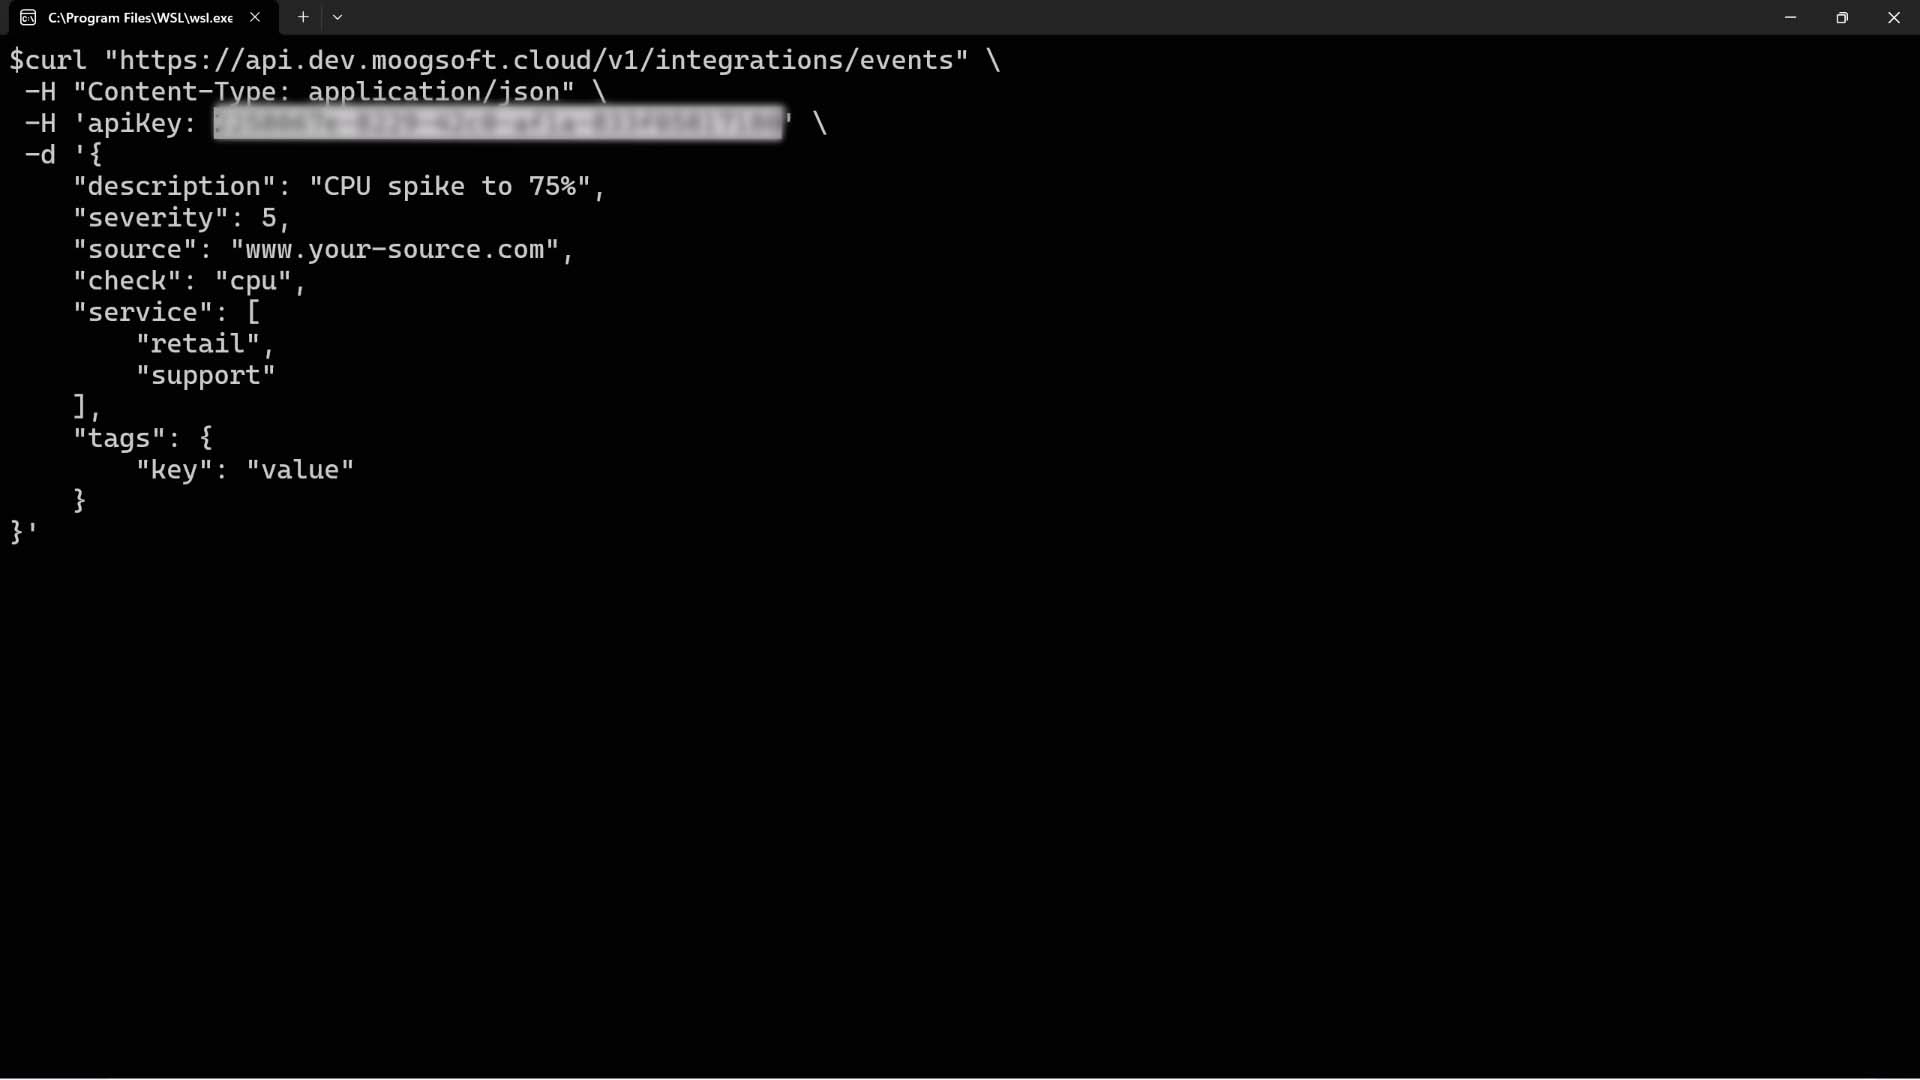
…paste it in a terminal… change the numeric severity to the critical value…and send it to Incident Management. Success!
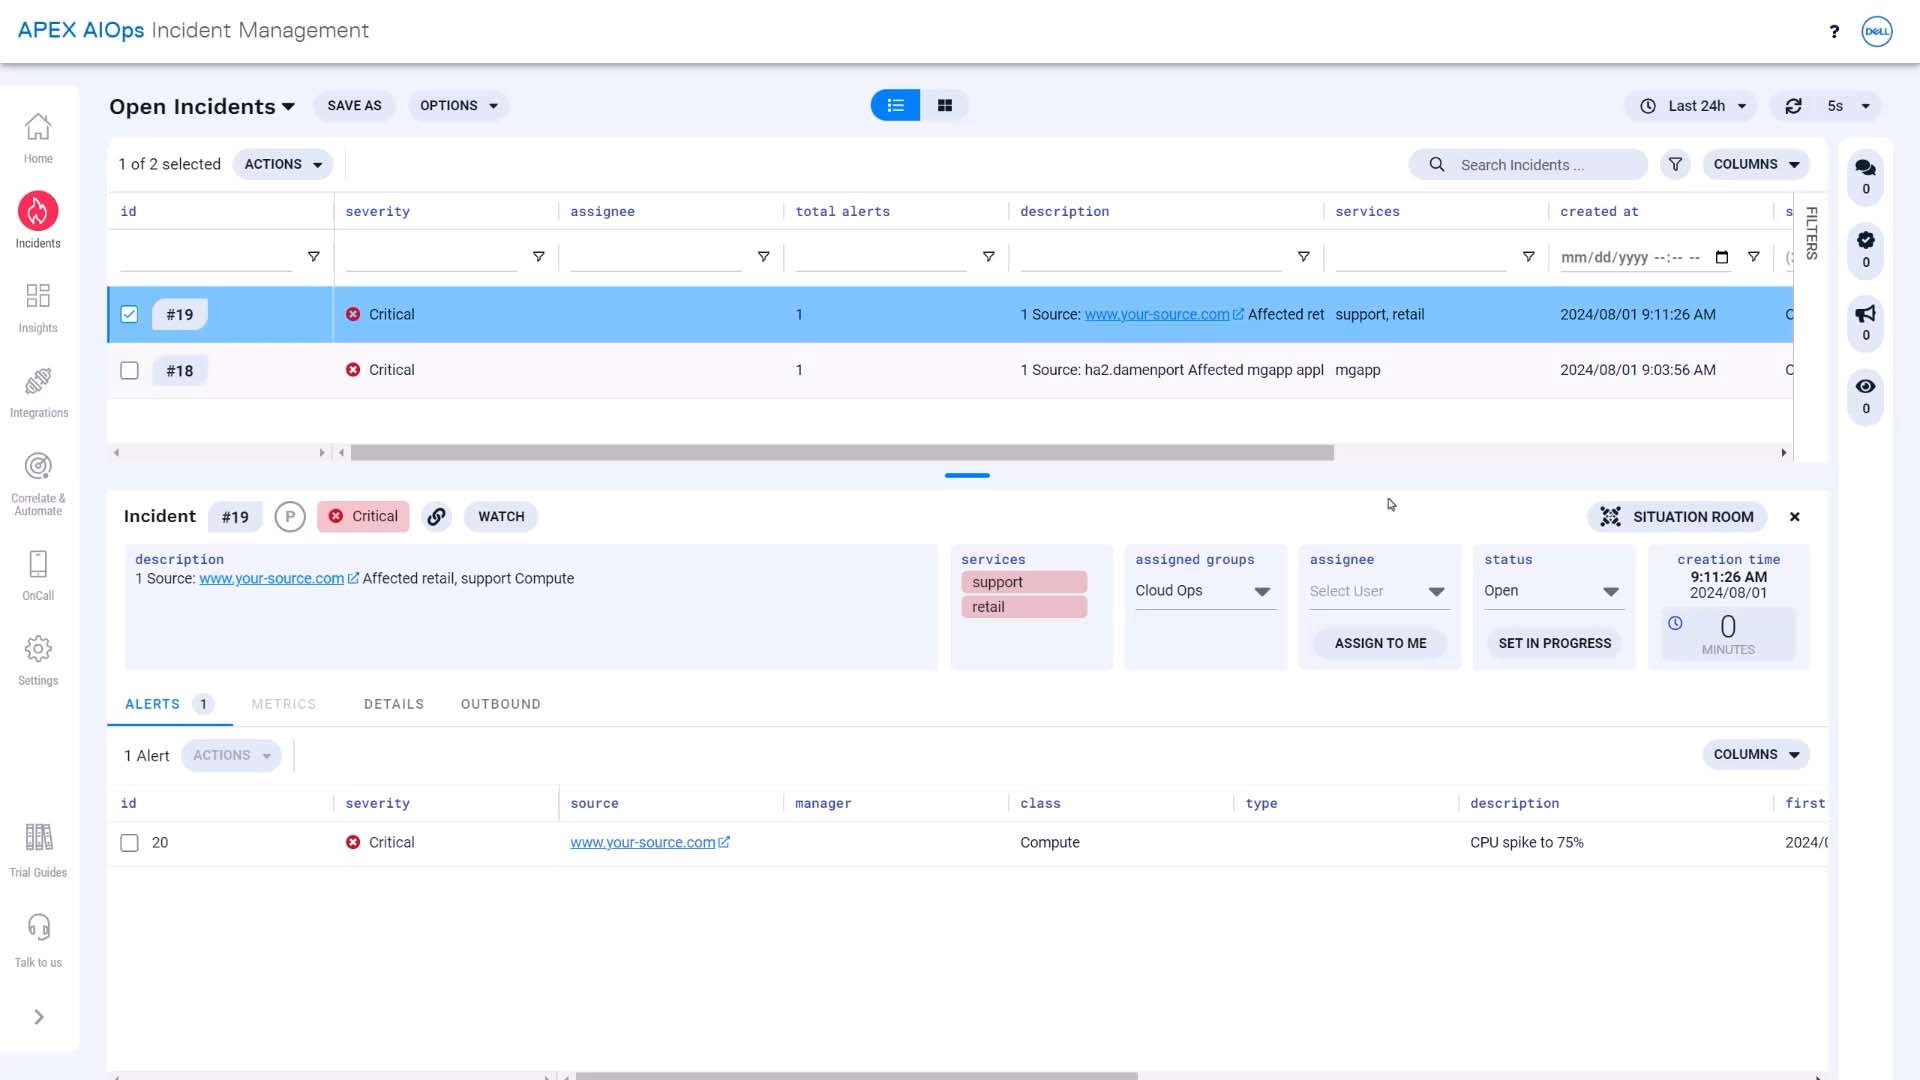
Here is the resulting incident in Incident Management.
We’ve waited… and the event was sent to Datadog. Here it is in Incident Management with the Datadog link.
And here it is in Datadog.
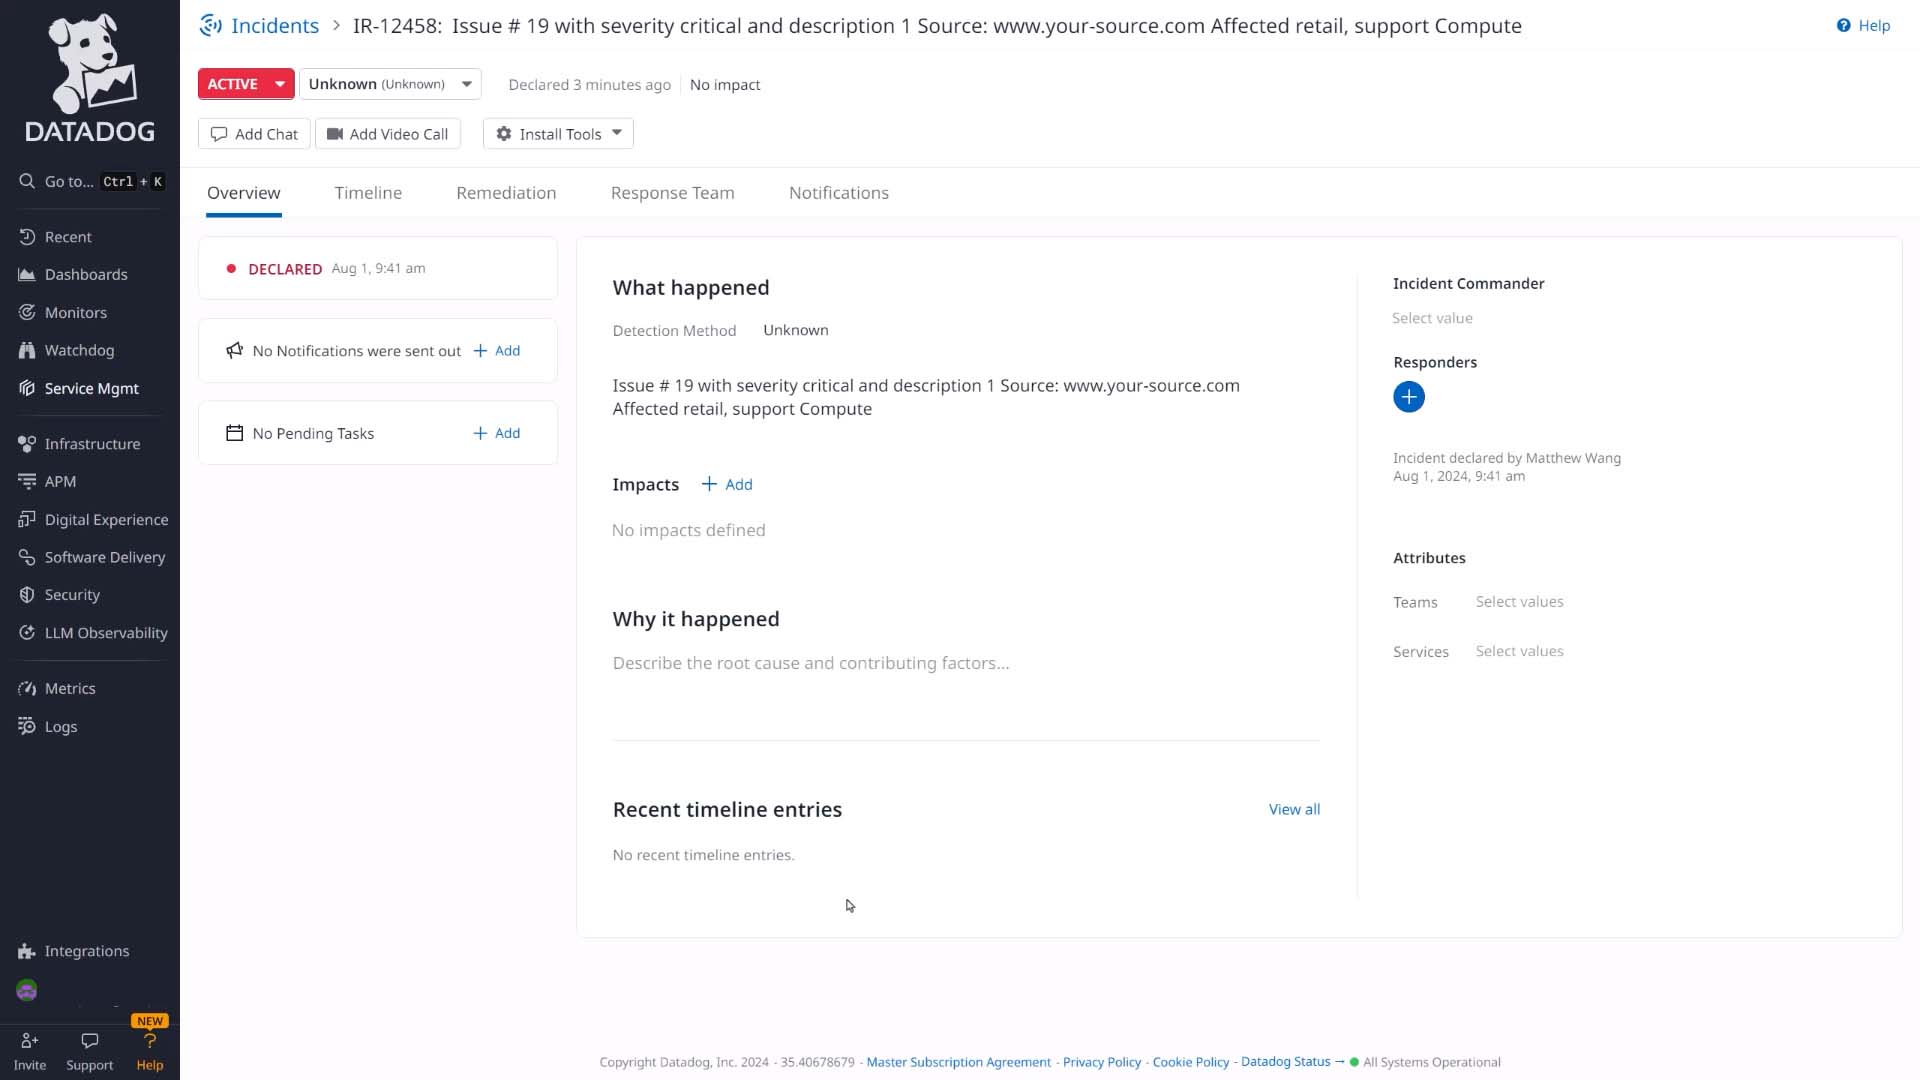
Let’s close this incident and run the test again. We’ll send another critical event. Here’s the new incident.
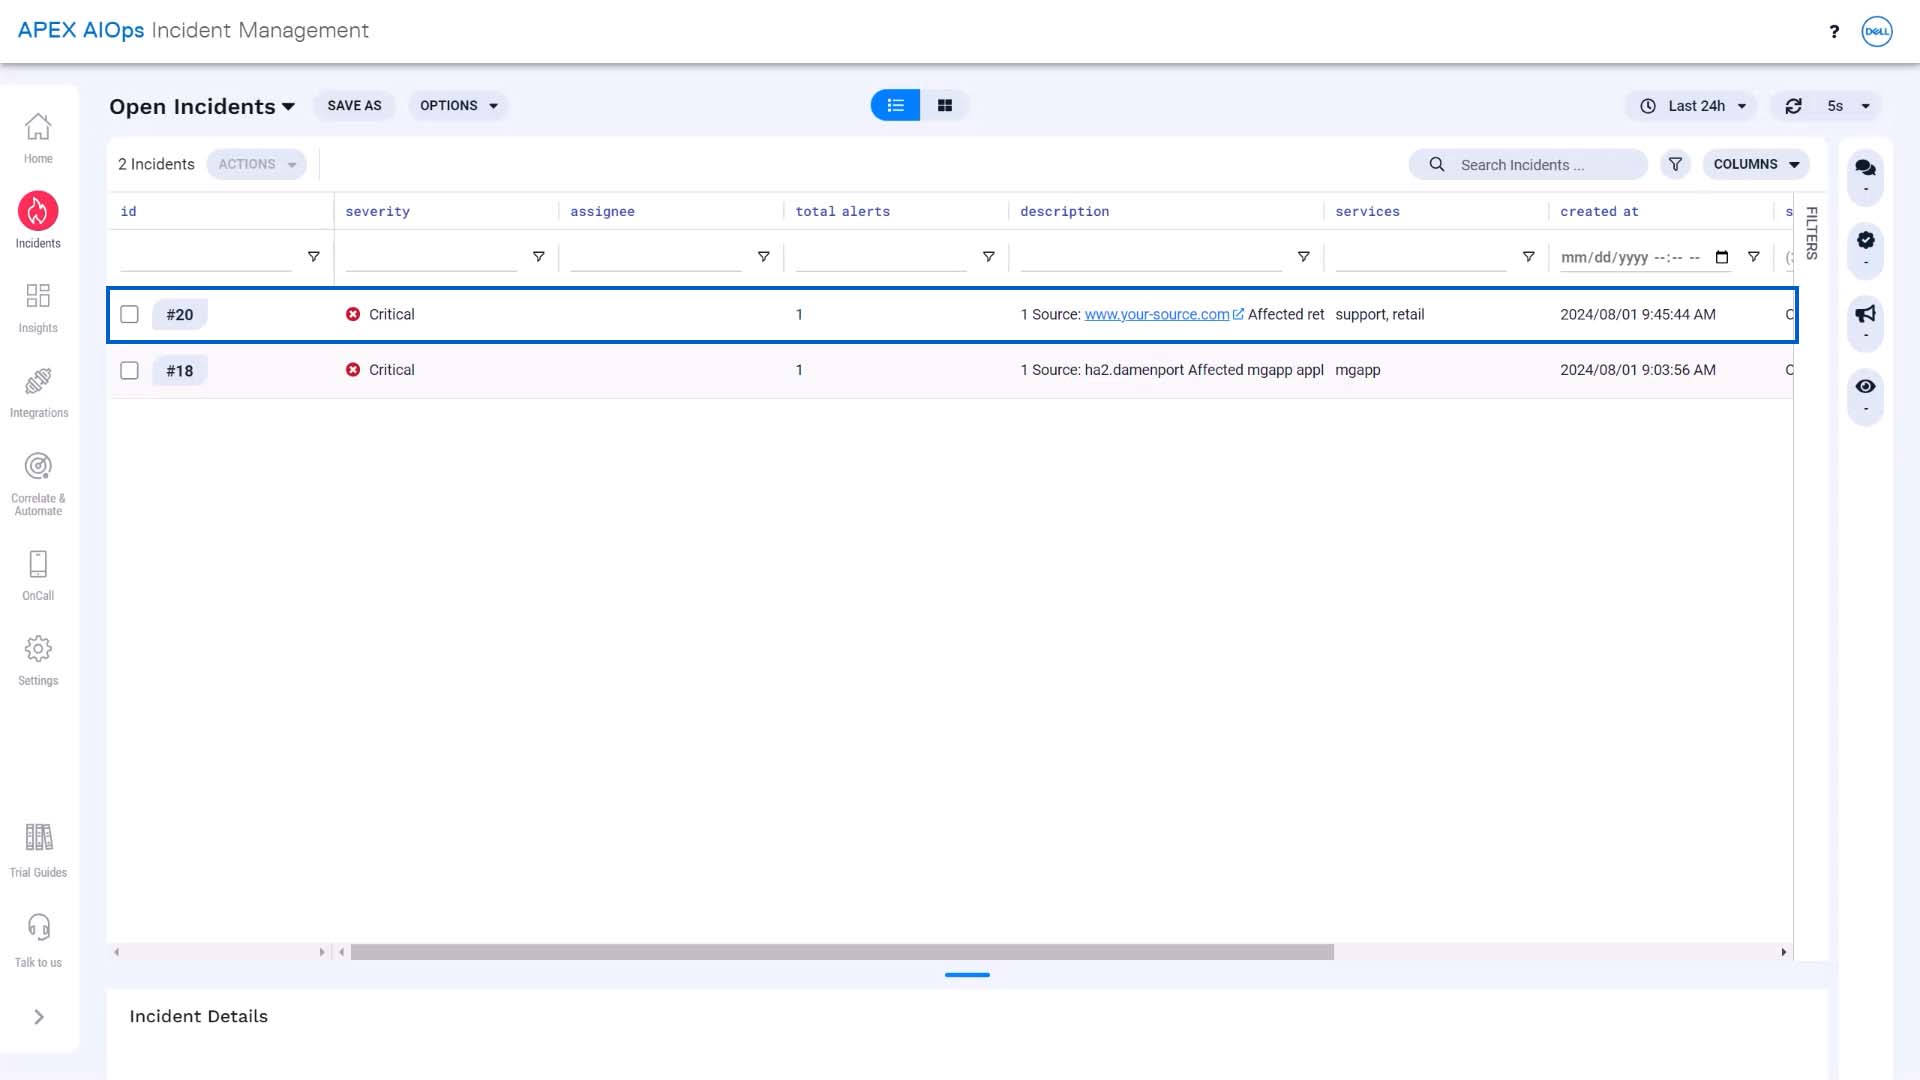
And now we’ll resend the event, but with a severity of 0, which is clear. Since nothing changed but the severity, Incident Management will deduplicate this event into the same alert.
And the alert change updates the incident… here’s the incident with clear severity.
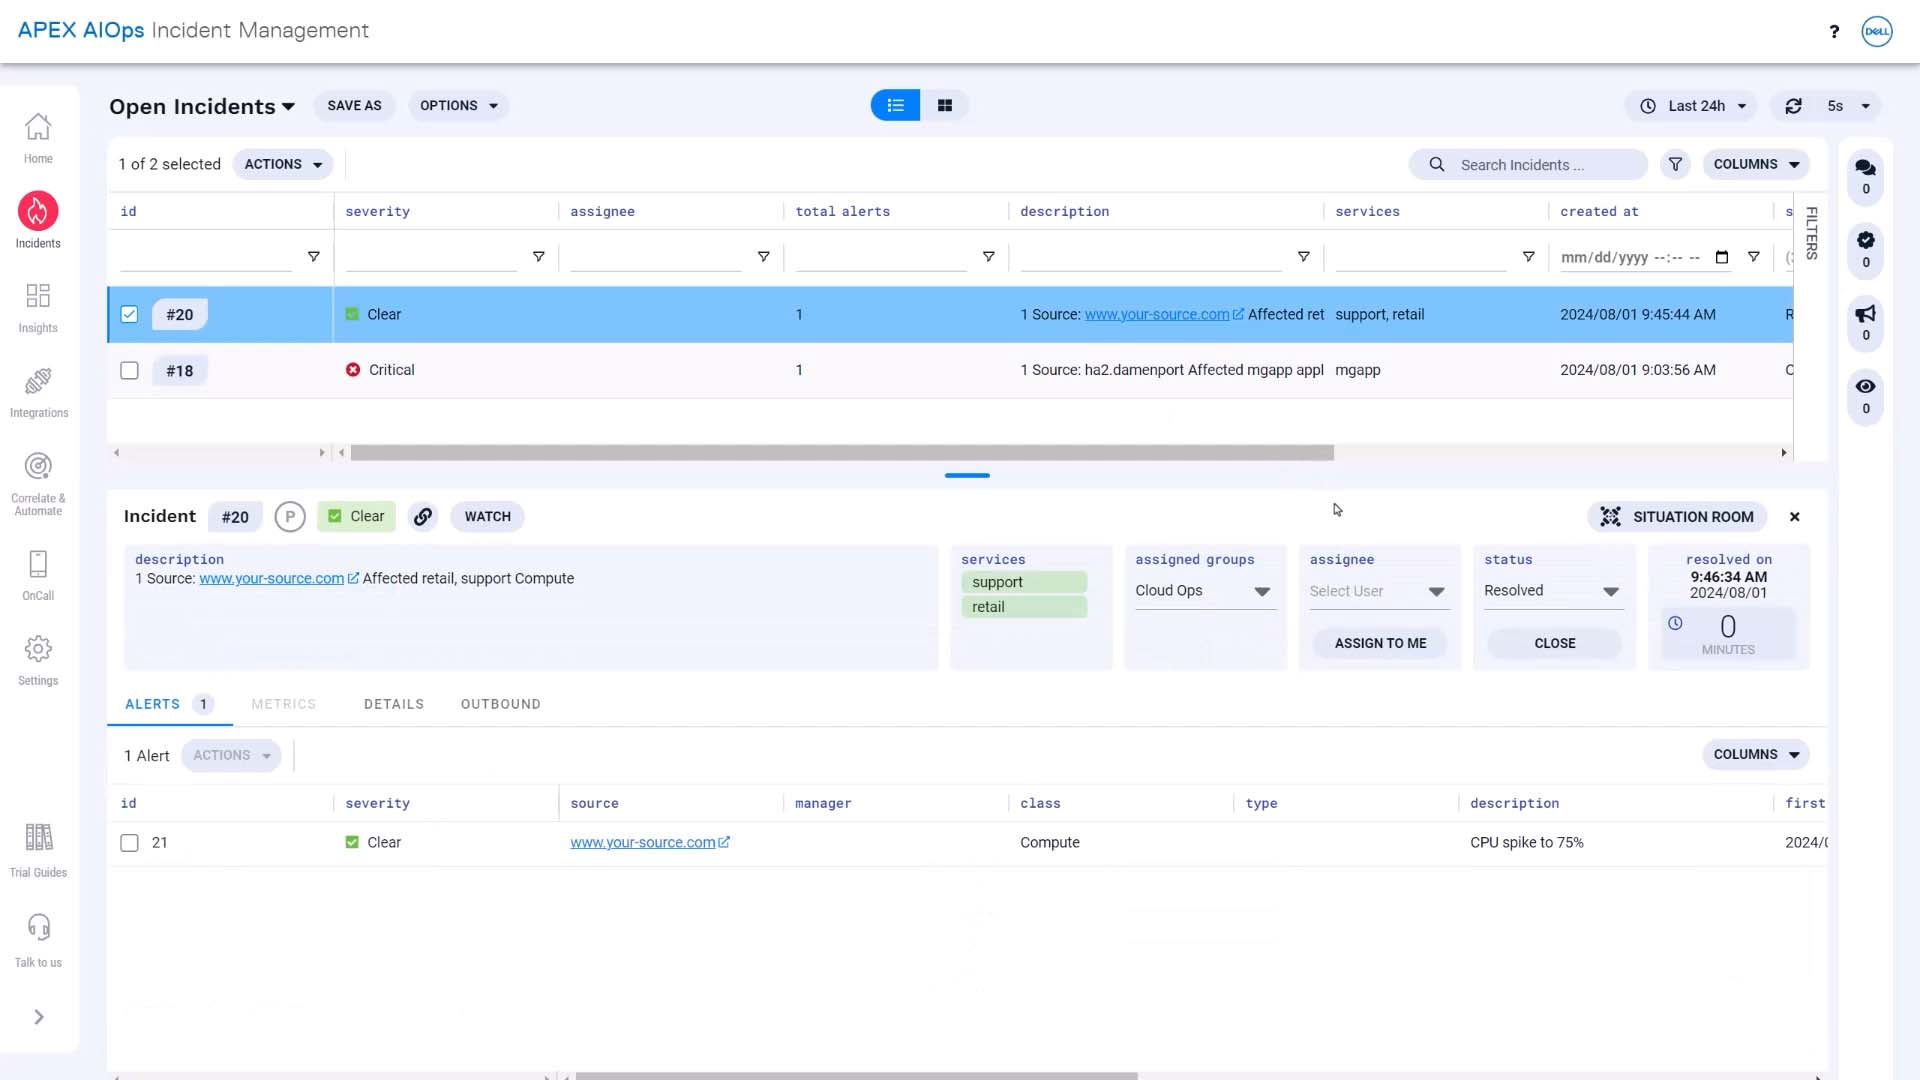
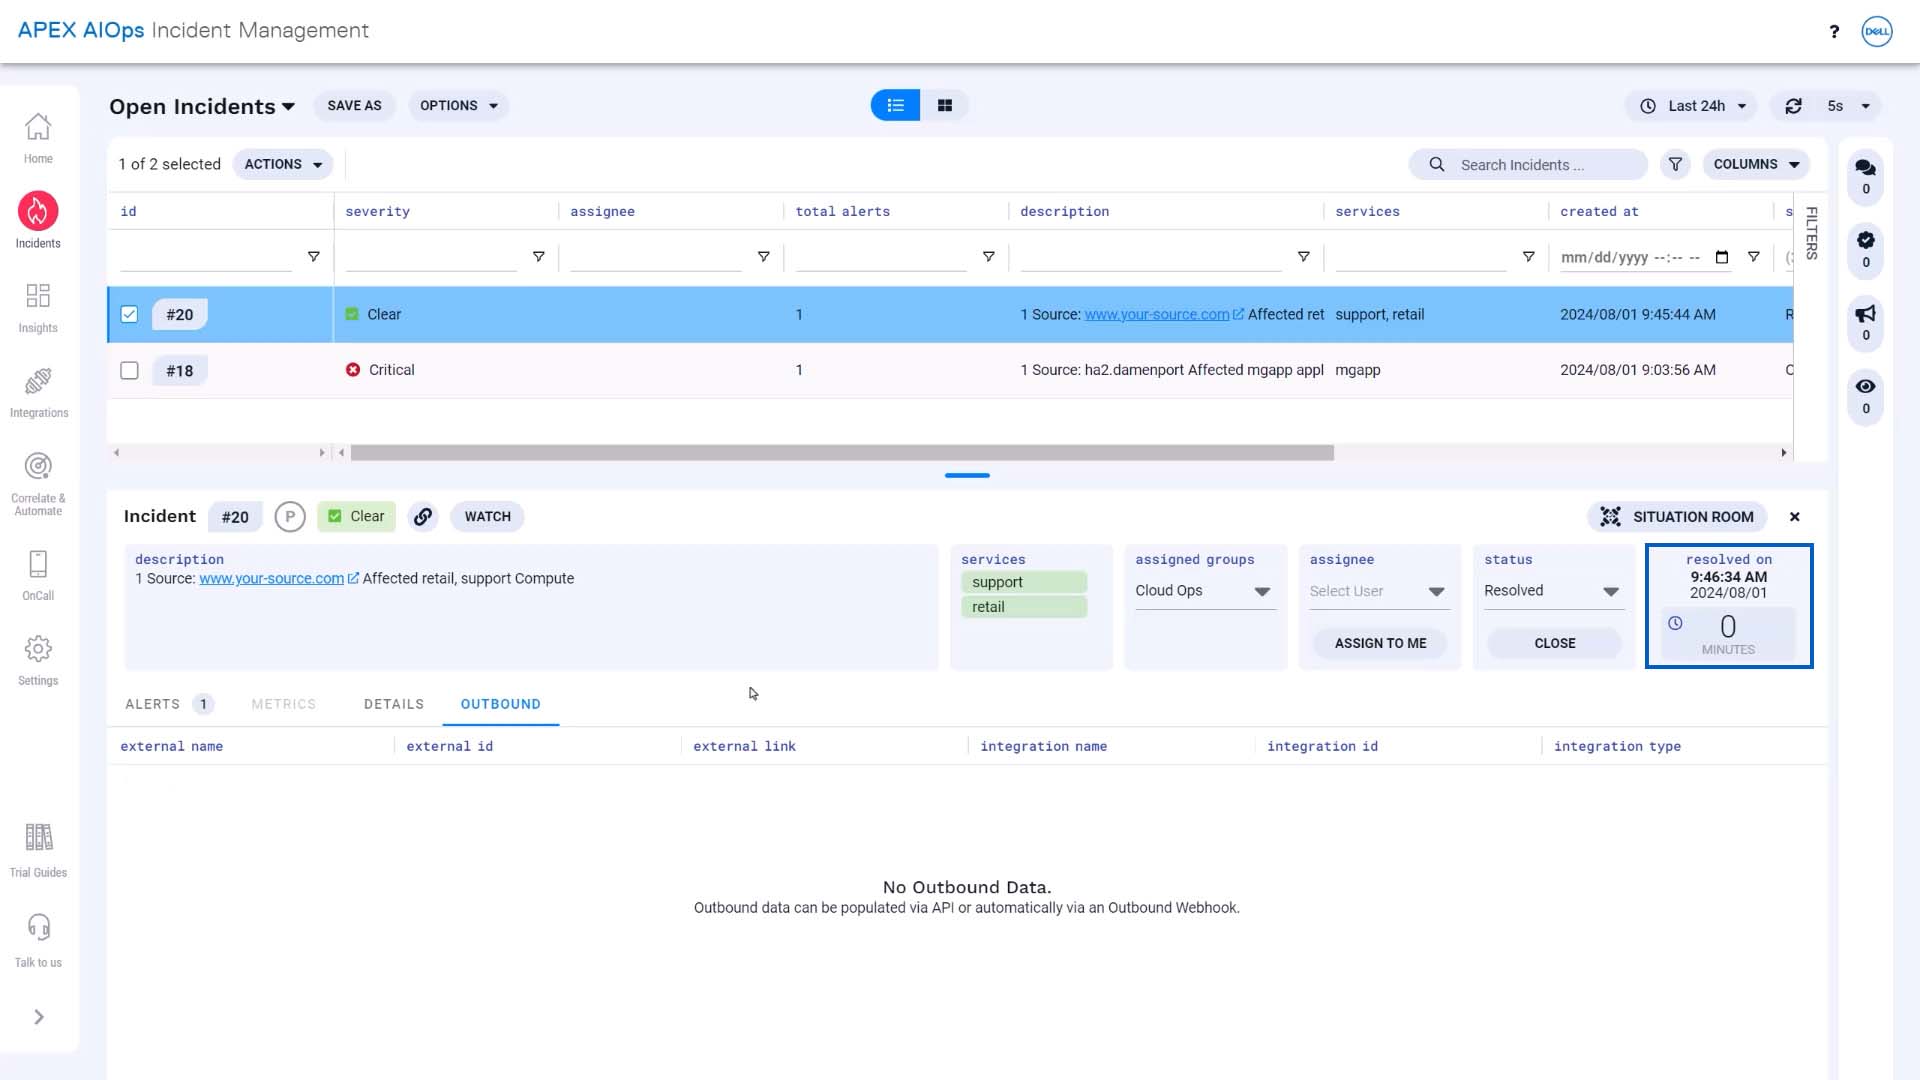
We’ve waited 30 minutes… and there is still no outbound information. The Incident Management incident was never forwarded to Datadog, because it cleared during the programmed delay.
We can see that it resolved in less than a minute. Our workflow is behaving just as we wanted.
Now you know how to create incident workflows. Thanks for watching!
BASIC | 2 MIN
Moogsoft automatically closes old alerts and incidents behind the scenes. In this video, learn the default behavior for Auto Close and where you can change the default settings.
Documentation on this topic is available.
Concept explainer: Auto-close in APEX AIOps Incident Management ►
This video explains how the auto-close feature works in APEX AIOps Incident Management.
*Please note Moogsoft is now part of Dell's IT Operations solution called APEX AIOps, and changed its name to APEX AIOps Incident Management. The UI in this video may differ slightly but the content covered is still relevant.
Incident Management lists all open alerts and incidents, but let’s face it… you won’t investigate some of the alerts and incidents
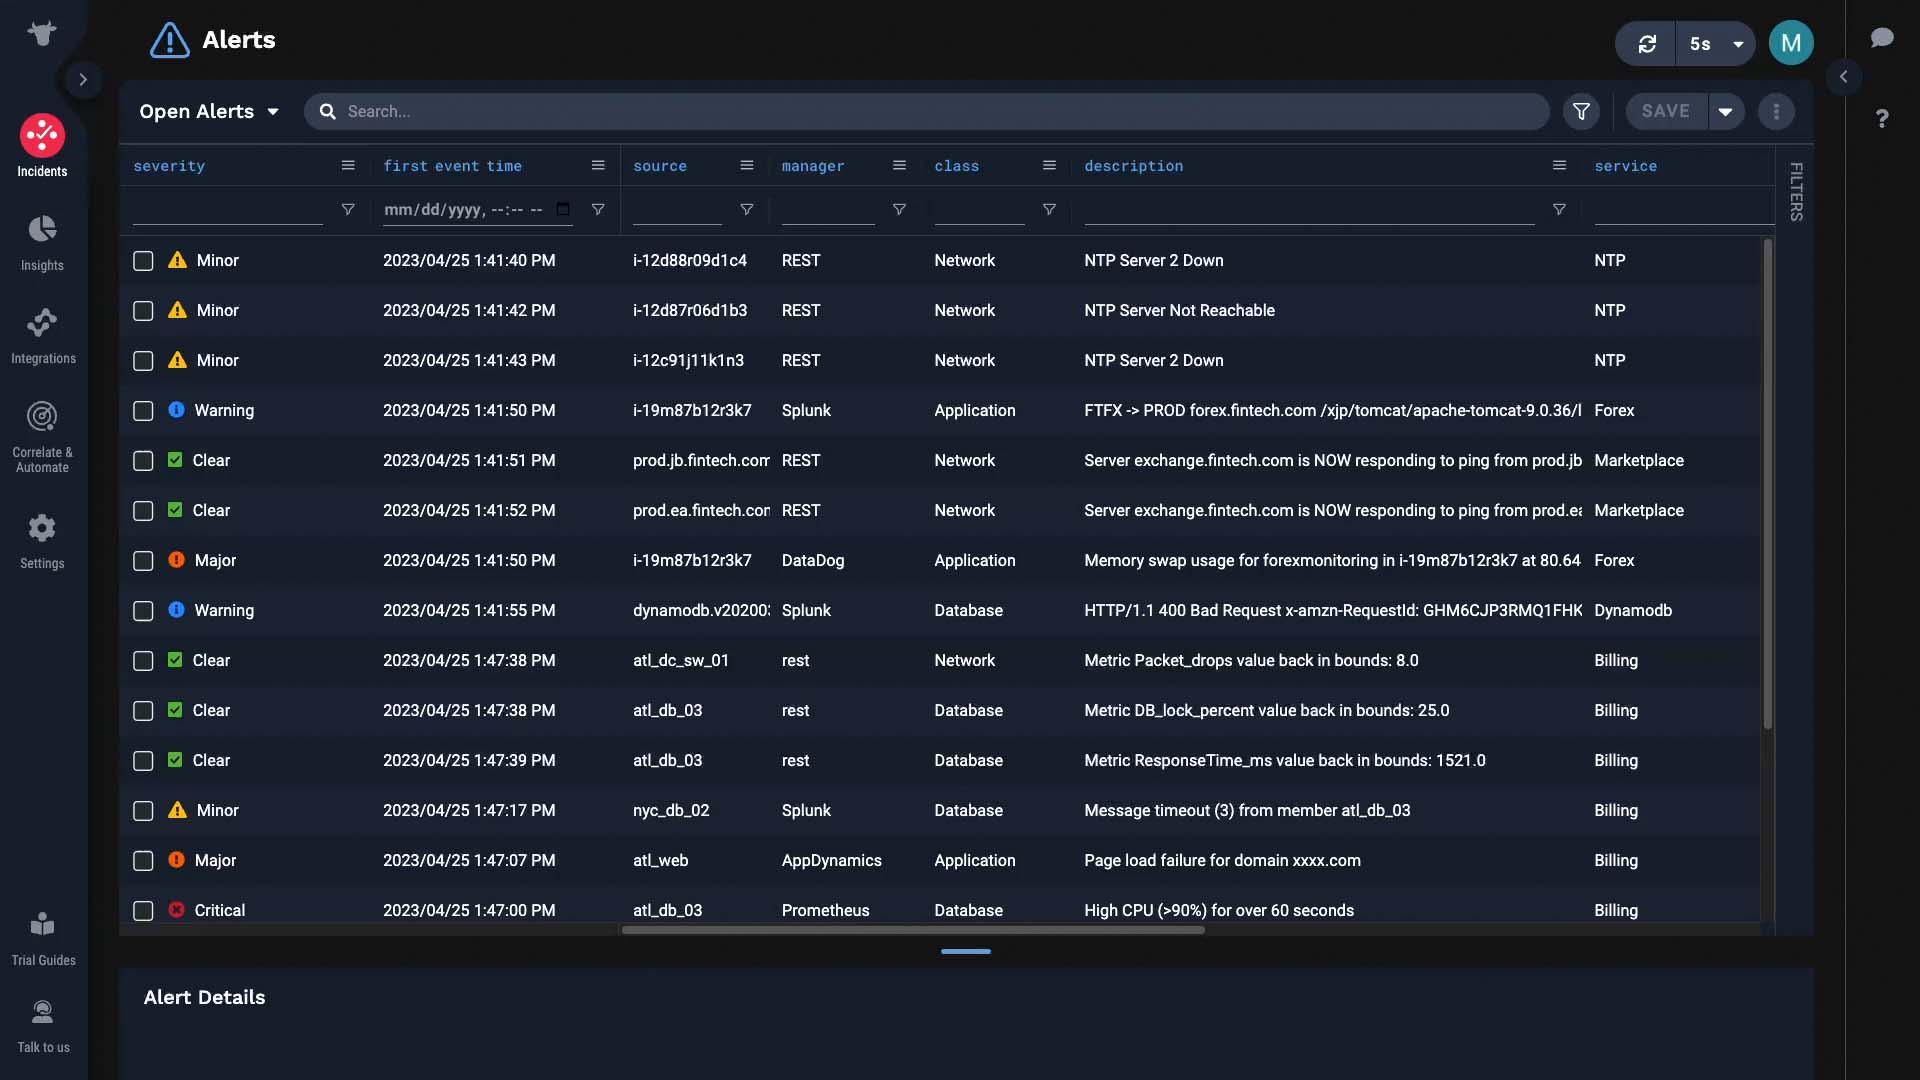
They did not lead to a major issue, or they are simply too old and you should rather be focusing on what’s impacting your world NOW.
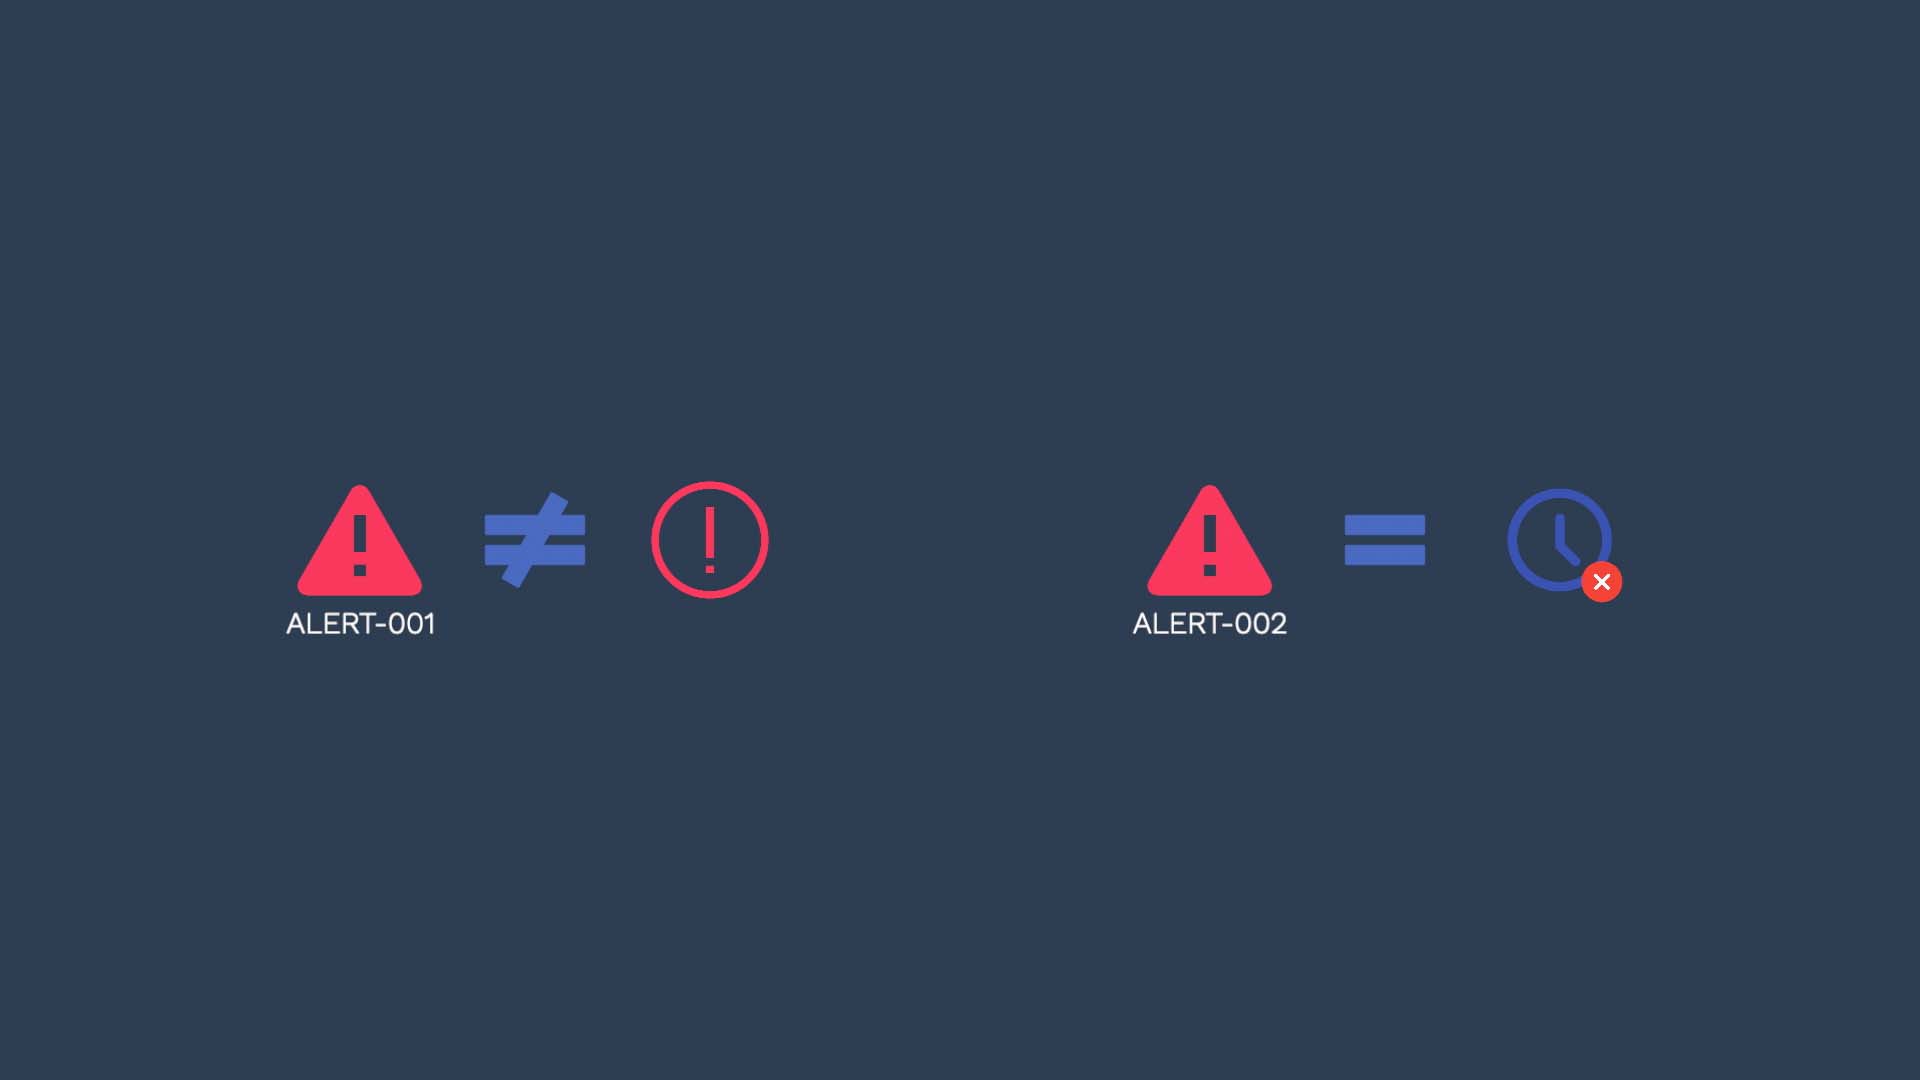
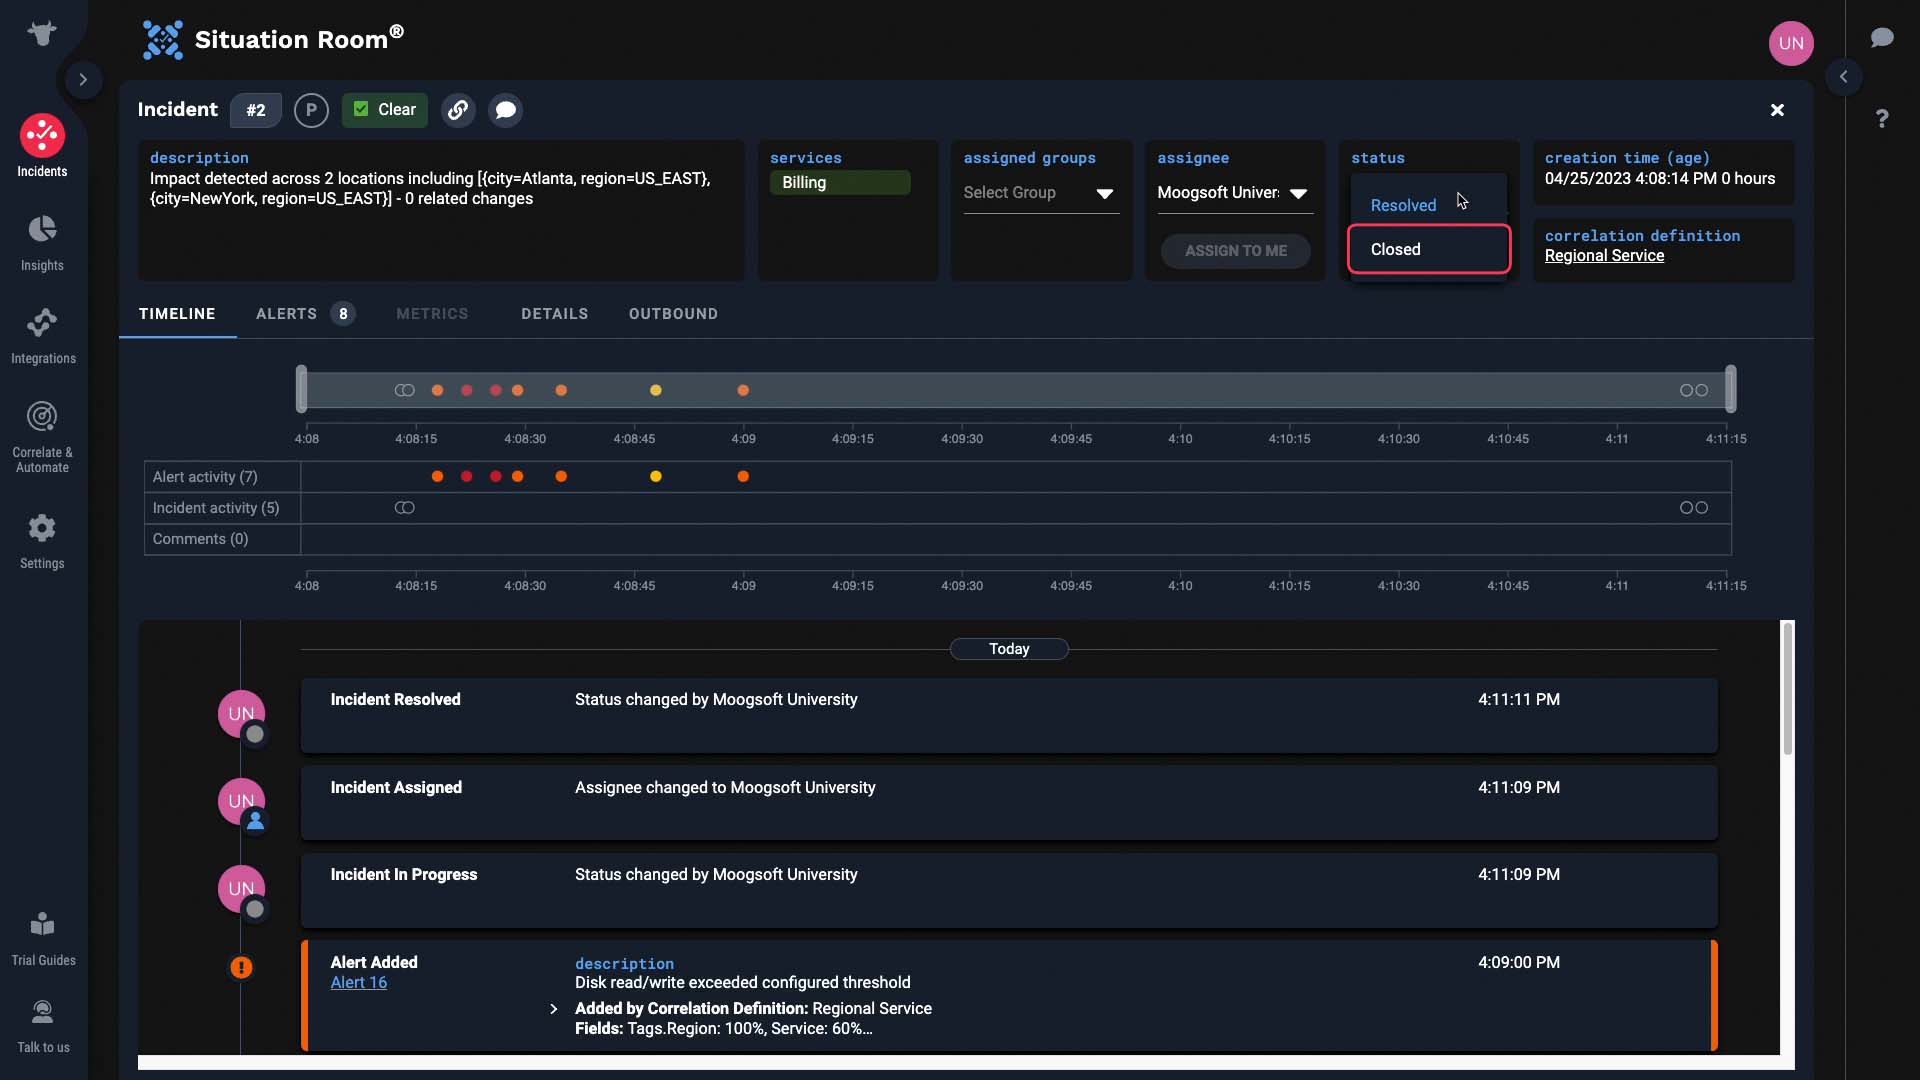
Or, maybe you resolved an issue but just forgot to change the incident status to “closed”.
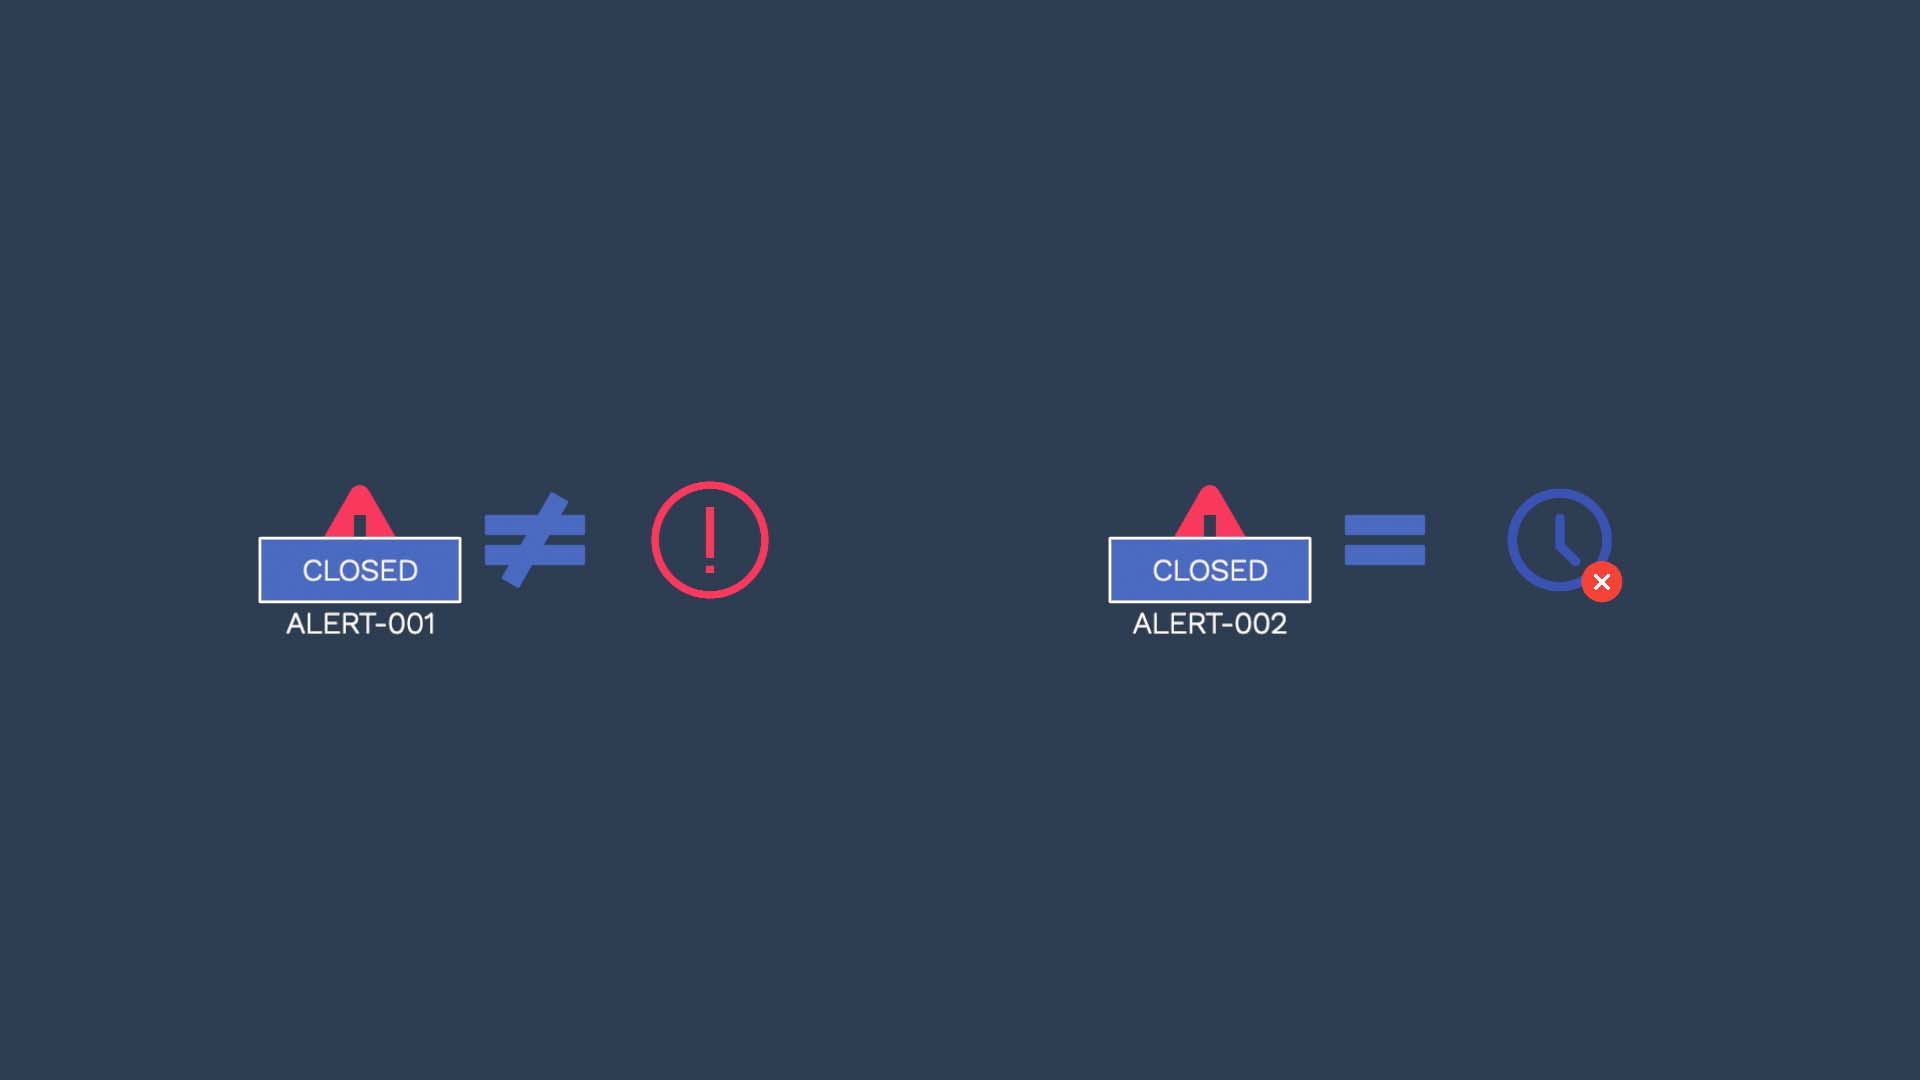
To avoid more current and important issues from getting buried under older ones, Incident Management automatically closes the old alerts and incidents behind the scenes.
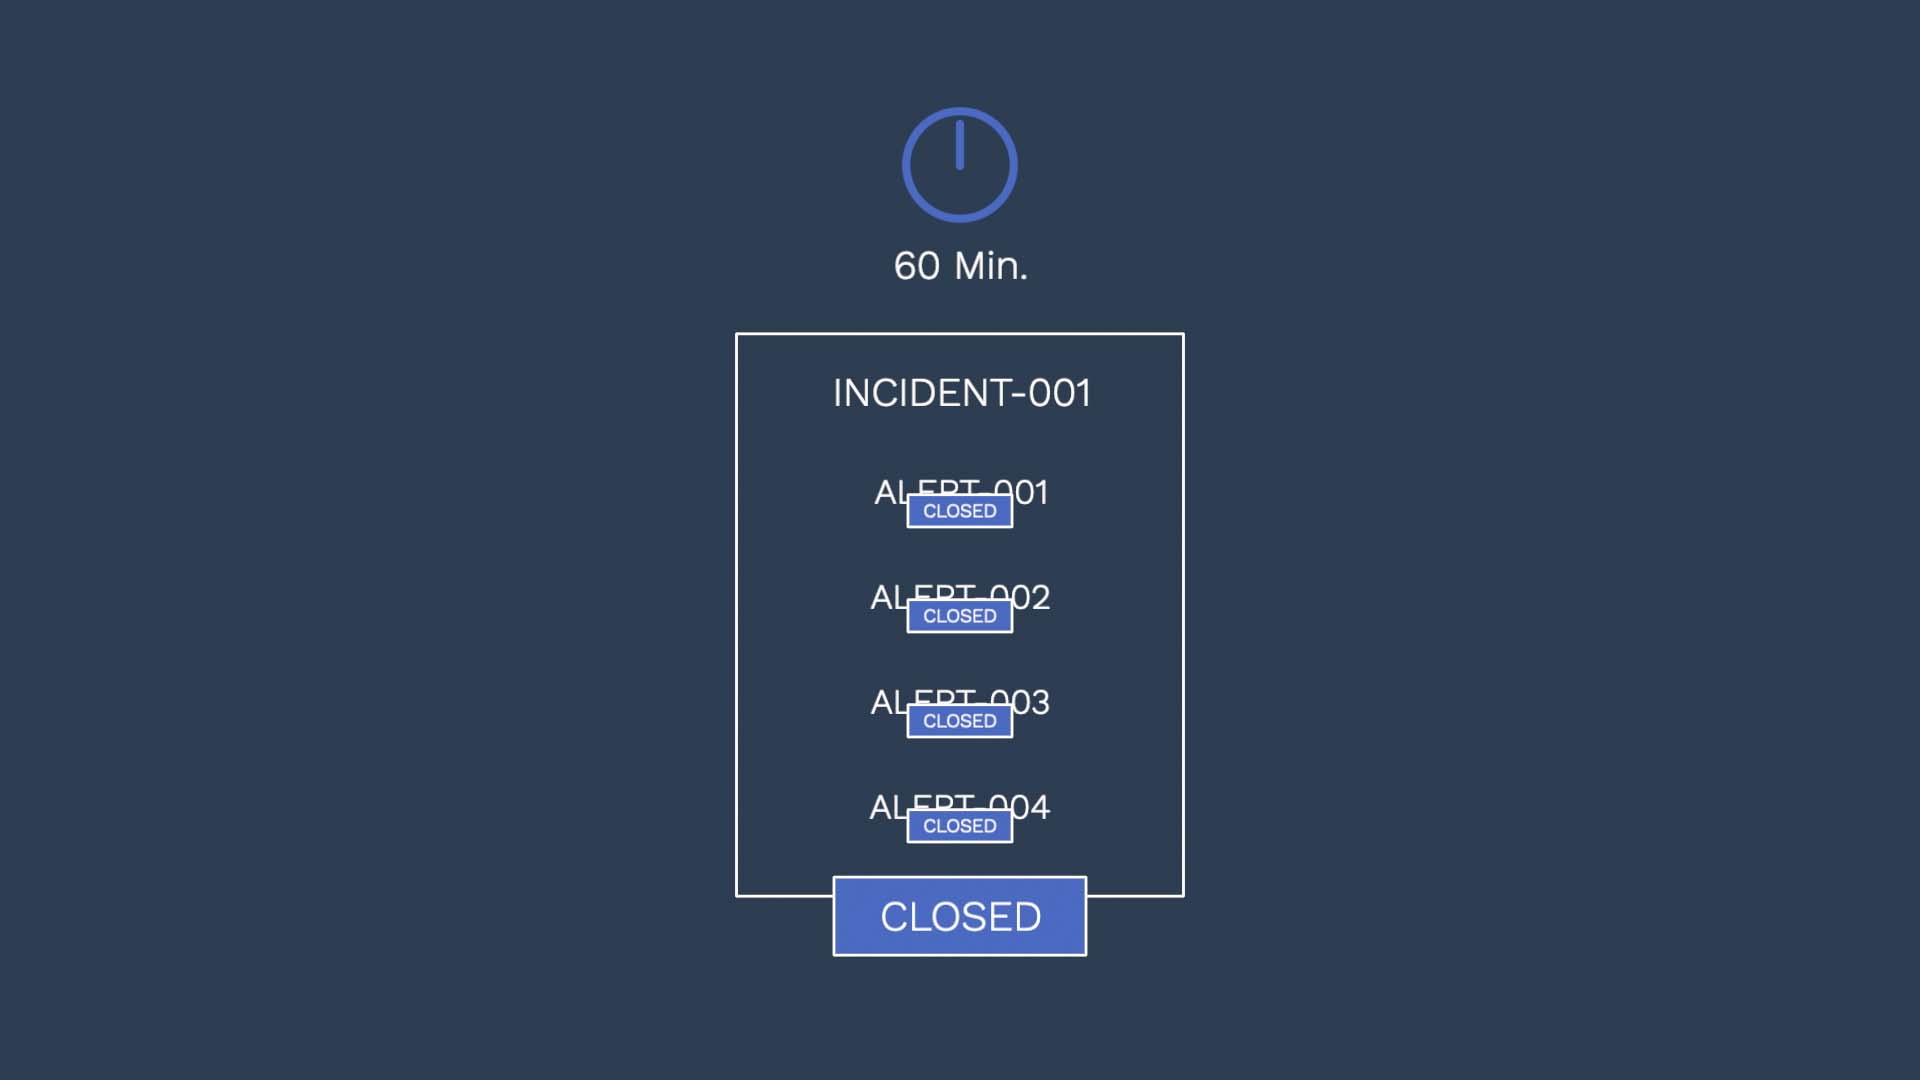
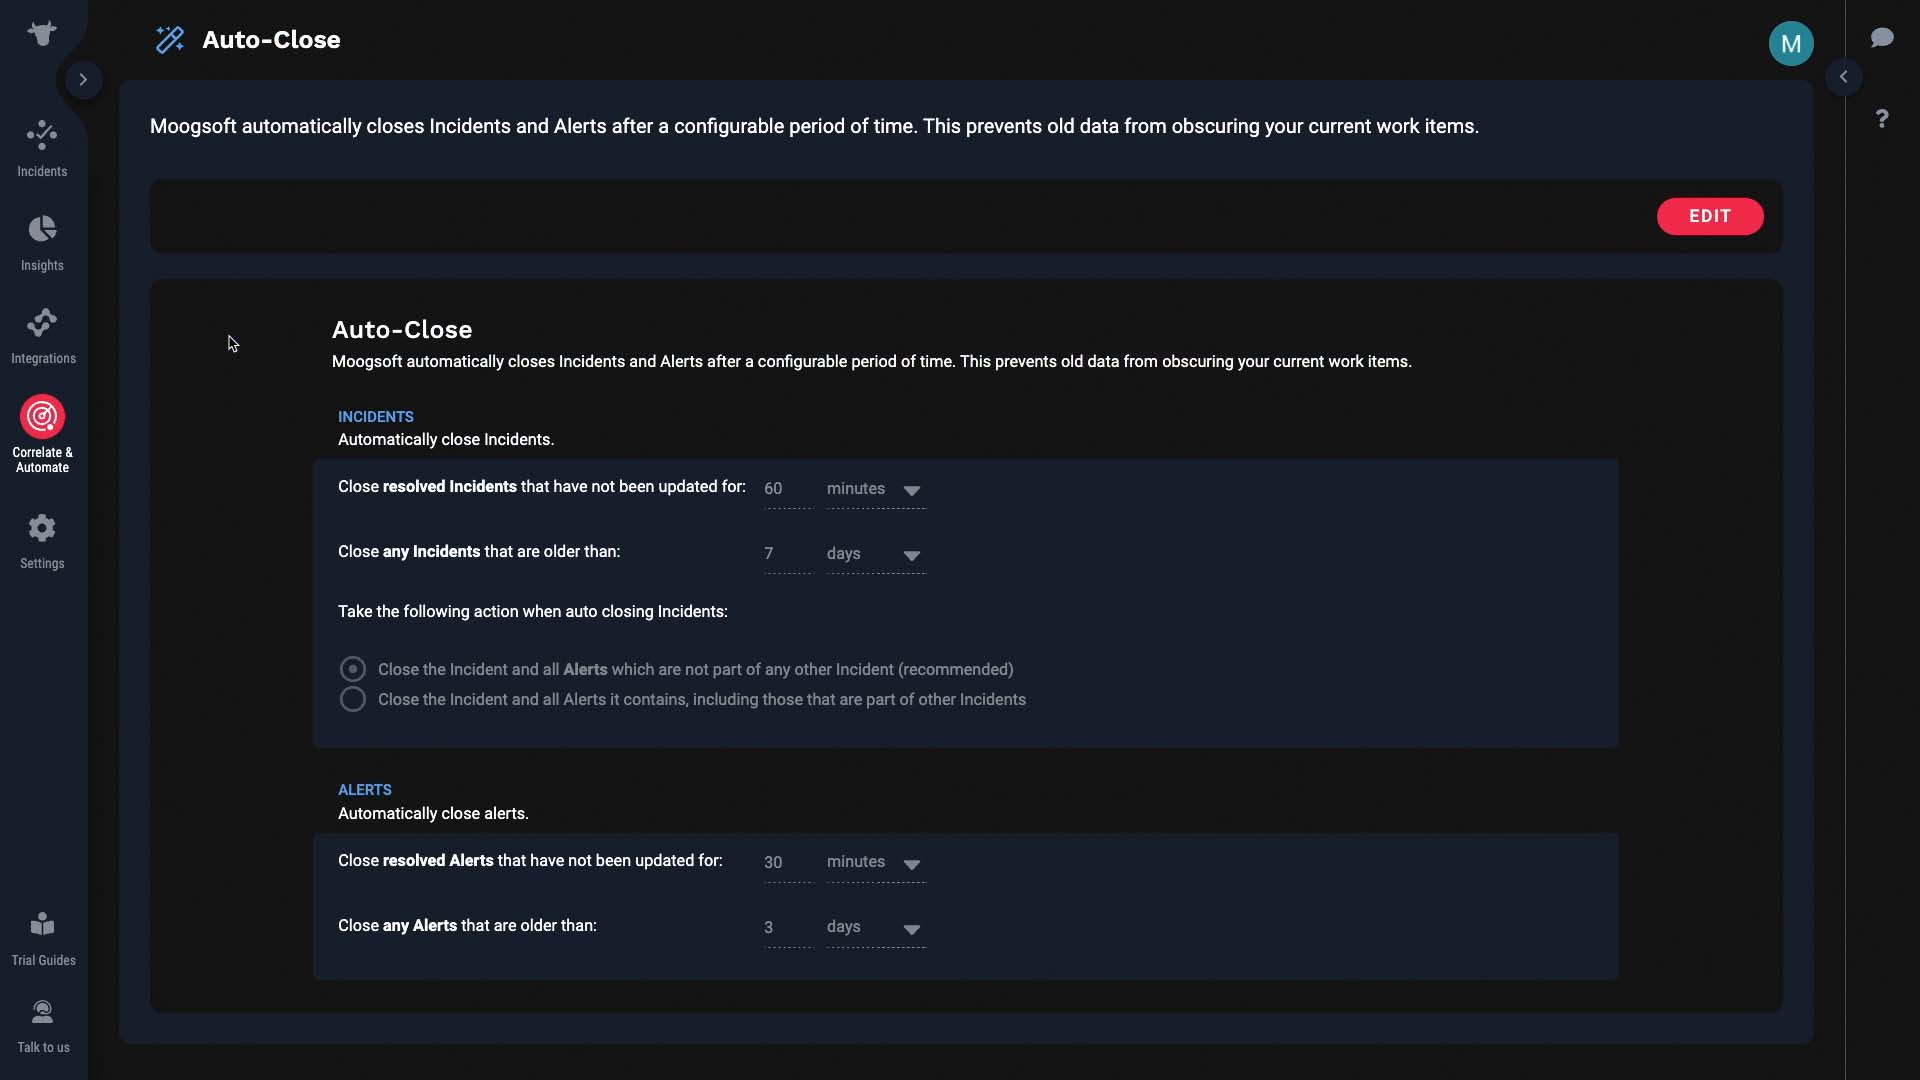
Here’s the default behavior. If all alerts in an incident are closed, then you no longer need to work on that incident.
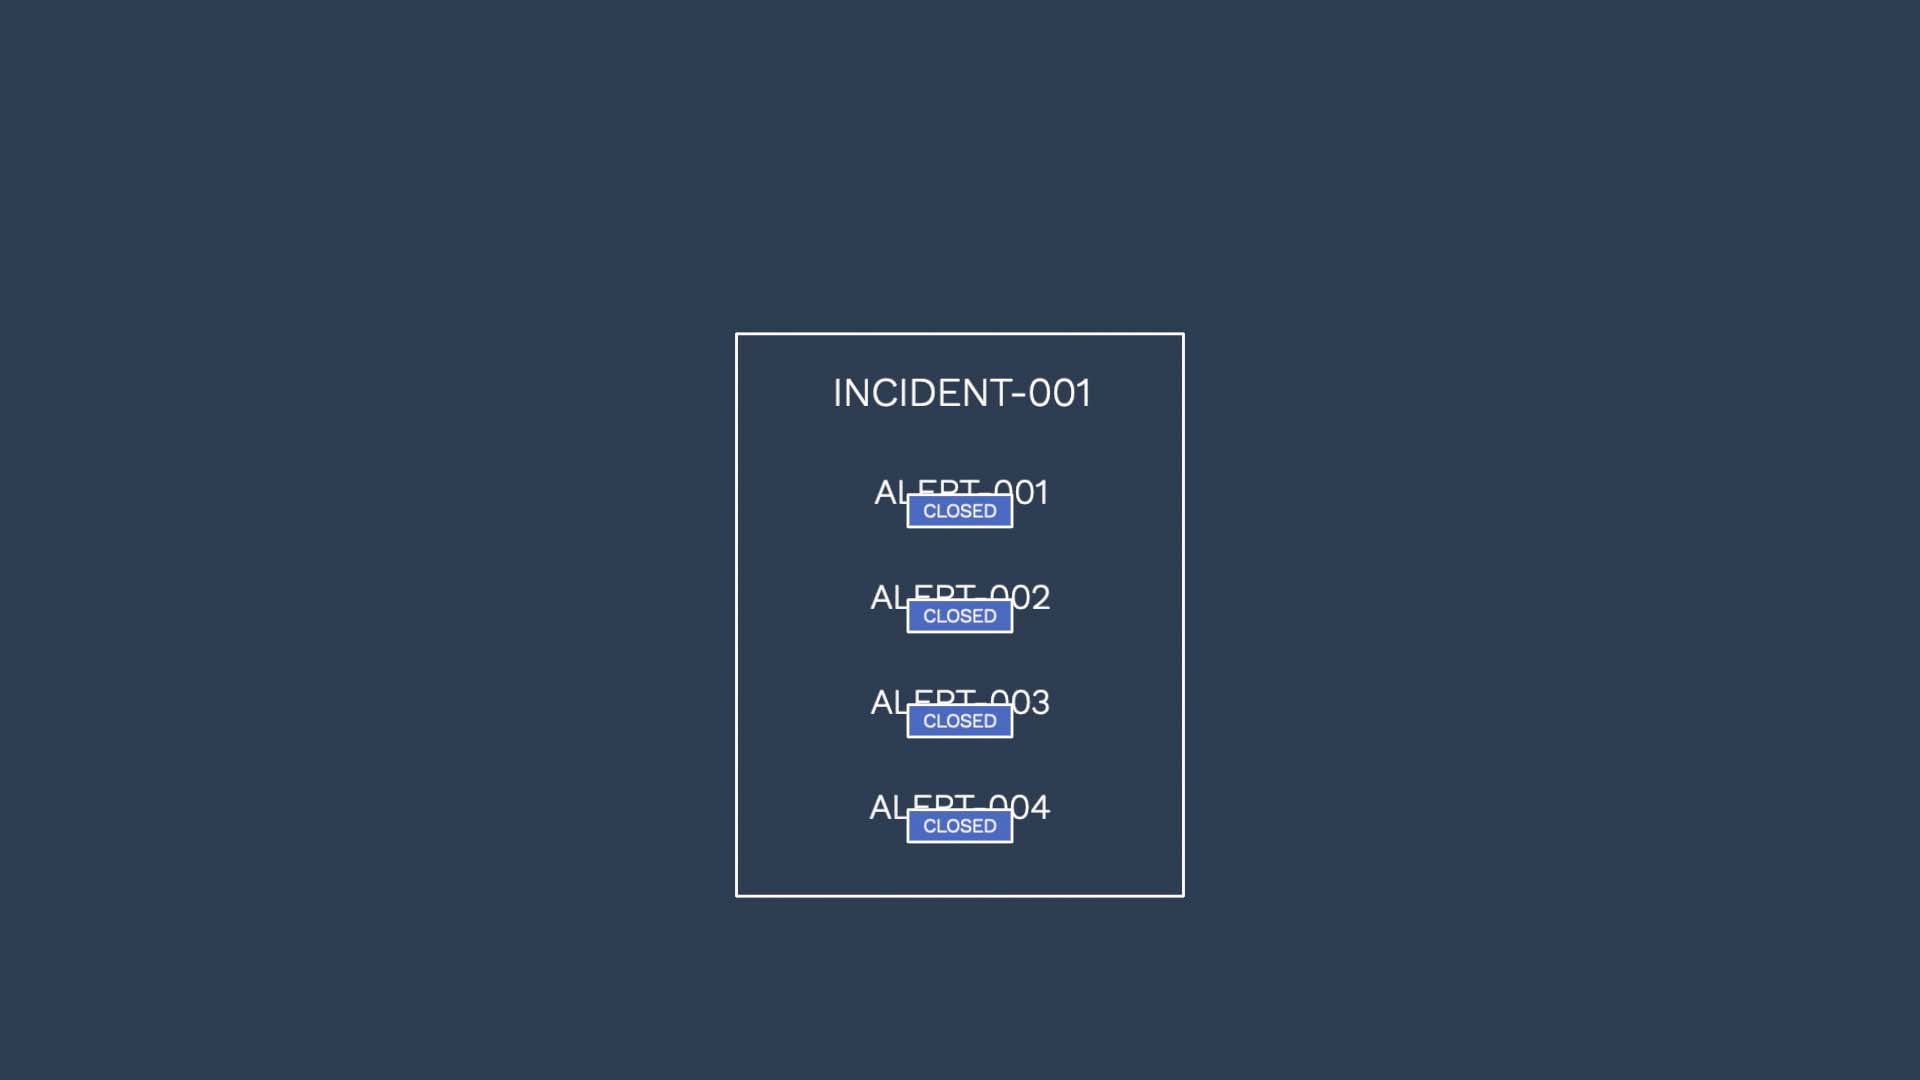
So Incident Management waits for 60 minutes, then auto-close the incident.
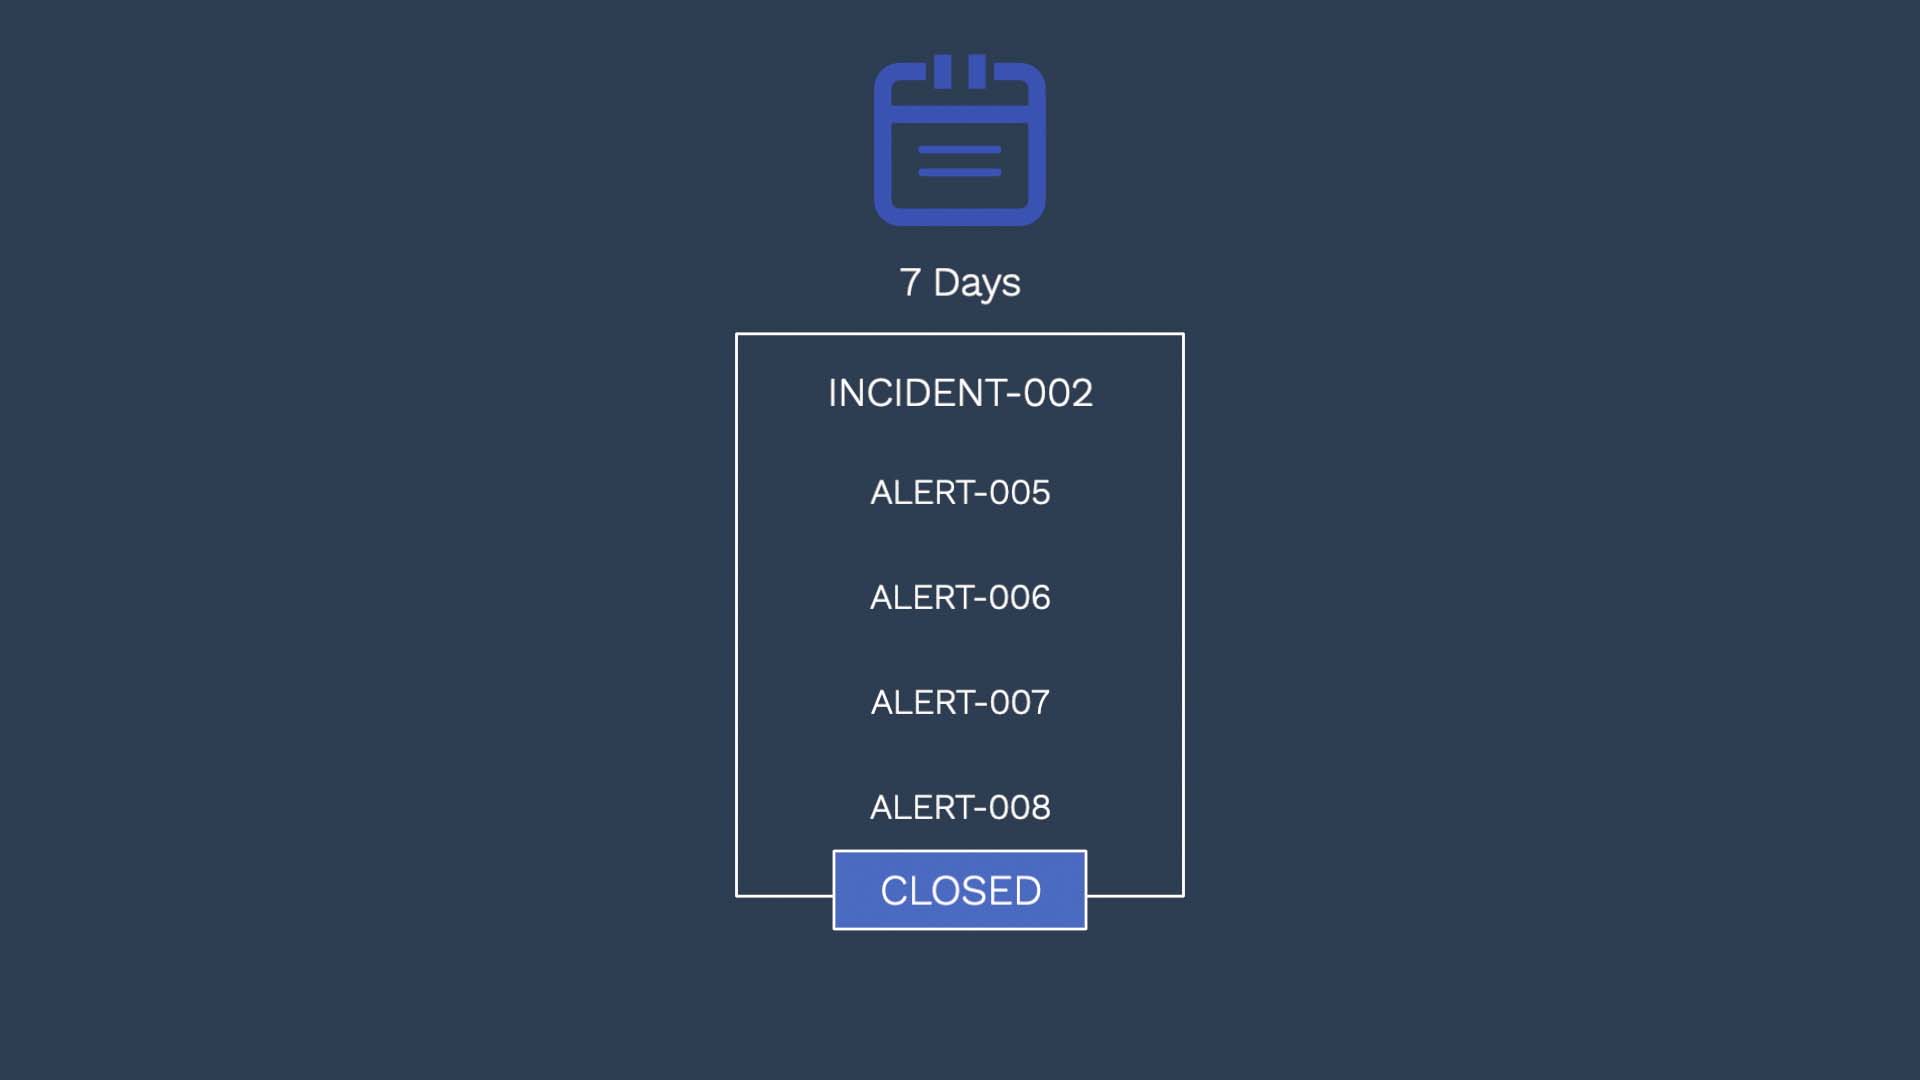
Incidents are also auto-closed if it stays unclosed for 7 days. Because honestly, you won’t be working on such an old incident, would you?
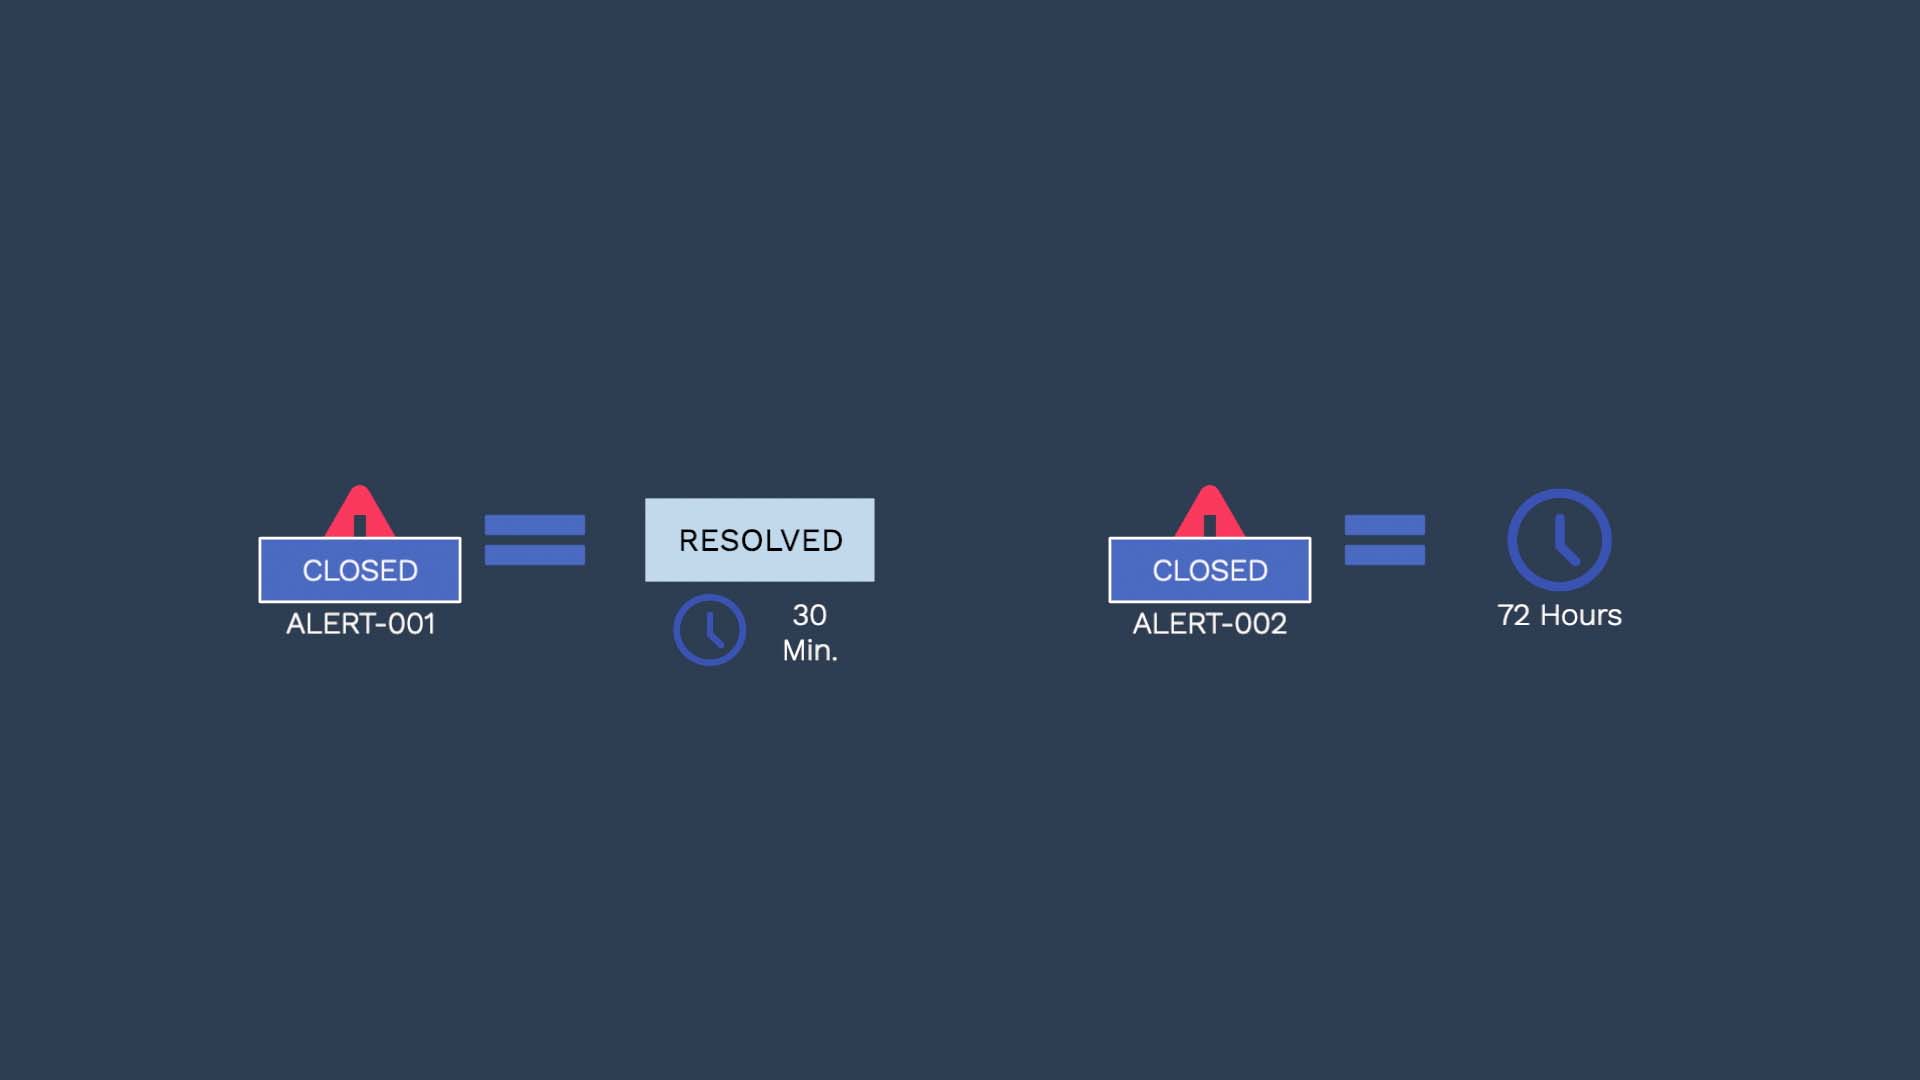
On the alert side, if an alert is resolved Incident Management will change the status of it after half an hour. Alerts also gets closed if they are still open after 72 hours since it’s reported.
You can change the default settings from here.
But remember, incidents and alerts are interrelated. So not only a change in one incident can affect multiple alerts included in that incident,
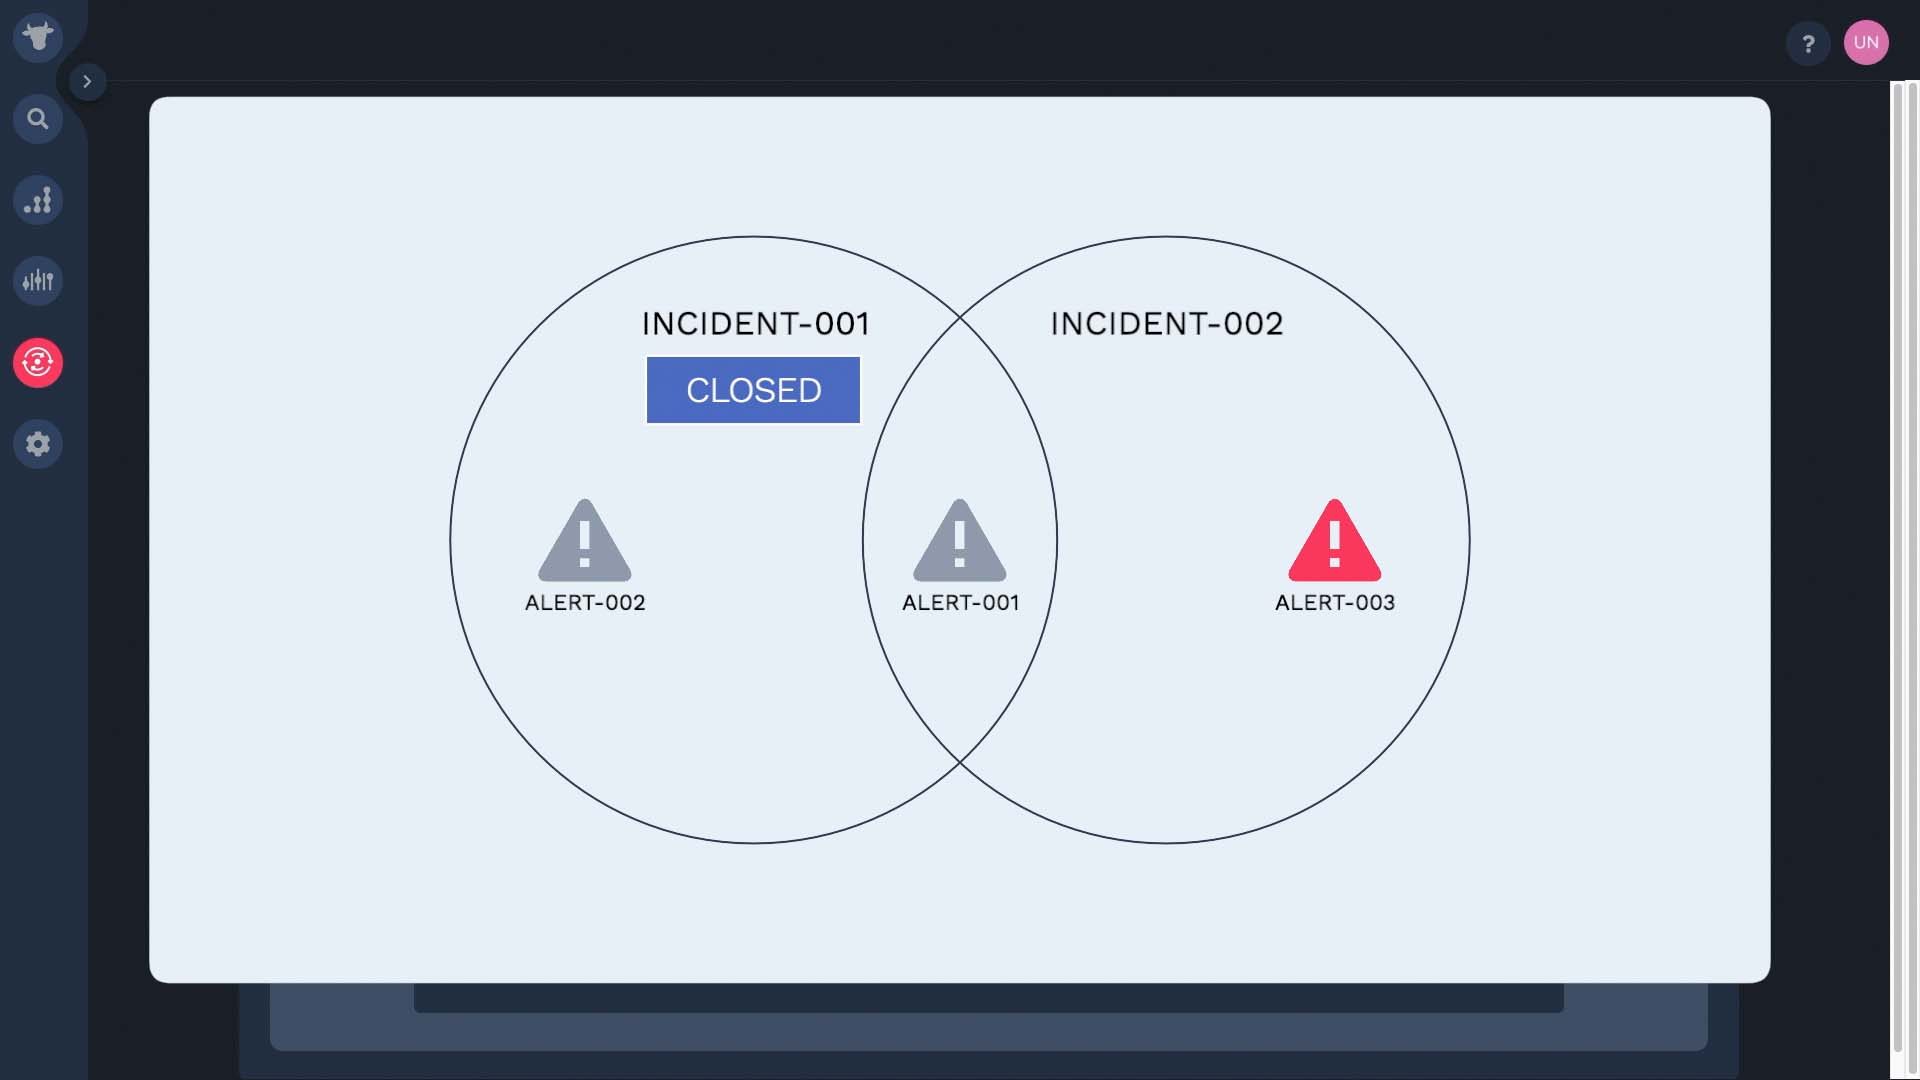
but also a change in status with one alert can affect multiple incidents.